323 323 Braz. J. Biol., 2017, vol. 77, no. 2, pp. 323-331
http://dx.doi.org/10.1590/1519-6984.14015 Original Article
Seasonal variation of limnological features and trophic state index of
two oligotrophic reservoirs of southeast Brazil
S. A. Oliveira
aand C. E. M. Bicudo
a*
aNúcleo de Pesquisa em Ecologia – NPE, Instituto de Botânica, CP 68041, CEP 04045-972, São Paulo, SP, Brazil
*e-mail: cbicudo@terra.com.br
Received: September 8, 2015 – Accepted: February 24, 2016 – Distributed: May 31, 2017 (With 5 figures)
Abstract
Limnological features of two reservoirs were studied in dry (August 2013) and rainy (January 2014) periods to evaluate the water quality that supply the city of Guarulhos, southeast Brazil. Water samples were collected in three depths and the following characteristics were measured: alkalinity, dissolved O2, free and total CO2, HCO3, soluble reactive silica, dissolved and total nitrogen and phosphorus, and chlorophyll-a. Water transparency was also measured and temperature, pH and electric conductivity profiles were obtained. Great seasonal and low spatial variability of the water characteristics occurred in the reservoirs. High values of water transparency, free CO2 availability, and low of pH, soluble reactive silica and total and dissolved nutrients values were recorded at the dry period, and different conditions were found at the rainy season. The two reservoirs were characterized by low nutrients, chlorophyll-a and turbidity, and high transparency, these features being typical of oligotrophic systems. The two reservoirs still remain under low anthropogenic impact conditions, and are presently considered reference systems for the SPMR, São Paulo Metropolitan Region. The need for actions that will reduce the input of nutrients from the neighboring cities and the main tributaries of the hydrographic basin is emphasized to maintain the ecological quality of the reservoirs and their reference conditions among the SPRM reservoirs.
Keywords: oligotrophy, reference system, reservoir, seasonality.
Variação sazonal das características limnológicas e Índice de Estado Trófico
de dois reservatórios oligotróficos do sudeste do Brasil
Resumo
Características limnológicas de dois reservatórios foram estudadas durante os períodos seco (Agosto 2013) e de chuvas (Janeiro 2014) para avaliar a qualidade da água que abastece a cidade de Guarulhos, Brasil sudeste. Amostras de água foram coletadas em três profundidades e as características estudadas foram: alcalinidade, O2 dissolvido, CO2 livre e total, HCO3, sílica reativa solúvel e nitrogênio e fósforo dissolvido e total e clorofila-a. Transparência da água foi
medida e obtidos os perfis de temperatura, pH e condutividade elétrica. Grande variabilidade sazonal e espacial das características da água ocorreu nos reservatórios. Altos valores de transparência da água, disponibilidade de CO2 livre e menores de pH, sílica reativa solúvel e nutrientes totais e dissolvidos foram documentados durante o período seco; e condições diferentes durante o período de chuvas. Os dois reservatórios foram caracterizados por baixos teores de nutrientes, clorofila-a e turbidez e alta transparência, características estas típicas de sistemas oligotróficos. Os dois
reservatórios ainda permanecem sob condição de baixo impacto antropogênico e são atualmente considerados sistemas de referência para a RMSP, Região Metropolitana de São Paulo. A necessidade de ações para diminuir e até frear a entrada de nutrientes provenientes das cidades vizinhas e dos principais afluentes da bacia hidrográfica é enfatizada para manter a qualidade ecológica dos reservatórios e suas condições de referência entre os reservatórios da RMSP. Palavras-chave: oligotrofia, sistema de referência, reservatório, sazonalidade.
1. Introduction
Maintenance of water resources quality of our Planet is a paramount preoccupation both for the importance of their conservation and their diversified uses. Certain areas in Brazil already have their public supply water reserve partially threatened, especially those of the great urban centers. Among the many reasons that would explain this
situation are the inadequate soil use and occupation, the water resources unsustainable management and the great population growth (Tundisi, 2003).
the great number of studies emphasizing its sources, the solution for this problem is yet far from being reached (Sayer and Roberts, 2001); consequently, knowledge of the natural conditions of an aquatic system existing prior to any disturbance is fundamental and absolutely crucial for the implementation of recovery strategies and management of potential impacts (Vilaclara et al., 1997).
Regarding the urban reservoirs in particular, most modifications of their water limnological characteristics derive from the hydrographical basin, that is able to vary rapid and intensively due to the nature and composition of its tributaries (Räsänen, 1986). The difficulty in handling reservoirs water quality comes from the dynamic nature of these systems, since they are important convergence points of the different activities being developed in its hydrographic basin (Tundisi et al., 2008). The multiple human activities and their impact surely will reflect on the water ecological quality of such reservoirs (Rebouças, 1999).
Many SPMR, São Paulo Metropolitan Region reservoirs are being pushed by different types of impacts, inferring that the nationwide socio-environmental situation is directly related to the urban growth, the unplanned soil occupation and the threatening urbanization of the hydrographic basins (Tundisi and Matsumura-Tundisi, 2008). The surrounding area of urban reservoirs and their tributaries are increasingly submitted to the punctual factors resulting from the chaotic urban occupation and the insufficiently managed waste and sanitary sewage production that directly affect the aquatic environment equilibrium (Tomanik et al., 2009) and, therefore, the quality of the population water supply. Tanque Grande and Cabuçu reservoirs are used for public supply and provide water for about 1.3 million people, and are included under the above situation.
For Tanque Grande and Cabuçu reservoirs there are only four papers published: Moutinho et al. (2007), Graça et al. (2007), Lacava et al. (2009) and Piasentin et al. (2009). Considering the importance of knowing the quality of the water of these reservoirs for their preservation, present research aimed at contributing to the seasonal evaluation of the limnological aspects and the ecological quality of Tanque Grande and Cabuçu reservoirs through the evaluation of their physical and chemical characteristics.
2. Material and Methods
2.1. Study area
The two reservoirs are located in the Municipality of Guarulhos, São Paulo State, and southeastern Brazil (Figure 1). Guarulhos is the second largest municipality of the SPMR in terms of population, with c. 1.3 million people. It covers the area of 319 km2, the main city being located northeast of that of São Paulo (23º27’49”S, 46º32’01”W).
Tanque Grande reservoir was built in 1958 at the north region of the municipality (23º22’27”S, 46º27’36”W). It has the area of 0.54 km2, storage capacity of 77,401 m3, discharge of 315,000 m3 month-1 and retention time of 7.35 days (Silva et al., 2011; CETESB, 2014). Its hydrographic basin
includes seven streams that will flow into the reservoir responsible for 10% of the municipality water supply.
Cabuçu reservoir is located in the Cantareira State Park (CSP), at the southern part of the municipality (22º24’06”S, 46º31’56”W). The reservoir was built in 1904 to water supply the city of São Paulo, being deactivated when the Cantareira system started operating in 2002 (Lacava et al., 2009). The reservoir has a discharge of 300 L s-1, the volume of 1,776 x 106 L distributed in 1.5 km, total area of over 20 ha and the retention time of 68.51 days (Lacava et al., 2009).
2.2. Sampling
Three sampling sites were selected in each reservoir considering the influence of the main tributaries, the water quality heterogeneity and the system depth (Figure 1).
Water samples were collected during the dry (August 2013) and rainy (January 2014) periods, using a van Dorn bottle along a vertical profile (euphotic zone, mean depth and c. 1 m above the sediments) and placed in polyethylene vials for transportation to the laboratory. Temperature, pH and electric conductivity profiles were obtained ‘in situ’ at each 50 cm of the water column using a Horiba U50 multi-parameter probe.
The following water characteristics were measured: transparency (Secchi disk), alkalinity (Golterman and Clymo, 1969), dissolved oxygen (Golterman et al., 1978), free CO2, total CO2 and HCO3 (Mackereth et al., 1978), ammonium (Solorzano, 1969), nitrate and nitrite (Mackereth et al., 1978), soluble reactive phosphorus, total dissolved phosphorus and soluble reactive silica (Strickland and Parsons, 1965), and total nitrogen and total phosphorus (Valderrama, 1981). Chlorophyll-a (corrected by the phaeophytin) was extracted using ethanol 90% as the organic solvent (Sartory and Grobbelaar, 1984). 2.3. Data analysis
Data were evaluated using Principal Components Analysis (PCA) to ordain the sampling units and the environmental information according to the climatic periods, and were previously transformed by ranging [(x - xmin)/(x
max - xmin)].
Randomization test (999 permutations) was employed to understand the PCA dimension (p < 0.05). Statistical program used was PC-ORD 6.0 (McCune and Mefford, 2011).
The Trophic State Index (TSI) was calculated according to Lamparelli (2004). Considering the surface total phosphorus and chlorophyll-a, TSI can classify the aquatic environment into six trophy categories: TSI ≤ 47 (ultraoligotrophic), 48-52 (oligotrophic), 53-59 (mesotrophic), 60-63 (eutrophic), 64-67 (supereutrophic) and > 67 (hypereutrophic).
3. Results
Braz. J. Biol., 2017, vol. 77, no. 2, pp. 323-331 325 Limnology in oligotrophic systems
325 (Tanque Grande 26°C, Cabuçu 22.6°C) and lower in August
(Tanque Grande 18.2°C, Cabuçu 16°C).
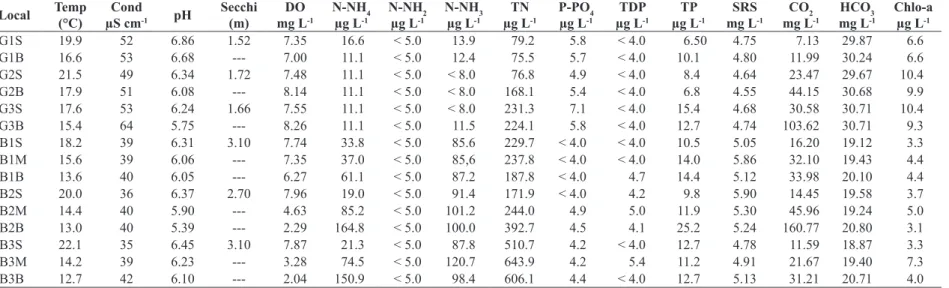
Secchi disk depth was higher during August at all sampling sites of both reservoirs, showing little variation among sampling sites. During August, the lowest values were measured at the in-between sites and during January, the highest values were measured near the dam (Tables 1, 2).
At the Tanque Grande reservoir, pH (Tables 1, 2) was slightly acidic during the two climatic periods, getting close to neutral mainly during January. At the Cabuçu, however, pH varied from slightly acidic to alkaline, its lowest values recorded in August. Highest electric conductivity was observed at the Tanque Grande reservoir, and the values varied between 49 and 64 µS cm–1 in August and between
62 and 67 µS cm–1 in January. At the Cabuçu reservoir, however, its variation was slightly lesser in August and the values were homogeneous along the water column during the entire period, whereas in January their values increased towards the bottom of reservoir (Tables 1, 2).
Braz. J. Biol., 2017, vol. 77, no. 2, pp. 323-331
Oliveira, S.A. and Bicudo, C.E.M.
Local Temp
(°C)
Cond µS cm-1 pH
Secchi (m)
DO mg L-1
N-NH4 µg L-1
N-NH2 µg L-1
N-NH3 µg L-1
TN µg L-1
P-PO4 µg L-1
TDP µg L-1
TP µg L-1
SRS mg L-1
CO2 mg L-1
HCO3 mg L-1
Chlo-a µg L-1
TG1S 19.9 52 6.86 1.52 7.35 16.6 < 5.0 13.9 79.2 5.8 < 4.0 6.50 4.75 7.13 29.87 6.6
TG1B 16.6 53 6.68 --- 7.00 11.1 < 5.0 12.4 75.5 5.7 < 4.0 10.1 4.80 11.99 30.24 6.6
TG2S 21.5 49 6.34 1.72 7.48 11.1 < 5.0 < 8.0 76.8 4.9 < 4.0 8.4 4.64 23.47 29.67 10.4
TG2B 17.9 51 6.08 --- 8.14 11.1 < 5.0 < 8.0 168.1 5.4 < 4.0 6.8 4.55 44.15 30.68 9.9
TG3S 17.6 53 6.24 1.66 7.55 11.1 < 5.0 < 8.0 231.3 7.1 < 4.0 15.4 4.68 30.58 30.71 10.4
TG3B 15.4 64 5.75 --- 8.26 11.1 < 5.0 11.5 224.1 5.8 < 4.0 12.7 4.74 103.62 30.71 9.3
CB1S 18.2 39 6.31 3.10 7.74 33.8 < 5.0 85.6 229.7 < 4.0 < 4.0 10.5 5.05 16.20 19.12 3.3
CB1M 15.6 39 6.06 --- 7.35 37.0 < 5.0 85,6 237.8 < 4.0 < 4.0 14.0 5.86 32.10 19.43 4.4
CB1B 13.6 40 6.05 --- 6.27 61.1 < 5.0 87.2 187.8 < 4.0 4.7 14.4 5.12 33.98 20.10 4.4
CB2S 20.0 36 6.37 2.70 7.96 19.0 < 5.0 91.4 171.9 < 4.0 4.2 9.8 5.90 14.45 19.58 3.7
CB2M 14.4 40 5.90 --- 4.63 85.2 < 5.0 101.2 244.0 4.9 5.0 11.9 5.30 45.96 19.24 5.0
CB2B 13.0 40 5.39 --- 2.29 164.8 < 5.0 100.0 392.7 4.5 4.1 25.2 5.24 160.77 20.80 3.1
CB3S 22.1 35 6.45 3.10 7.87 21.3 < 5.0 87.8 510.7 4.2 < 4.0 12.7 4.78 11.59 18.87 3.3
CB3M 14.2 39 6.23 --- 3.28 74.5 < 5.0 120.7 643.9 4.2 5.4 11.2 4.91 21.67 19.40 7.3
CB3B 12.7 42 6.10 --- 2.04 150.9 < 5.0 98.4 606.1 4.4 < 4.0 12.7 5.13 31.21 20.71 4.0
Legend: S (surface); M (intermediate depth); and B (1 m from the bottom); (smaller than the method detection limit).
Table 2. Limnological variables of Tanque Grande (TG) and Cabuçu (CB) reservoirs in January.
Local Temp
C
Cond µS cm-1 pH
Secchi m
DO mg L-1
N-NH4 µg L-1
N-NH2 µg L-1
N-NH3 µg L-1
TN µg L-1
P-PO4 µg L-1
TDP µg L-1
TP µg L-1
SRS mg L-1
CO2 mg L-1
HCO3 mg L-1
Chlo-a µg L-1
TG1S 27.39 63 7.33 0.78 6.35 < 10.0 < 5.0 < 8.0 283.1 9.0 5.5 23.0 6.13 2.65 35.08 4.9
TG1B 24.84 67 6.80 --- 6.63 < 10.0 < 5.0 < 8.0 225.3 9.3 6.8 12.9 6.09 9.04 35.32 3.8
TG2S 27.34 63 6.89 0.69 6.54 < 10.0 < 5.0 < 8.0 192.3 10.2 6.4 11.5 6.03 7.58 36.42 5.5
TG2B 25.45 63 6.79 --- 7.18 < 10.0 < 5.0 < 8.0 157.5 13.4 8.4 11.1 6.03 9.41 35.94 4.9
TG3S 26.54 62 6.54 1.15 9.49 < 10.0 < 5.0 < 8.0 181.9 8.6 8.0 12.9 5.92 22.49 48.29 3.3
TG3B 24.87 65 6.76 --- 3.54 < 10.0 < 5.0 < 8.0 159.8 9.2 7.5 10.6 6.03 10.20 36.33 4.4
CB1S 25.79 38 8.48 1.45 8.64 < 10.0 < 5.0 < 8.0 303.0 7.0 13.9 19.4 2.87 0.10 18.36 11.0
CB1M 25.67 37 7.36 --- 7.14 12.0 < 5.0 12.9 384.0 7.0 13.6 26.1 2.93 1.36 19.25 18.7
CB1B 21.32 44 6.30 --- 3.50 46.2 9.3 82.0 543.4 8.2 16.4 23.8 3.12 17.00 19.61 13.2
CB2S 26.19 38 7.37 1.97 8.63 < 10.0 < 5.0 < 8.0 243.8 7.3 13.5 16.2 2.76 1.36 19.74 8.3
CB2M 23.30 38 6.47 --- 1.74 97.7 6.3 24.8 430.9 8.0 11.7 21.0 3.11 11.13 20.34 26.4
CB2B 17.05 101 6.59 --- 0.78 1019.3 18.7 < 8.0 1910.6 8.2 14.1 9.7 4.07 17.16 35.19 55.2
CB3S 26.72 38 7.29 2.15 7.60 < 10.0 < 5.0 < 8.0 239.3 9.9 13.9 17.4 2.75 1.64 19.81 5.7
CB3M 21.36 40 6.32 --- 1.60 39.1 5.2 < 8.0 367.0 7.9 11.4 25.2 3.19 17.70 21.38 48.3
CB3B 16.34 103 6.50 --- 0.59 830.6 16.1 < 8.0 1552.8 8.3 12.9 9.7 4.14 20.56 34.27 49.6
Braz. J. Biol., 2017, vol. 77, no. 2, pp. 323-331 327 Limnology in oligotrophic systems
327 showed a tendency towards its reduction to the bottom
of reservoir. In January, however, the tendency was more stressed at all sampling sites, the bottom concentrations almost reaching anoxia (Table 2).
The N series (NH4, NO3 and TN) exhibited in Tanque Grande reservoir low and similar values in the two climatic periods sampled (Tables 1, 2, Figure 2). At the Cabuçu reservoir, the highest NH4 values were recorded in January, whereas those of NO3 were in August. Highest values of TN were found in January, and an increasing gradient was observed towards the bottom of reservoir (Tables 1, 2, Figure 2a, b and c).
Phosphorus total and dissolved forms showed low values, in some cases below the method detection limit as
was the case of dissolved TP of Tanque Grande reservoir in August. At the Cabuçu reservoir, P dissolved fractions were low in August. Highest TP values were detected in January, and the greatest ones at the reservoir surface (Table 2, Figure 2f). Regarding the spatial scale, TP highest values were obtained at the sampling sites located near to the tributaries entrance.
Tanque Grande surface chlorophyll-a concentrations were higher in August, whereas at the Cabuçu reservoir the opposite occurred, i.e. the highest values being obtained in January (Tables 1, 2, Figure 3).
Principal Components Analysis considering 12 limnological variables resumed 64.8% of data total variability (Table 3, Figure 4). August sampling units
Figure 2. Ammonium (a), Nitrate (b), Total nitrogen (c), Orthophosphate (d), Total dissolved phosphorus (e) and Total
gathered at the negative side of axis 1 were mainly associated with the water transparency (Secchi disk) and NO3 (r > 0.8) greatest values as well as the lowest ones of temperature and dissolved TP. At the positive side of this axis were assembled the January sampling units associated to the highest temperature, PO4 and pH (r > 0.8) values and the smallest ones of water transparency and NO3. At the positive side of axis 2, were the Tanque Grande sampling units and some surface sampling units of the Cabuçu reservoir intermediate region, associated to the DO and SRS highest values (r > 0.7). At the negative side of this axis, Cabuçu sampling units were positioned associated to the highest TN and NH4 values (r > 0.6) and the lowest ones of DO and SRS. Thus, axis 1 ordained the sampling units in regard to seasonality, whereas axis 2 did it in relation to the reservoir’s compartments differences. The Trophic State Index (Figure 5) classified oligotrophic the Tanque Grande reservoir in August, except for the pelagic zone that was considered mesotrophic. In January the opposite occurred, i.e. the reservoir was classified mesotrophic and its sampling site TG3 oligotrophic. The Cabuçu reservoir was classified oligotrophic in August and mesotrophic in January. Considering the TSI annual average, however, both reservoirs were classified oligotrophic, except for its upstream sampling site that was classified mesotrophic (Table 4).
4. Discussion
The greatest limnological variation currently observed for the Guarulhos Producing System occurred according to the seasonal scale (dry and rainy periods), an already known characteristic of tropical and subtropical reservoirs (Naselli-Flores, 1999; Ferrareze et al., 2005; Sartori et al., 2009). Differences among reservoirs were also detected. Temperature values followed the pattern defined for the tropical region, i.e. mild during August and higher in January. Surface water temperature is affected by several factors including depth and the presence of surrounding vegetation (Percebon et al., 2005). It was presently observed that milder temperatures were registered at the Cabuçu reservoir due to its well preserved surroundings, differently than in Tanque Grande when 4ºC and 2ºC were recorded in January and August, respectively.
A joint evaluation of abiotic data indicated that both reservoirs were similar in August mainly because of the greatest water transparency and DO values and of CO2, SRS and NO3 availability, and the smallest values of
Table 3. Correlation of the limnological variables with PCA axes 1 and 2 (between parentheses: acronyms).
Variable Axis 1 Axis 2 Variable Axis 1 Axis 2
Temperature (Temp) 0.868 0.255 Total nitrogen (TN) -0.027 -0.731
pH 0.772 0.022 Total phosphorus (TP) 0.278 -0.446
Secchi depth -0.815 -0.359 Silicate (SSR) -0.373 0.696
Dissolved oxygen (DO) 0.184 0.724 Orthophosphate (PO
4) 0.824 0.030
Ammonium (NH
4) -0.042 -0.621 Free CO2 (CO2) -0.535 -0.052
Nitrate (NO3) -0.838 -0.168 Total dissolved phosphorus (TDP) 0.675 -0.682 Figure 3. Chlorophyll-a concentration (µg L-1) at the surface
of Tanque Grande and Cabuçu reservoirs during the two climatic periods studied.
Figure 4. Principal Components Analyses (PCA) based on 12 limnological variables of the sampling sites of Tanque Grande
(TG) and Cabuçu (CB) reservoirs during August and January of present study. Legend: S (surface); M (intermediate depth); and F (1 m from the bottom).
Figure 5. Trophic State Index of Tanque Grande and Cabuçu
Braz. J. Biol., 2017, vol. 77, no. 2, pp. 323-331 329 Limnology in oligotrophic systems
329 temperature, pH, PO4 and dissolved TP. In January, the
reverse occurred, i.e. lower values of water transparency and DO, of CO2, SRS and NO3 availability, and greater values of temperature, pH, PO4 and dissolved TP.
Water transparency was greater in August than in January, and was related to the lower amount of precipitation that led to a lesser input of particulate material during the period, as was registered by Wengrat and Bicudo (2011) for the Billings Complex.
Heterogeneous pattern of dissolved oxygen distribution along the water column was found in August, with a concentration reduction with depth. O2 concentration reduction at the bottom of reservoir shall be related to the organic matter decomposition at the bottom of reservoir, which led to a high CO2 production and, consequently, to a high O2 consumption (Hill et al., 1993).
pH variation range in the two reservoirs studied is characteristic of unpolluted continental waters (Kalff, 2002). Both reservoirs exhibited similar pH values along the water column and also among the sampling sites, however slightly smaller in August. In relation to the several factors affecting the pH, interpretation in nature may become somewhat complex (Esteves, 2011). According to Nascimento (2012), smaller pH favors an increase of CO2 concentrations depending on the equilibrium between pH and the carbon inorganic forms, similar to what was observed in the present study. Furthermore, higher CO2 values may be associated with the increase of respiration and the organic matter decomposition processes (Branco, 1966).
Soluble reactive silica availability seems to be related to the stratification and circulation periods. Circulation allows a greater SRS availability along the water column (Wetzel, 2001). Nevertheless, during the present study the smallest SRS concentrations were measured. A small variation of temperature in relation to the increase in depth leads to a homogeneous SRS distribution along the water column and the reduction of Si concentration at the reservoir surface (Esteves, 2011).
Both reservoirs were characterized by a low nutrient concentration in total and dissolved forms that are emblematic of oligotrophic systems (Arcifa et al., 1981; Bicudo et al., 2002; Lopes et al., 2005; Tundisi et al., 2006). However, integration of the limnological data allowed also differences between the two reservoirs. Thus, Cabuçu showed higher TP and TN and a higher HCO3 availability when compared to Tanque Grande reservoir. Considering that the latter reservoir is inserted in a preservation area (“Reserva
Florestal do Núcleo Cabuçu”) it is much probable that its enrichment is a natural process.
Longitudinal gradient in reservoirs represented by the zones under influence of the system regimen flux differ from each other in terms of their local physical, chemical and biological characteristics (Thorton et al., 1990). Variation in the nutrient contents along the longitudinal gradient was already observed in several reservoirs, as in Segredo (Thomaz et al., 1997) and Salto Grande (Zanata and Espíndola, 2002). In the present study, similarity among the sampling sites of each reservoir was observed. This fact should be associated to that of the reservoirs having about the same depth along their entire extensions.
Both Tanque Grande and Cabuçu reservoirs were classified oligotrophic, except for the Cabuçu upstream sampling site classified mesotrophic (TSI = 53.1), however, very close to the oligotrophy zone upper limit (TSI = 47-52). Downstream sampling site was classified mesotrophic mainly because of the influence of its greater August chlorophyll-a values. However, such results compared to the eutrophic reservoirs like the Guarapiranga at its intake site (57.74 µg L-1) and the Billings main body (65.22 µg L-1) (CETESB, 2014) should be considered somewhat low. Present values coincide with those measured for oligotrophic to mesotrophic reservoirs like Jaguari-Jacareí (Nascimento, 2012: < 8.3 µg L-1), Pedro Beicht (Silva, 2012: 9.5 µg L-1), Ribeirão Perová (< 0.01 µg L-1) and Ribeirão dos Cristais (0.76 µg L-1) mentioned in CETESB (2014).
5. Conclusion
The Guarulhos Producing System showed low dissolved nutrient’s concentrations, besides low values of total phosphorus and chlorophyll-a, that are characteristic of the reservoir’s oligo-mesotrophic classification. Also were coincident due to slightly acidic pH and good oxygen availability. These characteristics indicate that Tanque Grande and Cabuçu reservoirs are still subjected to small anthropogenic impact and/or some satisfactory level of alteration.
Acknowledgements
This work was supported by funds provided by FAPESP, Fundação de Amparo à Pesquisa do Estado de São Paulo (Project nº 2009/53898-9). SAO and CEMB thank CNPq, Table 4. Trophic State Index for chlorophyll-a (TSI Chlo-a) and total phosphorus (TSI TP), average index (TSI average) and
yearly classification Meso (mesotrophic), Oligo (oligotrophic). Aug (August), Jan (January).
Reservoir Site TSI Chlo-a TSI TP TSI average Classification
Aug Jan Aug Jan Aug Jan Aug Jan Annual
Tanque Grande
TG1 56.0 54.6 45.8 53.5 50.9 54.0 Oligo Meso Oligo
TG2 58.2 55.1 47.3 49.3 52.8 52.2 Oligo Meso Oligo
TG3 58.2 52.6 51.0 50.0 54.6 51.3 Meso Oligo Oligo
Cabuçu
CB1 52.6 58.5 48.7 52.4 50.7 55.5 Oligo Meso Meso
CB2 53.2 57.1 48.3 51.3 50.7 54.2 Oligo Meso Oligo
Conselho Nacional de Desenvolvimento Científico e Tecnológico for the scholarship granted to the first author and to research grant to the second one (CEMB). Authors are also grateful to Prof. William de Queiróz (Universidade de Guarulhos, Geoprocessing Laboratory) for providing the illustration of the study area.
References
ARCIFA, M.S., CARVALHO, M.A.J., GIANESELLA-GALVÃO, S.M.F., SHIMIZU, G.Y., FROEHLICH, C.G. and CASTRO, R.M.C., 1981. Limnology of ten reservoirs in Southeastern Brazil. Verhandlungen der Internationale Vereinigung der Limnologie, vol. 21, pp. 1048-1053.
BATTARBEE, R.W., ANDERSON, N.J.E. and JEPPENSEN, E., 2005. Combining paleolimnological and limnological approaches in assessing lake ecosystem response to nutrient reduction. Freshwater Biology, vol. 50, no. 10, pp. 1772-1780. http://dx.doi. org/10.1111/j.1365-2427.2005.01427.x.
BICUDO, D.C., FORTI, M.C., CARMO, C.F.C., BOUROTTE, C., BICUDO, C.E.M., MELFI, A. and LUCAS, Y., 2002. A
atmosfera, as águas superficiais e os reservatórios no PEFI:
caracterização química. In: D.C. BICUDO, M.C. FORTI and C.E.M. BICUDO, eds. Parque Estadual das Fontes do Ipiranga: unidade de conservação ameaçada pela urbanização de São Paulo. São Paulo: Secretaria do Meio Ambiente do Estado de São Paulo, pp. 161-200.
BRANCO, S.M., 1966. Estudos das condições sanitárias da Represa Billings. Arquivos da Faculdade de Higiene e Saúde Pública, vol. 20, no. 1, pp. 57-86. http://dx.doi.org/10.11606/ issn.2358-792X.v20i1p57-86.
COMPANHIA DE TECNOLOGIA DE SANEAMENTO
AMBIENTAL – CETESB, 2014. [viewed 10 October 2014].
Relatório de qualidade das águas interiores do Estado de São Paulo, 2013 [online]. Relatório Técnico. Available from: http://
aguasinteriores.cetesb.sp.gov.br/
ESTEVES, F.A., 2011. Fundamentos de limnologia. 2nd ed. Rio
de Janeiro: Interciência.
FERRAREZE, M.F.F., NOGUEIRA, M.G. and VIANNA, N.C., 2005. Transporte de nutrientes e sedimentos no rio Paranapanema
(SP/PR) e seus principais tributários nas estações seca e chuvosa. In: M.G. NOGUEIRA, R. HENRY and A. JORCIN, eds. Ecologia de reservatórios: impactos potenciais, ações de manejo e sistemas em cascata. São Carlos: Editora RiMa, pp. 435-459.
GOLTERMAN, H.L. and CLYMO, R.S., 1969. Methods for chemical analysis of freshwaters. Oxford: Blackwell Scientific Publications. IBP Handbook, no. 8.
GOLTERMAN, H.L., CLYMO, R.S. and OHMSTAD, M.A., 1978. Methods for physical and chemical analysis of freshwaters. 2nd ed. Oxford: Blackwell Scientific Publications.
GRAÇA, S., GARCIA, M.J. and OLIVEIRA, P.E., 2007. Flora
diatomácea moderna do Lago Estância das Águas Claras, Guarulhos (SP): resultados qualitativos. Revista UnG – Geociências, vol. 6, p. 63-79.
HILL, J.W., FEIGL, D.M. and BAUM, S.J., 1993. Chemistry and life: an introduction to general, organic, and biological chemistry. 4th ed. New York: Macmillan.
KALFF, J., 2002. Limnology. New Jersey: Prentice Hall.
LACAVA, M.A., OLIVEIRA, A.M.S. and PEREIRA-FILHO,
J.P., 2009. Comportamento hídrico de superfície da bacia do Rio
Cabuçu de Cima, Parque Estadual da Cantareira, Guarulhos, SP. Revista Brasileira de Geomorfologia, vol. 10, pp. 23-30. LAMPARELLI, M.C., 2004. Graus de trofia em corpos d’água do Estado de São Paulo: avaliação dos métodos de monitoramento. São Paulo: Universidade de São Paulo, 235 p. Tese de Doutorado
em Ciências na Área de Ecossistemas Terrestres e Aquáticos.
LOPES, M.R.M., BICUDO, C.E.M. and FERRAGUT, M.C., 2005. Short term spatial and temporal variation of phytoplankton in a shallow oligotrophic reservoir, southeast Brazil. Hydrobiologia, vol. 542, no. 1, pp. 235-247. http://dx.doi.org/10.1007/s10750-004-8332-z.
MACKERETH, F.J.H., HERON, J. and TALLING, J.F., 1978. Water analysis: some revised methods for limnologists. Kendall: Ed. Wilson, Son Ltda. 117 p. Freshwater Biological Association Scientific Publication, no. 39.
MCCUNE, B. and MEFFORD, M.J., 2011. PC-ORD. Multivariate analysis of ecological data. Version 6.0 [software]. Gleneden
Beach, Oregon: MjM Software.
MOUTINHO, S.O., GARCIA, M.J. and OLIVEIRA, P.E., 2007.
Flora de diatomáceas do Reservatório Cabuçu, Município de Guarulhos (SP): análise qualitativa. Revista UnG. Geociências, vol. 6, no. 1, pp. 32-62.
NASCIMENTO, M.N., 2012. Biodiversidade e distribuição das diatomáceas planctônicas e de sedimento superficial em represa profunda oligotrófica (Sistema Cantareira, Represa Jaguari-Jacareí). São Paulo: Instituto de Botânica, 151 p. Dissertação de Mestrado em Biodiversidade Vegetal e Meio Ambiente.
NASELLI-FLORES, L., 1999. Limnological aspects of Sicilian
reservoirs: a comparative ecosystemic approach. In: J.G. TUNDISI
and M. STRAŠKRABA, eds. Theoretical reservoir ecology and its applications. Leiden: Backhuys Publishers, pp. 283-311. PERCEBON, C.M., BITTENCOURT, A V.L. and ROSA-FILHO,
E.F., 2005. Diagnóstico da temperatura das águas dos principais
rios de Blumenau, SC. Boletim Paranaense de Geociências, vol. 56, pp. 7-19.
PIASENTIN, A.M., SEMENSATTO-JUNIOR, D.L., SAAD, A.R.,
MONTEIRO-JUNIOR, A.J. and RACZKA, M.F., 2009. Índice
de Qualidade da Água (IQA) do reservatório Tanque Grande Guarulhos (SP): Análise sazonal e efeitos do uso e ocupação do
solo. Geociências, vol. 28, pp. 305-317.
RÄSÄNEN, M., 1986. Recent sedimentation in a freshwater reservoir in SW-Finland: the diatomological and chemical evidence of sediments on the development of the water body. Hydrobiologia, vol. 143, pp. 361-369. http://dx.doi.org/10.1007/BF00026684.
REBOUÇAS, A.C., 1999. Água doce no mundo e no Brasil. In:
A.C. REBOUÇAS, B. BRAGA and J.G. TUNDISI, eds. Águas doces do Brasil: capital ecológico, uso e conservação. São Paulo: Escrituras Editora, pp. 1-37.
SARTORI, A.A.C., BARBOSA, A.P., PISANI, R.J., OLIVEIRA, F.O. and ZIMBACK, C.R.L., 2009. Mapeamento de conflitos de
solo em áreas de preservação permanente na Bacia Experimental
do Rio Pardo, São Paulo, Brasil. In: Anais do XIV Simpósio Brasileiro de Sensoriamento Remoto, 2009, Natal. Natal: INPE, pp. 6197-6202.
Braz. J. Biol., 2017, vol. 77, no. 2, pp. 323-331 331 Limnology in oligotrophic systems
331 analysis. Hydrobiologia, vol. 114, no. 3, pp. 177-187. http://dx.doi.
org/10.1007/BF00031869.
SAYER, C.D. and ROBERTS, N., 2001. Establishing realistic restoration targets for nutrientenriched shallow lakes: linking diatom ecology and paleoecology at the Attenborough Ponds, U.K. Hydrobiologia, vol. 448, no. 1/3, pp. 117-142. http://dx.doi. org/10.1023/A:1017597221052.
SILVA, C., OLIVEIRA, A.M.S., FIGUEIRA, R.C.L., SEMENSATTO, D. and LABUTO, G., 2011. Estudo do assoreamento do
Reservatório Tanque Grande, Guarulhos (SP). Geociências, vol. 30, no. 2, pp. 253-267.
SILVA, P.D.A., 2012. Biodiversidade e distribuição das diatomáceas planctônicas e de sedimento superficial nas represas de abastecimento do Sistema Alto Cotia (SP). São Paulo: Instituto de Botânica, 98 p. Dissertação de Mestrado em Biodiversidade Vegetal e Meio Ambiente.
SOLORZANO, L., 1969. Determination of ammonia in natural waters by the phenol hypochlorite method. Limnology and Oceanography, vol. 14, pp. 799-801.
STRICKLAND, J.D. and PARSONS, T.R., 1965. A manual of sea water analysis. Bulletin of the Fisheries Board of Canada, vol. 125, pp. 1-185.
THOMAZ, S.M., ROBERTO, M.C. and BINI, L.M., 1997.
Caracterização limnológica dos ambientes aquáticos e influência dos níveis fluviométricos. In: A.E.A. VAZZOLER, A.A. AGOSTINHO
and N.S. HAHN, eds. A planície de inundação do alto rio Paraná: aspectos físicos, biológicos e sócio-econômicos. Maringá: Editora Universidade de Maringá. pp. 73-102.
THORTON, K.W., KIMMEL, B.L. and PAYNE, F.E., 1990. Perspectives on reservoir limnology. In: K.W. THORTON, B.L. KIMMEL and F.E. PAYNE, eds. Reservoir limnology: ecological perspectives. New York: Wiley-Interscience, pp. 1-13. TOMANIK, E.A., PAIOLA, L.M., MARTÍNEZ-FERNÁNDEZ,
J.B. and FERNANDES, S.L., 2009. Environmental changes and
human work in the region of the Upper Paraná River floodplain:
processes and interactions. Brazilian Journal of Biology = Revista Brasileira de Biologia, vol. 69, no. 20, (suppl.), pp. 583-589. http:// dx.doi.org/10.1590/S1519-69842009000300013. PMid:19738965.
TUNDISI, J.G. and MATSUMURA-TUNDISI, T., 2008. Limnologia. São Paulo: Oficina de Textos.
TUNDISI, J.G., 2003. Água no século XXI: enfrentando a escassez. São Carlos: Editora RiMa.
TUNDISI, J.G., MATSUMURA-TUNDISI, T. and GALLI, C.S., 2006. Reservatórios da Região Metropolitana de São Paulo: consequências e impactos da eutrofização e perspectivas
para o gerenciamento e recuperação. In: J.G. TUNDISI, T.
MATSUMURA-TUNDISI and C.S. GALLI, eds. Eutrofização na América do Sul: causas, consequências e tecnologias de gerenciamento e controle. Rio de Janeiro: IIE/IIEGA/ABC/IAP/
Ianas, pp. 161-180.
TUNDISI, J.G., MATSUMURA-TUNDISI, T. and TUNDISI,
J.E., 2008. Reservoirs and human well being new challenges
for evaluating impacts and benefits in the neotropics. Brazilian Journal of Biology = Revista Brasileira de Biologia, vol. 68,
no. 4, (suppl.), pp. 1133-1135. http://dx.doi.org/10.1590/S1519-69842008000500020. PMid:19197483.
VALDERRAMA, J.C., 1981. The simultaneous analysis of total nitrogen and total phosphorus in natural waters. Marine Chemistry, vol. 10, no. 2, pp. 109-122.
http://dx.doi.org/10.1016/0304-4203(81)90027-X.
VILACLARA, G., RICO, R. and MIRANDA, J., 1997. Effects of perturbations on diatom assemblages in Tlaxcala paleolake,
México. Verhandlungen der Internationale Vereinigung der Limnologie, vol. 26, pp. 846-851.
WENGRAT, S. and BICUDO, D.C., 2011. Spatial evaluation of water quality in an urban reservoir (Billings Complex, southeastern
Brazil). Acta Limnologica Brasiliensia, vol. 23, no. 2, pp. 200-216. http://dx.doi.org/10.1590/S2179-975X2011000200010.
WETZEL, R.G., 2001. Limnology: lake and river ecosystems. San Diego: Academic Press.
ZANATA, L.H. and ESPÍNDOLA, E.L., 2002. Longitudinal
processes in Salto Grande reservoir (Americana, SP, Brazil) and