(1) Departamento de Fonoaudiologia e Programa de Pós-Graduação em Distúrbios da Comunicação Humana da Universidade Federal de Santa Maria – PPGDCH/UFSM – Santa Maria (RS), Brasil.
(2) Departamento de Fonoaudiologia da Universidade Federal de Santa Maria –UFSM – Santa Maria (RS), Brasil. (3) Universidade de São Paulo - FOB/USP –
Bauru (SP), Brasil. Source of aid: CAPES, CNPq Conlict of interest: non-existent
Occupational, general health and vocal profile of teachers
of Santa Maria city
Perfil vocal, ocupacional e de saúde geral de docentes de Santa Maria/RS
Carla Aparecida Cielo(1)
Caroline Rodrigues Portalete(2)
Vanessa Veis Ribeiro(3)
Gabriele Rodrigues Bastilha(1)
Received on: June 16, 2015 Accepted on: July 20, 2015 Mailing address: Gabriele Rodrigues Bastilha UFSM – Av. Roraima nº 1000 Cidade Universitária - Bairro Camobi Prédio 26 – 4º andar
Departamento de Fonoaudiologia Santa Maria – RS – Brasil CEP: 97105-900
E-mail: [email protected]
ABSTRACT
Purpose: to characterize and relate the vocal, occupational and general health proile of elementary school teachers from Santa Maria/RS.
Methods: observational analytical cross-sectional study of quantitative character. The sample consisted by 127 teachers (average age of 38.25 years-old) who responded to a questionnaire and underwent hearing screening, perceptual voice assessment and acoustic analysis.
Results: average of 7,03h/day of teaching; work as a teacher for 13,13 years on average; high occur-rence of vocal complaints and there was no reports of respiratory disorders, alcoholism and smoking habits; most showed no disorders in the auditory perceptual parameters; the acoustic analysis presented disorders in measures of disturbance frequency, the amplitude and noise; the teachers who have sub-mitted complaints vocals had daily workload higher than those that did not show; teachers with vocal
complaints presented signiicant changes in measurement of the fundamental frequency variation (jitter); and it was found a statistically signiicant relationship between respiratory disorders and the measurement of the relative average frequency disturbance (jitter).
Conclusion: there is high occurrence of vocal complaints among elementary school teachers, and these
were related with the high workload and acoustic measures of jitter, which also presented relation to the
related respiratory disorders.
Keywords: Epidemiology; Dysphonia; Occupational Health; Voice
RESUMO
Objetivo: caracterizar e relacionar o peril vocal, ocupacional e de saúde geral de professores do ensino fundamental de Santa Maria/RS.
Métodos: estudo transversal observacional analítico de caráter quantitativo. A amostra constituiu-se de 127 professores (média de idade de 38,25 anos), que responderam a um questionário e foram submeti-dos à triagem auditiva, avaliação vocal perceptivoauditiva e avaliação acústica.
Resultados: média de 7,03h/dia de docência; trabalho como docente há 13,13 anos em média; elevada
ocorrência de queixas vocais e ausência de relato de distúrbios respiratórios e hábitos de etilismo e taba -gismo; a maioria não apresentou alterações nos parâmetros perceptivoauditivos, e na análise acústica, apresentou alterações nas medidas de perturbação de frequência e amplitude e de ruído; os professores
que apresentaram queixas vocais tinham carga horária diária superior aos que não apresentaram; os
professores com queixas vocais apresentaram alterações signiicantes na medida variação da frequência
fundamental (jitter); e veriicou-se relação estatisticamente signiicante entre distúrbios respiratórios e a
medida da média relativa da perturbação de frequência (jitter).
Conclusão: há elevada ocorrência de queixas vocais entre professores do ensino fundamental e essas se relacionam com a carga horária elevada e com medidas acústicas de jitter que também apresentam relação com o relato da presença de distúrbios respiratórios.
636 | Cielo CA, Portalete CR, Ribeiro VV, Bastilha GR
INTRODUCTION
One of the biggest interests on voice researches is the teacher’s vocal health, interest that keeps rising since the last decade1-12 as a result of the importance of
the craft the teacher exert before the society8.
Since 1997, the Speech Federal Council
under-stands that most voice disturbs must be classiied
as “occupational diseases”13. An American research
pointed that the vocal symptoms are more frequent on teachers than on the population in general, also showing that, as a result of these vocal changes, the teachers miss work a lot14, 15. In Brazil, the reality is
similar, considering the unfavorable work conditions to the correct usage of the voice and the massive number of teachers in the country, besides the women’s histo-logical and anatomical conditions, most in teaching, that predispose them to dysphonia5-7.
Surveys point that the vocal symptoms most found on teachers are: vocal fatigue, loss of voice, pain on the throat area, hoarseness, hem, persistent cough and sensation of grip and heaviness on the throat3,16,17.
However, besides these symptoms being many times frequent and intense, a study shows that the teachers only search for professional support when there are other health disorders associated9. Those data were
conirmed by a held investigation with kindergarten
and elementary school teachers of Santa Maria/ RS, showing that less than 50% of the teachers that presented aphonia looked for specialized medical help.
Study that sought the reason for the late search for health attendance and for the big occurrence of vocal disturb evidenced that the teachers use to work without proper vocal preparation, many times with no knowledge of vocal health questions and making inappropriate use of the voice18. The incorrect vocal
uses, when constantly and long-term used, can put in risk the teacher’s voice18 and, considering that it is
indispensable for the exertion of their profession, it can bring consequences for their career, causing prejudice for the school and the society12.
On the national literature, many works aim to use strict criteria for the composition of study groups, excluding questions of general health, what makes that, many times, the researches not picture the real condi-tions of teachers that are at work in the country. It’s believed that an analysis together of the characteristics of general, vocal and occupational health be of great worth for the design of actions of teacher’s vocal health promotionseeing that, on this group of voice
profes-the student and on profes-the teach-learning process19, also
exerting a social and economic importance.
Thus, the objective of this study is to characterize
and lost the vocal proile, occupational and of general
health of elementary school teachers from Santa Maria/ RS.
METHODS
The research was characterized by being of the analytical observational cross kind of quantitative character, performed according to recommendations of the 466/12 norm of the National Commissionof Ethics in Research, and approved by the Ethics Committee of the home institution (protocol no. 23081.016945/2010-76). The responsible ones for the educational
institu-tions received the necessary clariicainstitu-tions and were
invited to sign the Institutional Authorization Term (IAT).
The volunteers of the authorized schools were clariied
about the survey and invited to sign the Free and
Clariied Agreement Term (FCAT).
The study had as target population elementary school teachers of the urban area of the city of Santa Maria (RS), of the private, state and municipal networks.
For the sample constitution, were stablished the following criteria of inclusion: teachers of elementary schools (1st to 9thgrade) of state, municipal and private
networks, just from the urban area of the city of Santa Maria (RS); both genders; age above 19 and under 65 years; adhesion to the FCAT.
The stablished excluding criteria were: lunk on
the hearing screening; report of allergic, respiratory or gastric crisis or hormonal dysfunction due to pregnancy or pre-menstrual or menstrual periods on the evaluation days; incomplete data on the screening protocols.
A data collection of the municipal schools, just of the urban network, from all regions of Santa Maria, resulting on 36 private schools and 68 public schools (44 municipal and 24 state). Based on these data, three lists were made for each region, being the order of the schools drawn randomly, of what were excluded one school to each present one, remaining 27 private schools, 31 municipal and 19 state that were invited to participate in the study. 15 schools adhered to the IAT and all teachers were invited to participate the sampling process, wherein 219 teachers adhered the FCAT.
Amplivox, model A260, 2011, by scanning of pure tones on the frequencies of 500Hz to 4kHz in 25dB, only through air means. For the execution of the procedure, a silent room given in by the school with noise-level
under 50dB, veriied by the sound pressure measurer
Instrutherm, model Dec-480. The subjects that didn’t
respond to the pure tone in 25dB were retested and the
cases that lunked the retesting were excluded from the
survey and sent for complete hearing evaluation.
Of the 219 volunteer teachers, 14 were excluded on the hearing screening and 78 by presenting incom-plete data on the questionnaire. This way, the sample is constituted of 127 teachers, being 117 women and ten men, of ages between 20 and 64 years old (average age of 38,25 years), of those 53,54% pertained to the private education network (n=68), 19,92% to the state (n=38) and 16,53% to the municipal (n=21). For the gathering, an auditory perceptual vocal evaluation and an acoustic analysis of the voice were held.
The samples were collected by the sustained utterance of the vowel “a”, spontaneous speech by the question “Tell me about the importance of the voice in your profession”, and the sentences proposed by the CAPE-V protocol20. On the vocal utterance, the
individuals were oriented to perform in a sustained manner in habitual pitch and loudness, after deep breath, in a maximum phonation time, without using the expiratory reservation. Each sample was collected three times, being considered the longest one. On the utterance of the proposed sentences by the CAPE-V protocol and of the spontaneous speech, the subjects were oriented to utter, in speed of speech, habitual
pitch and loudness. The record time of each speech
situation was not controlled, letting each individual free to perform them according to their capacity. The utterances were collected by a digital professional recorder of the brand Zoom, model H4n, with quanti-zation rate of 96 kHz and 16bits, with recording in 50% of the entry level. The recorder was attached to a pedestal 90°-angled of the subject’s mouth, with linked BehringerECM 8000 professional omnidirec-tional microphone, with capitation range of frequencies between 15 and 20kHz. The individuals kept distance of four centimeters between the microphone and the mouth for the vowels’ utterance and ten centimeters for the sentences’ and spontaneous speech utterance.
The protocol CAPE-V was used for the auditory perceptual analysis. Were used the sustained utterance of the vowel “a” without edition, the spontaneous speech and the sentences proposed by the protocol.
The voices were recorded in Digital Versatile Disc(DVD) 52x, 7GB, with PCM audio format; 96kHz; 16bits; mono, converted into the extension wave form. After that, were disposed on the DVD folders with the three samples,
without the participant’s identiication, randomly, with
repetition of approximately 20% (for the evaluators’
reliability analysis) and were sent to ive speech thera -pists with at least a 5-year experience on the area and not authors of the study. The judges were blinded about the survey’s objectives, the sex, the replication of the utterances and the evaluations left by the other speech therapists, being told just about the subjects’ general age group and oriented to hear the voices as much times as necessary in a silent environment and
with computer conigurations of: 16bits, 96kHz. They were also oriented to make the analysis according to the parameters of the CAPE-V protocol (dysphonia, breathiness, roughness and tension general degrees). CAPE-V is a visual analog protocol, composed by a linear analog scale that goes from zero to 100mm, being able to be analyzed quantitatively20. The pitch
and loudness parameters that depend, respectively,
on the comparison with pairs of same sex and age and on the communicational context to be judged, also integrate the CAPE-V protocol, nonetheless, as the judges were blinded about the sex and didn’t make the present evaluation with the participants, these both aspects were not considered on this research.
After the voices evaluation by the judges, a statistic analysis was held, in order to verify the intra and inter evaluatorreliability by means of the Kappa coeficient,
being selected the evaluations from the three speech therapists with higher inter evaluator reliability, and based on these three analysis, an average was made for each parameter of the CAPE-V scale. For the
deviation degree classiication, the Brazilian pattern was
used, whereby the scores between zero and 35,5% are considered normal; between 35,6% and 50,5% a light deviation; from 50,6% to 90,5% moderate deviation and above 90,6% the deviation is considered intense21.
For the acoustic analysis from glottal source was used the Multi Dimensional Voice Program Advanced
da Kay Pentax®software, with sampling rate of 44kHz
and 16bits, analyzing the sustained utterances of the vowel “a”, with the vocal attack and the end of the
utterance eliminated in order to prevent the inluence of
The data were statistically analyzed through ANOVA and Chi-Square test of Pearson non-parametric tests,
adopting the signiicance level of 5%.
RESULTS
In the present study, the group of researched teachers functioned an average of 7,03h/day and worked as a teacher about 13,13 years; 53,54% of the teachers pertained to the private education network (n=68), 19,92% to the state (n=38) and 16,53% to the municipal (n=21).
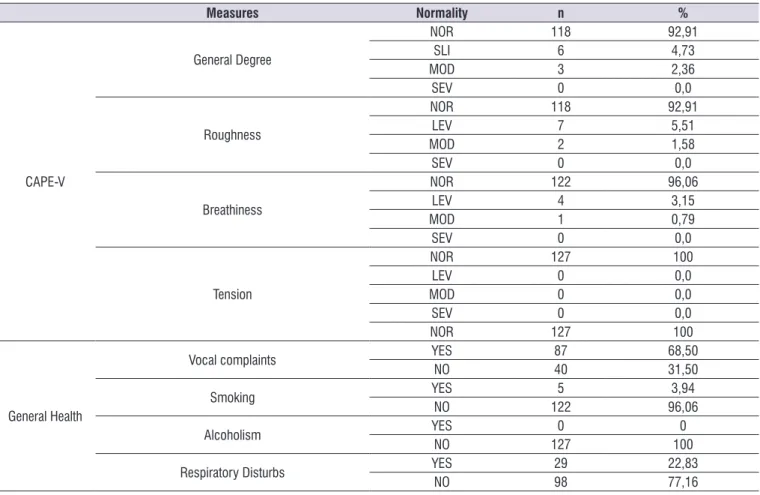
In the table 1, the descriptive results about the aspects of vocal complaint, general health, acoustic analysis of glottal and auditory perceptual sources of the voice are observed.
It’s seen, in the table 2, the relation of vocal complaint with the results of the acoustic and auditory perceptual analysis of the voice.
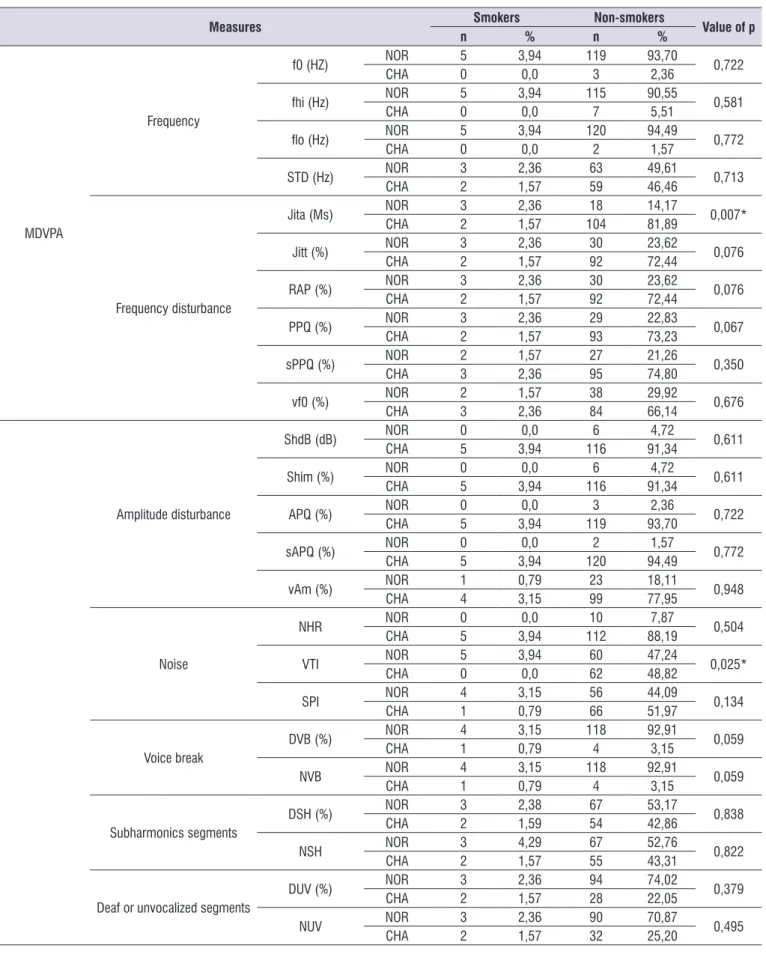
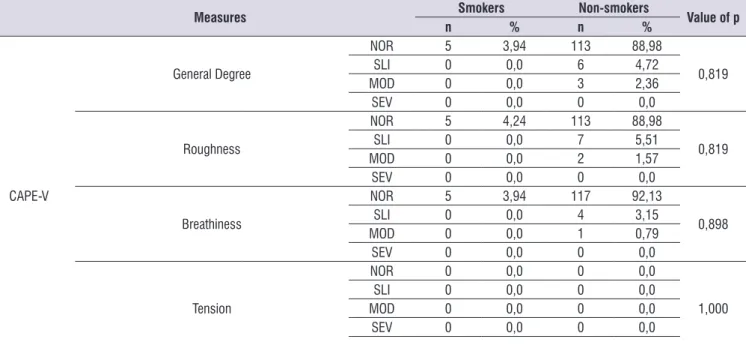
The relation of smoking report with the results of the acoustic and auditory perceptual analysis of the voice can be seen in the table 3.
In the table 4, it’s veriied the relation of the respi -ratory disorder report with the results of the acoustic and auditory perceptual analysis of the voice.
The table 5 shows the analysis of the variables vocal complaint, smoking report and respiratory disorder report according to the period of use of the professional voice, daily function and age.
way: (1) frequency measures: f0; f0 maximum (fhi);
f0 minimum (lo); standard-deviation of f0 (STD); (2)
frequency disturbance measures or jitter: disturbance relative average (RAP); jitter percentage (Jitt); absolute
jitter (Jita); disturbance quotient of the softened pitch
(sPPQ); pitch disturbance quotient(PPQ); variation
coeficient of the f0 (vf0); (3) amplitude disturbance
measures or shimmer: shimmer in dB (ShdB); shimmer
percentage (Shim); amplitude variation coeficient
(vAm); amplitude disturbance quotient(APQ); softened amplitude disturbance quotient (sAPQ); (4) noise measures: noise harmonicproportion(NHR); soft phonationindex (SPI); voice turbulence index (VTI); (5) voice breaks measures: numberof voice breaks (NVB); degreeof voice breaks (DVB); (6) deaf of unvocalized segments measures: degree of unvocalized segments(DUV); number of unvocalized segments (NUV); (7) sub-harmonic segments measures: numberof sub-harmonic segments (NSH); degreeof sub-harmonic components (DSH). It’s believed that the measures’ group analysis provides higher reliability for the data analysis, since that still there isn’t in the literature an exact correspondence between each of the acoustic measures and the adjacent phenomenon. Were considered the normality parameters by sex proposed by the program.
The analyzed data referring to general health, vocal and occupational complaints were removed from the
Table 1. Descriptive results about the aspects of vocal complaint, general health, acoustic analysis of glottal and auditory perceptual sources of the voice
Measures Normality n %
MDVPA
Frequency
f0 (HZ) NOR 124 97,63
CHA 3 2,36
fhi (Hz) NOR 120 94,48
CHA 7 5,51
lo (Hz) NORCHA 1252 98,421,57
STD (Hz) NOR 66 51,92
CHA 61 48,03
Frequency disturbance
Jita (Ms) NOR 21 16,53
CHA 106 83,46
Jitt (%) NOR 33 25,98
CHA 94 74,01
RAP (%) NOR 33 25,98
CHA 94 74,01
PPQ (%) NOR 32 25,19
CHA 95 74,80
sPPQ (%) NOR 29 22,83
CHA 98 77,16
vf0 (%) NOR 40 31,49
CHA 87 68,50
Amplitude disturbance
ShdB (dB) NOR 6 4,72
CHA 121 95,28
Shim (%) NOR 6 4,72
CHA 121 95,28
APQ (%) NOR 3 2,36
CHA 124 97,64
sAPQ (%) NOR 2 98,42
CHA 125 1,58
vAm (%) NOR 24 18,90
CHA 103 81,10
Noise
NHR NOR 10 7,87
CHA 117 92,13
VTI NOR 65 51,18
CHA 62 48,82
SPI NOR 60 47,24
CHA 67 52,76
Voice break
DVB (%) NOR 122 96,06
CHA 5 3,94
NVB NOR 122 96,06
CHA 5 3,93
Subharmonics egments
DSH (%) NOR 70 55,11
CHA 56 44,09
NSH NOR 70 55,11
CHA 57 44,88
Deaf or unvocalized segments
DUV (%) NOR 97 76,38
CHA 30 23,62
NUV NOR 93 73,23
Measures Normality n %
CAPE-V
General Degree
NOR 118 92,91
SLI 6 4,73
MOD 3 2,36
SEV 0 0,0
Roughness
NOR 118 92,91
LEV 7 5,51
MOD 2 1,58
SEV 0 0,0
Breathiness
NOR 122 96,06
LEV 4 3,15
MOD 1 0,79
SEV 0 0,0
Tension
NOR 127 100
LEV 0 0,0
MOD 0 0,0
SEV 0 0,0
NOR 127 100
General Health
Vocal complaints YES 87 68,50
NO 40 31,50
Smoking YES 5 3,94
NO 122 96,06
Alcoholism YES 0 0
NO 127 100
Respiratory Disturbs YES 29 22,83
NO 98 77,16
Descriptive analysis of occurence frequency.
Legend: n=number of subjects; %=percentage of subjects; NOR=normal; CHA=changed; SLI=slight; MOD=moderate; SEV=severe.
Table 2. Relation of vocal complaint with the results of the acoustic and auditory perceptual analysis of the voice
Measures Normality Presence of complaints Absence of complaints Value of p
n % n %
MDVPA
Frequency
f0 (HZ) NOR 85 66,93 39 30,71 0,944
CHA 2 1,57 1 0,79
fhi (Hz) NOR 82 64,57 38 29,92 0,863
CHA 5 3,94 2 1,57
lo (Hz) NOR 86 67,72 39 30,71 0,570
CHA 1 0,79 1 0,79
STD (Hz) NOR 40 31,50 26 20,47 0,046*
CHA 47 37,01 14 11,02
Frequency disturbance
Jita (Ms) NOR 11 8,66 10 7,87 0,081
CHA 76 59,84 30 23,62
Jitt (%) NOR 18 14,17 15 11,81 0,044*
CHA 69 54,33 25 19,69
RAP (%) NOR 18 14,17 15 11,81 0,044*
CHA 69 54,33 25 19,69
PPQ (%) NOR 18 14,17 14 11,02 0,084
CHA 69 54,33 26 20,47
sPPQ (%) NOR 15 11,81 14 11,02 0,026*
CHA 72 56,69 26 20,47
vf0 (%) NOR 19 14,96 21 16,54 >0,001*
Measures Normality Presence of complaints Absence of complaints Value of p
n % n %
Amplitude disturbance
ShdB (dB) NOR 4 3,15 2 1,57 0,920
CHA 83 65,35 38 29,92
Shim (%) NOR 4 3,15 2 1,57 0,920
CHA 83 65,35 38 29,92
APQ (%) NOR 3 2,36 0 0,0 0,234
CHA 84 66,14 40 31,50
sAPQ (%) NOR 1 0,79 1 0,79 0,570
CHA 86 67,72 39 30,71
vAm (%) NOR 16 12,60 8 6,30 0,829
CHA 71 55,91 32 25,20
Noise
NHR NOR 7 5,51 3 2,36 0,915
CHA 80 62,99 37 29,13
VTI NOR 45 35,43 20 15,75 0,853
CHA 42 33,07 20 15,75
SPI NOR 37 29,13 23 18,11 0,116
CHA 50 39,37 17 13,39
Voice break
DVB (%) NOR 85 66,93 37 29,13 0,161
CHA 2 1,57 3 2,36
NVB NOR 85 66,93 37 29,13 0,161
CHA 2 1,57 3 2,36
Subharmonicssegments
DSH (%) NOR 48 38,10 22 17,46 0,897
CHA 39 30,95 17 13,49
NSH NOR 48 37,80 22 17,32 0,985
CHA 39 30,71 18 14,17
Deaf or unvocalized segments
DUV (%) NOR 65 51,18 32 25,20 0,514
CHA 22 17,32 8 6,30
NUV NOR 61 48,03 32 25,20 0,242
CHA 26 20,47 8 6,30
CAPE-V
General Degree
NOR 79 62,20 39 30,71
0,235
SLI 6 4,72 0 0,0
MOD 2 1,57 1 0,79
SEV 0 0,0 0 0,0
Roughness
NOR 79 62,20 39 30,71
0,365
SLI 6 4,72 1 0,79
MOD 2 1,57 0 0,0
SEV 0 0,0 0 0,0
Breathiness
NOR 83 65,35 39 30,71
0,133
SLI 4 3,15 0 0,0
MOD 0 0,0 1 0,79
SEV 0 0,0 0 0,0
Tension
NOR 0 0,0 0 0,0
1,000
SLI 0 0,0 0 0,0
MOD 0 0,0 0 0,0
SEV 0 0,0 0 0,0
SLI 0 0,0 0 0,0
MOD 0 0,0 0 0,0
SEV 0 0,0 0 0,0
*p<0,005 – Chi-Square test of Pearson
Table 3. Relation of smoking report with the results of the acoustic and auditory perceptual analysis of the voice
Measures Smokers Non-smokers Value of p
n % n %
MDVPA
Frequency
f0 (HZ) NOR 5 3,94 119 93,70 0,722
CHA 0 0,0 3 2,36
fhi (Hz) NOR 5 3,94 115 90,55 0,581
CHA 0 0,0 7 5,51
lo (Hz) NOR 5 3,94 120 94,49 0,772
CHA 0 0,0 2 1,57
STD (Hz) NOR 3 2,36 63 49,61 0,713
CHA 2 1,57 59 46,46
Frequency disturbance
Jita (Ms) NOR 3 2,36 18 14,17 0,007*
CHA 2 1,57 104 81,89
Jitt (%) NOR 3 2,36 30 23,62 0,076
CHA 2 1,57 92 72,44
RAP (%) NOR 3 2,36 30 23,62 0,076
CHA 2 1,57 92 72,44
PPQ (%) NOR 3 2,36 29 22,83 0,067
CHA 2 1,57 93 73,23
sPPQ (%) NOR 2 1,57 27 21,26 0,350
CHA 3 2,36 95 74,80
vf0 (%) NOR 2 1,57 38 29,92 0,676
CHA 3 2,36 84 66,14
Amplitude disturbance
ShdB (dB) NOR 0 0,0 6 4,72 0,611
CHA 5 3,94 116 91,34
Shim (%) NOR 0 0,0 6 4,72 0,611
CHA 5 3,94 116 91,34
APQ (%) NOR 0 0,0 3 2,36 0,722
CHA 5 3,94 119 93,70
sAPQ (%) NOR 0 0,0 2 1,57 0,772
CHA 5 3,94 120 94,49
vAm (%) NOR 1 0,79 23 18,11 0,948
CHA 4 3,15 99 77,95
Noise
NHR NOR 0 0,0 10 7,87 0,504
CHA 5 3,94 112 88,19
VTI NOR 5 3,94 60 47,24 0,025*
CHA 0 0,0 62 48,82
SPI NOR 4 3,15 56 44,09 0,134
CHA 1 0,79 66 51,97
Voice break
DVB (%) NOR 4 3,15 118 92,91 0,059
CHA 1 0,79 4 3,15
NVB NOR 4 3,15 118 92,91 0,059
CHA 1 0,79 4 3,15
Subharmonics segments
DSH (%) NOR 3 2,38 67 53,17 0,838
CHA 2 1,59 54 42,86
NSH NOR 3 4,29 67 52,76 0,822
CHA 2 1,57 55 43,31
Deaf or unvocalized segments
DUV (%) NOR 3 2,36 94 74,02 0,379
CHA 2 1,57 28 22,05
NUV NOR 3 2,36 90 70,87 0,495
Measures Smokers Non-smokers Value of p
n % n %
CAPE-V
General Degree
NOR 5 3,94 113 88,98
0,819
SLI 0 0,0 6 4,72
MOD 0 0,0 3 2,36
SEV 0 0,0 0 0,0
Roughness
NOR 5 4,24 113 88,98
0,819
SLI 0 0,0 7 5,51
MOD 0 0,0 2 1,57
SEV 0 0,0 0 0,0
Breathiness
NOR 5 3,94 117 92,13
0,898
SLI 0 0,0 4 3,15
MOD 0 0,0 1 0,79
SEV 0 0,0 0 0,0
Tension
NOR 0 0,0 0 0,0
1,000
SLI 0 0,0 0 0,0
MOD 0 0,0 0 0,0
SEV 0 0,0 0 0,0
*p<0,005 – Chi-Square test of Pearson
Legend: n=number of subjects; %=percentage of subjects; NOR=normal; CHA=changed; SLI=slight; MOD=moderate; SEV=severe.
Table 4. Relation of the respiratory disorder report with the results of the acoustic and auditory perceptual analysis of the voice
Measures
Present Respiratory Disturbs
Absent
Respiratory Disturbs Value of p
n % n %
MDVPA
Frequency
f0 (HZ) NOR 28 22,05 96 75,59 0,661
CHA 1 0,79 2 1,57
fhi (Hz) NOR 28 22,05 92 72,44 0,579
CHA 1 0,79 6 4,72
lo (Hz) NOR 28 22,05 97 76,38 0,356
CHA 1 0,79 1 0,79
STD (Hz) NOR 12 9,45 54 42,52 0,193
CHA 17 13,39 44 34,65
Frequency disturbance
Jita (Ms) NOR 3 2,36 18 14,17 0,306
CHA 26 20,47 80 62,99
Jitt (%) NOR 4 3,15 29 22,83 0,088
CHA 25 19,69 69 54,33
RAP (%) NOR 3 2,36 30 23,62 0,028*
CHA 26 20,47 68 53,54
PPQ (%) NOR 4 3,15 28 22,05 0,107
CHA 25 19,69 70 55,12
sPPQ (%) NOR 4 3,15 25 19,69 0,186
CHA 25 19,69 73 57,48
vf0 (%) NOR 7 5,51 33 25,98 0,331
Measures
Present Respiratory Disturbs
Absent
Respiratory Disturbs Value of p
n % n %
Amplitude disturbance
ShdB (dB) NOR 2 1,57 4 3,15 0,530
CHA 27 21,26 94 74,02
Shim (%) NOR 2 1,57 4 3,15 0,530
CHA 27 21,26 94 74,02
APQ (%) NOR 1 0,79 2 1,57 0,661
CHA 28 22,05 96 75,59
sAPQ (%) NOR 1 0,79 1 0,79 0,356
CHA 28 22,05 97 76,38
vAm (%) NOR 8 6,30 16 12,60 0,173
CHA 21 16,54 82 64,57
Noise
NHR NOR 2 1,57 8 6,30 0,823
CHA 27 21,26 90 70,87
VTI NOR 15 11,81 50 39,37 0,946
CHA 14 11,02 48 37,80
SPI NOR 12 9,45 48 37,80 0,471
CHA 17 13,39 50 39,37
Voice break
DVB (%) NOR 29 22,83 93 73,23 0,214
CHA 0 0,0 5 3,94
NVB NOR 29 22,83 93 73,23 0,214
CHA 0 0,0 5 3,94
Subharmonic segments
DSH (%) NOR 17 13,49 53 42,09 0,533
CHA 11 8,73 45 35,71
NSH NOR 17 13,39 53 41,73 0,665
CHA 12 9,45 45 35,43
Deaf or unvocalized
segments
DUV (%) NOR 22 17,32 75 59,06 0,940
CHA 7 5,51 23 18,11
NUV NOR 21 16,54 72 56,69 0,910
CHA 8 6,30 26 20,47
CAPE-V
General Degree
NOR 25 19,69 93 73,23
0,147
SLI 2 1,57 4 3,15
MOD 2 1,57 1 0,79
SEV 0 0,0 0 0,0
Roughness
NOR 25 19,69 93 73,23
0,270
SLI 3 2,36 4 3,15
MOD 1 0,79 1 0,79
SEV 0 0,0 0 0,0
Breathiness
NOR 26 20,47 96 75,59
0,073
SLI 2 1,57 2 1,57
MOD 1 0,79 0 0,0
SEV 0 0,0 0 0,0
Tension
NOR 0 0,0 0 0,0
1,000
SLI 0 0,0 0 0,0
MOD 0 0,0 0 0,0
SEV 0 0,0 0 0,0
*p<0,005 – Chi-Square test of Pearson
Table 5. Analysis of the variables vocal complaint, smoking report and respiratory disorder report according to the period of use of the professional voice, daily function and age
Period of professional voice use (years) Average SD value of p
Vocal complaint Yes 13,34 0,99 0,697
No 12,65 1,47
Smoking Yes 11,20 4,16 0,638
No 13,20 0,84
Respiratory disturb Yes 13,13 1,73 0,993
No 13,12 0,94
Daily Funtion (hours)
Vocal complaint Yes 7,44 0,32 0,002*
No 6,15 0,47
Smoking Yes 7,02 0,27 0,788
No 7,40 1,36
Respiratory disturb Yes 6,93 0,30 0,496
No 7,37 0,56
Age
Vocal complaint Yes 39,10 1,09 0,169
No 36,40 1,61
Smoking Yes 38,29 0,93 0,816
No 37,20 4,61
Respiratory disturb Yes 38,47 1,04 0,648
No 37,48 1,91
*p<0,05 – ANOVA test. Legend: SD = Standard-Deviation
DISCUSSION
The group of teachers of the present study were mostly womankind, functioning an average of 7,03h/ day and has worked as a teacher for about 13,13 years. Study held with 476 teachers of elementary and high school showed similar data, wherein the teachers worked 7,64 hours daily and have acted for 11,5 years4.
In another research which participated 37 teachers of primary and elementary school, it was found that 62,6% have worked on this profession for over ten years and presented daily time of permanence with students of 7,56 hours11.
For this group of professionals, a harmonious voice is needed, with vocal quality, adequatepitch
and loudnessfor the function, for the public and for the place, therefore, in a group of teachers, all and any
dificulty or change on the vocal utterance that interfere
in the natural production of the voice can also interfere on the professional performance, what makes the dysphonia a occupational disturb22. The dysphonia can
affect the life quality both on personal aspects and on professional and social aspects23.
The class of teachers, that make use of the voice as a work tool, is one of the most affected by dysphonias,
existing recent studies that show the presence of vocal changes up to 78,7% of the teachers10-12.
It was observed in this research, that the teachers that presented vocal complaints had superior workload than the ones who didn’t (Table 5). Each teacher owns a particular vocal demand, some believe that the voice becomes overloaded not by the explained contents in class, but by the need of controlling the scholar environment. Therefore, the period of voice use in class can be considered predisposing factor to the dysphonia, especially when added to external and internal environmental noise and numerous classes of students10,16.
Research held with teachers of the city of Porto
Alegre/RS veriied that 48,6% of the teachers identiied
the noise as a possible trigger factor of vocal disturbs, which comes from the classroom. For 32,4% of the interviewed, this makes the teachers to exert vocal effort to be audible for the students, wherein that effort and vocal fatigue possibly have their increase propor-tional to the increase of hours front of the student11.
teachers with vocal complaints presented signiicant
changes on the frequency disturb measures (Table 2). Such acoustic measures show how much the period of glottal vibration differs from what succeeds it, being able to acoustically reveal the instability of the analyzed signal, so, decrease of the phonation system’s control with presence of aperiodicity24,25.
Furthermore, the major part of the teachers presented, in the acoustic analysis, changes on the noise and frequency and amplitude disturbance
measures (Table 1). These modiications that arise at
different moments show that the vocal production is not totally periodic and is independent just by the individ-ual’s attention to perform the utterance. Sometimes, the aperiodicity and instability accrue from alterations on the vibration of the vocal chords, where different forces
and conigurations of the laryngeal musculature or of
the vocal chords’ mucus are created, causing vibratory asymmetry, just like can accrue from glottal adduction
insuficiency and, even, of alterations in the sound’s
articulation, caused by the variations on the
source-ilter relation26. According to the literature24-26, as certain
levels of aperiodicity and instability are considered normal, high levels of alteration in the acoustic measures can suggest presence of laryngeal injuries.
The majority of the teachers didn’t present altera-tions on the auditory perceptual parameters of the voice, according to some studies10,12. Research held
veriied that only one third of the analyzed teachers
presented vocal disturb found by the auditory perceptual evaluation of the voice, and the majority of a low degree10. Such result resembles to the one of the
present study, although with higher number of subjects with auditory perceptual alterations, what suggests that the acoustic analysis showed itself more sensitive and, in this case, can be signaling a vocal disturb that, although presented complaints, didn’t expressed itself in the vocal quality yet.
As to the general health, the major part of the teachers didn’t present respiratory disturbance reports and didn’t have alcoholism or smoking habits, but presented vocal complaints (Table 1), which meets a work that found a high number of teachers with vocal complaints, although not smokers or alcoholic17.
In the present study, the alterations of jitta and VTI measures have been related to the smoking report (Table 3). The jitter measure rise can signal dificulties
of control in phonation or respiratory level since they provide evidences of the irregularity of the vibration of
distribution variation, as well as the relation between the biomechanics characteristics and the neuromuscular control, making the jitter be an evidence of an oscil-latory instability of the vocal chords and characterizing itself by a hoarse vocal quality24. On the other hand,
the VTI corresponds to the voice turbulence index and presents greater relation to the air turbulence
compo-nents that correspond to modiications in the glottal
adduction24.
Despite studies allege that this relation is not direct27,28, once the other factors can inluence the
occurrence of dysphonia by smoking, like the kind and amount of cigarettes smoked daily and the period the habit have been installed29, it’s known that the
smoking can generate edema on vocal chords region
that dificult the mucus’ mobilization, what justiies the
phonation instability and the noise found in the acoustic analysis.
Furthermore, the teachers analyzed in this study
showed a statistically signiicant relation between respi -ratory disturb reports and RAP measure (Table 4). It
can be justiied the relation of respiratory disturb and
jitter measures once it’s necessary that the pulmonary
aerodynamic forces be balanced to the myoelastic forces of the larynx so that the utterance be stable12,30.
Therefore, it’s indispensable to highlight the impor-tance of improvements in the work conditions an of the investment on the worker’s general health, mainly regarding to prevention. At this rate, it’s noticed the oversight with the vocal health in the teachers’ life, which the voice is the basis of their occupation.
CONCLUSION
There is high occurrence of vocal complaints between teachers of the elementary school and these are related to the larger daily workload and to acoustic measures of jitter. The jitter measures also present relation to the report of presence of respiratory disturbs. It’s concluded that on the studied elementary school teachers of Santa Maria/RS, there was relation between
the vocal, occupational and general health proile, thus
13. Ferreira L, Zenari M, Latorre M, Giannini S. Distúrbio de voz relacionado ao trabalho: proposta de um instrumento para avaliação de professores. Disturb Comun. 2007;19(1):127-36.
14. Roy N, Merrill RM, Thibeaults S, Gray SD, Smith EM. Voice disorders in teachers and the general population: effects on work performance, attendance, and future career choices. J Speech Lang Hear Res. 2004;47(3): 542-52.
15. Roy N, Merrill RM, Thibeaults S, Parsa R, Gray SD, Smith EM. Prevalence of voice disorders in teachers en the general population. J Speech Lang Hear Res. 2004;47(2):281-93.
16. Tomazzetti, CT. A voz do professor: instrumento de trabalho ou problema no trabalho? [dissertação]. Santa Maria (RS): Universidade Federal de Santa Maria. Programa de Pós-Graduação em Educação; 2003.
17. Choi-Cardim K, Behlau M, Zambon F. Sintomas
vocais e peril de professores em um programa de
saúde vocal. Rev CEFAC. 2010;12(5):811-9.
18. Guerrieri AP, Zambom F, Behlau M, Roy NGVP. Panorama epidemiológico sobre a voz do professor no Brasil. In: Congresso Brasileiro de Fonoaudiologia; Anais do 18º Congresso Brasileiro de Fonoaudiologia; 2009 Oct 21-24.Salvador: Sociedade Brasileira de Fonoaudiologia; 2009. p.1-6.
19. Miranda DR, Azevedo MS, Freire NRH, Oliveira MP. O professor como comunicador e mediador do processo ensino e aprendizagem: implicações ambientais e organizacionais em seu desempenho. Anuário. 2012;1(1):564-77.
20. ASHA - American Speech-Language-Hearing Association. Consensus auditory-perceptual evaluation of voice (CAPE-V), United States of America, 2002. Disponível em: <http://www.asha. org>. Acesso em: maio de 2014.
21. Yamasaki R, Leão SHS, Madazio G, Padovani M, Azevedo R. Correspondência entre escala analógico-visual e a escala numérica na avaliação perceptivo-auditiva de vozes. In: Congresso Brasileiro de Fonoaudiologia; Anais do 16º Congresso Brasileiro de Fonoaudiologia; 2007 Sep 24-27; Auditório Claudio Santoro. Campos do Jordão: Sociedade Brasileira de Fonoaudiologia; 2008. p.1-5.
22. Alves LA, Robazzi MLCC, Marziale MHP, Felippe ACN, Romano CC. Alterações da saúde e a voz do
REFERENCES
1. Servilha EAM, Costa ATF. Conhecimento vocal e a importância da voz como recurso pedagógico na perspectiva de professores universitários. Rev CEFAC. 2015;17(1):13-26.
2. Anhaia TC, Klahr OS, Cassol M. Associação entre o tempo de magistério e a autoavaliação vocal em professores universitários: estudo observacional transversal. Rev CEFAC. 2015;17(1):52-7.
3. Behlau M, Zambon F, Guerrieri AC, Roy N. Epidemiology of voice disorders in teachers and non teachers in Brazil: prevalence and adverse effects. J Voice. 2012;26(5):665-9.
4. Ceballos AGC, Carvalho FM, Araújo TM, Reis EJFB. Avaliação perceptivo-auditiva e fatores associados à alteração vocal em professores. Rev Bras Epidemiol. 2011;14(2):285-95.
5. Ziegler A, Gillespie AI, Abbott KV. Behavioral treatment of voice disorders in teachers. Folia Phoniatr Logop. 2010;62(1):09-23.
6. Musial PL, Dassie-Leite AP, Zaboroski AP, Casagrande RC. Interferência dos sintomas vocais
na atuação proissional de professores. Distúrb
Comun. 2011;23(3):335-41.
7. Giannini SPP, Latorre RMDO, Ferreira LP. Distúrbio de voz e estresse no trabalho docente: um estudo caso-controle. Cad Saúde Pública. 2012;28(11):2115-24.
8. Luchesi KF, Mourão LF, Kitamura S. Ações de promoção e prevenção à saúde vocal de professores: uma questão de saúde coletiva. Rev CEFAC. 2010;12(6):945-53.
9. Medeiros AM, Assunção AA, Barreto SM. Alterações vocais e cuidados de saúde em professores. Rev CEFAC. 2012;14(4):697-704.
10. Servilha EAM, Correia JM. Correlações entre condições do ambiente, organização do trabalho, sintomas vocais autorreferidos por professores universitários e avaliação fonoaudiológica. Disturb Comun. 2014;26(3):452-62.
11. Cezar Vaz MR, Severo LO, Borges AM, Bonow AC, Rocha PL, Almeida MCV. Voice disorders in teachers. Implications for occupational health nursing care. Investigación y Educación en Enfermería. 2013;31(2):252-60.
professor, uma questão de saúde do trabalhador. Rev Latino-Am Enfermagem. 2009;17(4):66-72. 23. Ricarte A, Oliveira G, Behlau M. Validação brasileira
do VAPP. CoDAS 2013;25(3):242-9.
24. Barros APB, Carrara-de Angelis E. Análise acústica da voz. In: Dedivitis RA, Barros APB (Org.). Métodos de avaliação e diagnóstico da laringe e voz. São Paulo: Lovise, 2002. p. 185-221.
25. Beber BC, Cielo CA. Medidas acústicas de fonte glótica de vozes masculinas normais. Pró-Fono R Atual Cient. 2010;22(3):299-304.
26. Gama ACC, Behlau MS. Estudo da constância de medidas acústicas. Rev Soc Bras Fonoaudiol. 2009;14(1):8-14.
27. Fuess VLR, Lorenz MC. Problemas vocais no jardim de infância e professores do ensino primário: prevalência e fatores de risco. Rev Bras Otorrinolaringol. 2003;69(6):807-12.
28. Cielo CA, Finger LS, Roman-Niehues G, Deuschle VP, Siqueira MA. Hábitos de tabagismo e etilismo em disfonias. R Ci Med Biol. 2010;9(2):119-25. 29. Ribeiro V, Ribeiro VV, Dassie-Leite AP. Queixa vocal
e qualidade de vida em voz de mulheres tabagistas. R Bras Qual Vida. 2014;6(3):192-8.
30. Behlau M. Voz: o livro do especialista. 1st ed. São