Distortion-product otoacoustic emission growth curves in
neonates
TANIA ALVES BARBOSA1, ALESSANDRA SPADA DURANTE2, LIDIO GRANATO3
1Speech Therapist, Master in Health Sciences, Faculty of Medical Sciences of Santa Casa de São Paulo, São Paulo, SP, Brazil 2Professor Assistant, Faculty of Medical Sciences of Santa Casa de São Paulo, São Paulo, SP, Brazil
3Professor, Department of Otorhinolaryngology, Faculty of Medical Sciences of Santa Casa de São Paulo, São Paulo, SP, Brazil
S
UMMARYStudy conducted at Hospital Nossa Senhora da Conceição and at the Faculty of Medical Sciences, Santa Casa de São Paulo, São Paulo, SP
Article received: 3/1/2013
Accepted for publication: 2/20/2014
*Correspondence:
Address: Rua Dr Cesário Motta Jr nº 61, 8º andar São Paulo – SP Postal Code: 01221-020
http://dx.doi.org/10.1590/1806-9282.60.06.020
Conflict of interest: none
Background: The recording of otoacoustic emissions (OAE) enabled us to pro-ve that the cochlea is able not only to receipro-ve sounds but also to produce acous-tic energy. Through the use of distortion-product otoacousacous-tic emission measu-rements, the growth of the response was seen according to the intensity of the sound stimulus presented (growth curve).
Objective: to determine the thresholds for the emergence of distortion-product otoacoustic emissions (DPOAE) on frequencies of 2000 and 4000 Hz with a sti-mulus varying from 20 to 65dB SPL, and to establish the slope values obtained in the growth curves.
Methods: 39 neonates aged 5 to 28 days without risk indicators of hearing loss were studied. The DPOAE growth curves were obtained on the frequencies from 2000 Hz and 4000 Hz with a level of intensity ranging from 20 to 65dB SPL di-vided into two paradigms (20 to 40dB SPL and 40-65dB SPL).
Results: there was a statistically signiicant difference in the thresholds for the emergence of DPOAE depending on the criteria used. The thresholds were on average higher at 4000 Hz than 2000 Hz and the slope was higher on average at 2000 Hz than 4000 Hz, although not statistically signiicant in either case.
Conclusion: the thresholds were on average 30dB SPL at 2000Hz and 35dB SPL at 4000Hz. The slope values varied between 3 and 4 on average, reaching 15 in some cases.
Keywords: spontaneous otoacoustic emissions, hearing tests, hearing, newborn.
I
NTRODUCTIONThe recording of otoacoustic emissions (OAE) is a me-thod used for the detection of hearing changes of coch-lear origin.1 Among other functions, the cochlea
ampli-ies sounds, which is performed nonlinearly in healthy cochlea, that is, there is a compression mechanism wi-thin the cochlea that enables the ampliication to occur at different proportions depending on the intensity of the stimulus (weak, medium and strong). For weak sounds the ampliication is linear, and for medium intensity sounds the ampliication is lower, which is called coch-lear compression, Ruggero.2
Direct measurements of cochlear nonlinearity are not possible. As a result, access to the nonlinearity of the hu-man cochlea has to be undertaken with noninvasive and indirect measures, according to Gorga et al..3
With the measurement of distortion-product otoa-coustic emissions (DPOAE) it is possible to verify the growth in the response according to the level of intensity of the sound stimulus presented (growth curve), as per Abdala.4
understanding of cochlear physiology, especially com-pression mechanisms and cochlear nonlinearity, as well as the function of outer hair cells. The realization of the DPOAE growth curve, also known as the input/output (IO) growth function makes it possible to obtain the DPOAE threshold.5The occurrence of DPOAE
compres-sion in newborns can be interpreted as an indication of reduction in gain from cochlear ampliication with an in-crease in the stimulus level. The presence of compression in this phase, in addition to suggesting cochlear integrity, is a strong indicator that already at birth the peripheral function enables greater ampliication of sounds with a low intensity level, favoring auditory tasks that require temporal resolution ability. Nonlinearity is important for recognizing speech in a noisy environment.6 The sounds
are dynamic, with constant changes in the spectrum, am-plitude, spatial location and duration parameters. The process of perceiving quick changes in the pattern of the stimulus, integrating information occurring over time, is denominated temporal processing. Knowledge of the oc-currence of this pattern at birth conirms the hypothesis of maturity in the peripheral auditory system in the neo-natal phase, predisposing the development of temporal resolution ability in this phase.7
Thus, importance of research on the possible clinical applications of this test emerges. Cochlear physiology re-presents an important subject for study and has become a major motivation in this work: to obtain a more speci-ic understanding of the cochlea and its operation, the-reby collaborating when there are losses to these cochlear functions, mainly aimed at the neonatal population, whe-re intervention and early stimulation measuwhe-res can be de-veloped, as well as complementing newborn hearing scree-ning (NHS). Non-linear ampliication of the sound made by the cochlea indicates that it is working normally, es-pecially in relation to the OHC function, and a linear am-pliication for all levels of stimulus intensity indicates a cochlea with abnormalities.8
In alterations to the middle ear only, the function of the OHCs is not compromised, so the growth curve ob-tained will have the same coniguration as a normal exa-mination, i.e. with nonlinear ampliication, presenting only an increased DPOAE threshold. The realization of DPOAE growth curves in babies who “fail” the Newborn Hearing Screening Program would be important and use-ful to differentiate the presence of amniotic luid/vernix in the EAM (external auditory meatus) and/or tube dys-function from a cochlear abnormality,9 optimizing the
referral for audiological diagnosis.
Obtaining the thresholds for the emergence of DPOAE helps in the recommendation of hearing aids in the ca-ses of mild to moderate hearing losca-ses, increasing the in-formation provided to the professional who will perform this procedure.10
In addition to its possible applications, this line of research has not been well explored in newborns, mea-ning that studies in this area and on this speciic popu-lation are justiied.
O
BJECTIVETo determine the DPOAE emergence thresholds at the frequencies of 2000 Hz and 4000 Hz with a variation in the stimulus of 20 to 65dBNPS.
To establish the slope values obtained in the growth curves at the frequencies of 2000 Hz and 4000 Hz as a function of the intensity.
M
ETHODSThis is a prospective, cross-sectional and descriptive study. This was approved by the Research Ethics Committee of São Paulo’s Holy House of Mercy Brotherhood (project 277/10) and was conducted at the institution’s Speech Pathology Sector, with newborns born between March and August 2011. All of the newborns tested were born at São Paulo’s Holy House of Mercy Brotherhood and were tested after being discharged from hospital. At that time, the parents or guardians received a referral for rea-lization of newborn hearing screening at the hospital’s Speech Pathology Sector, at scheduled dates and times, within 4 weeks of birth, enabling investigation within the neonatal period.
Case-based reasoning
Inclusion criteria:
• Neonates born to term, over 37 weeks based on the New Ballard Score classiication.11
• No risk indicator for hearing loss according to the JCIH.12
• With OAE by transient stimuli and/or distortion product present in the newborn hearing screening program.
• Signed informed consent form.
Exclusion criteria:
• Newborns who did not sleep or woke up during the exam.
period was an average of 30minutes per newborn in a single session.
Characterization of the sample
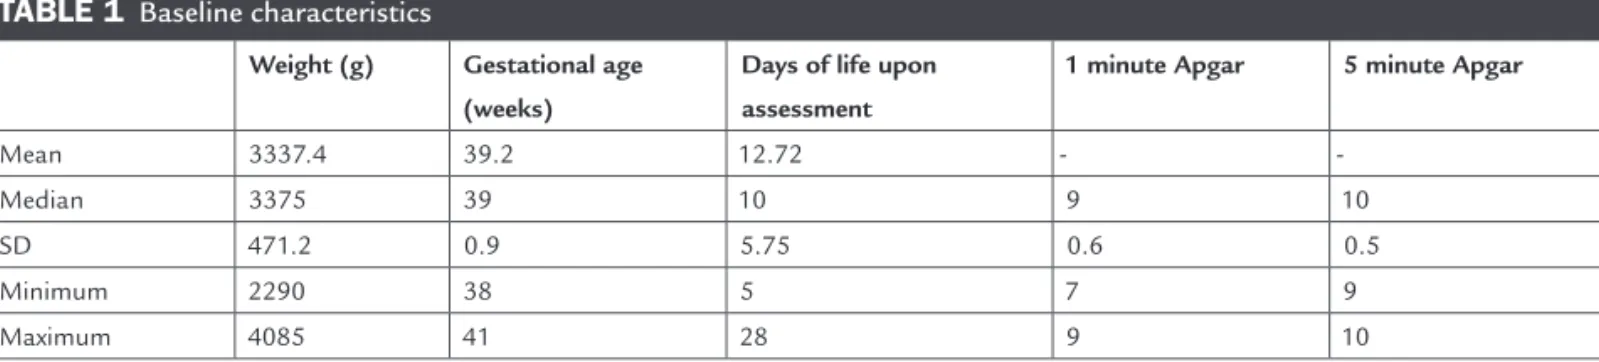
51 newborns were invited to participated in the study, ho-wever 12 did not maintain the conditions required to rea-lize the exam either because they woke up during the as-sessment, did not sleep for testing to begin, or did not respond in the newborn hearing screening after otoacous-tic emissions. Thus, 39 newborns parotoacous-ticipated in the study, 21 (53.8%) male and 18 (46.2%) female. The perinatal cha-racteristics of the newborns can be viewed in Table 1.
Equipment
The equipment used for the collection of the data in the study was the ILO V6 Otodynamics Analyzer, Cochlear Emissions Analyzer ILO292 DP Echoport Version 6, Otodynamics, London. A newborn probe was used for in-sertion (SGS-8) connected to channel A of the external unit of the ILO equipment.
Procedure
The exams were performed in a soundproof booth. The shape of the stimulus curve was monitored in the ear in ‘real-time’, ensuring the quality and reliability of the data collected. The probe was acoustically calibrated daily in a cubic centimeter cavity, for assessment of newborns. No otoscopy was conducted before the procedure.
In a state of natural sleep, the newborn was positio-ned to conduct the assessment, starting 50% of the exams in the right ear and 50% in the left ear, thus ensuring no interference from the irst ear tested.
The probe was adapted to capture DPOAE growth curves (GC) in the irst ear to be tested, results being re-corded with the following order of procedures:
• DPOAE GC at 2000Hz general paradigm
• DPOAE GC at 2000Hz paradigm 1
• DPOAE GC at 2000Hz paradigm 2.
• DPOAE GC at 4000Hz paradigm 1.
• DPOAE GC at 4000Hz paradigm 2.
Where:
• Paradigm 1 (P1): L2 from 20 to 40 dB NPS.
• Paradigm 2 (P2): L2 from 40 to 65 dB NPS.
• General Paradigm (GP): L2 from 35 to 65 dB NPS
Next, the same procedures were repeated in the second ear. The DPOAE GC were obtained for paradigms P1 and P2 based on the hypothesis that the slope would be higher (greater incline of the curve) in weak sounds (20 to 40dB SPL) and lower (lower incline of the curve) in midrange sounds (40 to 65dB SPL).
The quality of each exam was observed, ensuring equal assessment conditions with regard to the placement of the probes, stimulus intensity, stability and noise level. Thus, although the study of OAE in the neonatal popu-lation is delicate, the reliability of the response observed as increased.
The DPOAE growth curve was obtained for both ears. Two pure tones with primary frequencies denominated F1 and F2 were presented. The responses for analysis were obtained at 2F1-F2, with F1/F2 = 1.22. The F2 frequen-cies chosen were 2000 Hz and 4000 Hz for being the fre-quencies used most often in studies with this popula-tion.13
The intensities (L2) ranged from 20 to 65 dB SPL di-vided into three paradigms:
• Paradigm1: L2 (intensity of frequency F2) varied from 20 to 40 dB SPL with a 3 dB interval.
• Paradigm2: L2 (intensity of frequency F2) varied from 40 to 65 dB SPL with a 3 dB interval.
• General paradigm: L2 (intensity of frequency F2) varied from 35 to 65 dB SPL with a 5 dB interval.
TABLE 1 Baseline characteristics
Weight (g) Gestational age
(weeks)
Days of life upon assessment
1 minute Apgar 5 minute Apgar
Mean 3337.4 39.2 12.72 -
-Median 3375 39 10 9 10
SD 471.2 0.9 5.75 0.6 0.5
Minimum 2290 38 5 7 9
Maximum 4085 41 28 9 10
bles, absolute and relative frequencies were obtained and boxplot graphs were generated, as well as Wilcoxon signed--rank test, adopting a signiicance level of 5% for all tests.
R
ESULTSStudy of DPOAE emergence thresholds obtained with the growth curve
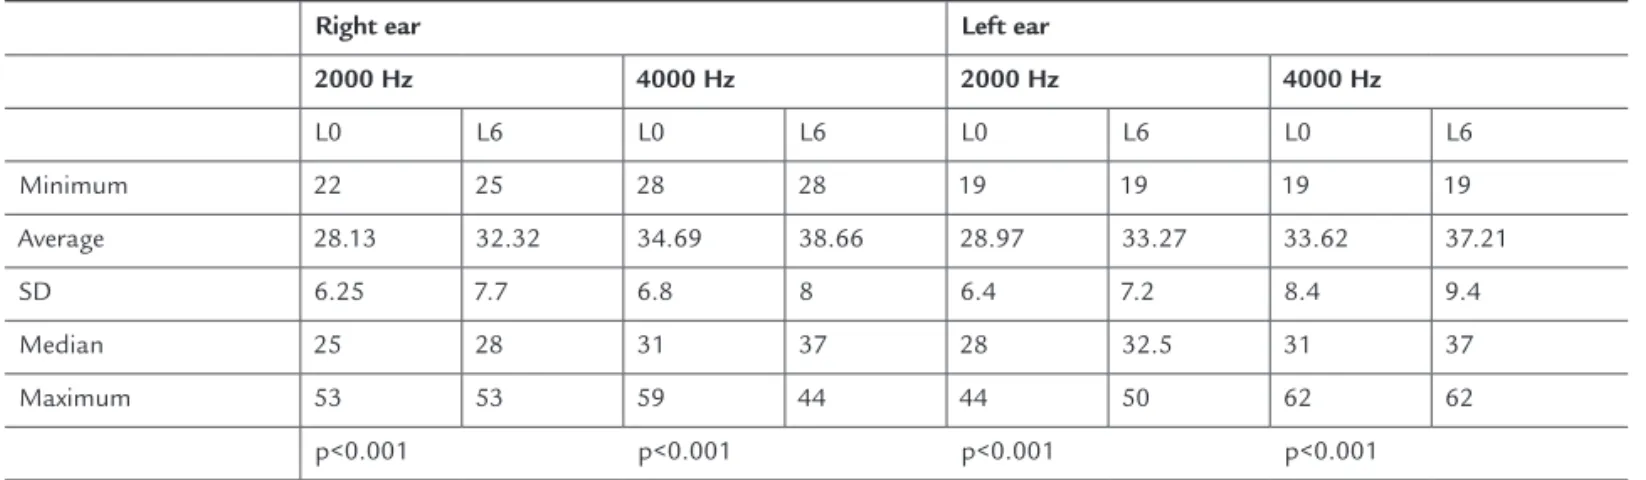
The Lim0 and Lim6 thresholds (described in Methods) on the right and left ears at frequencies of 2000 Hz and 4000 Hz were compared (Table 2). It was noted that the differences between the parameters used in the research (Lim0 and Lim6) were significant at the frequencies of 2000 Hz and 4000 Hz in both ears, but when compa-ring the left ear and right ear the differences were not significant.
Descriptive study of the slope obtained with the DPOAE growth curve
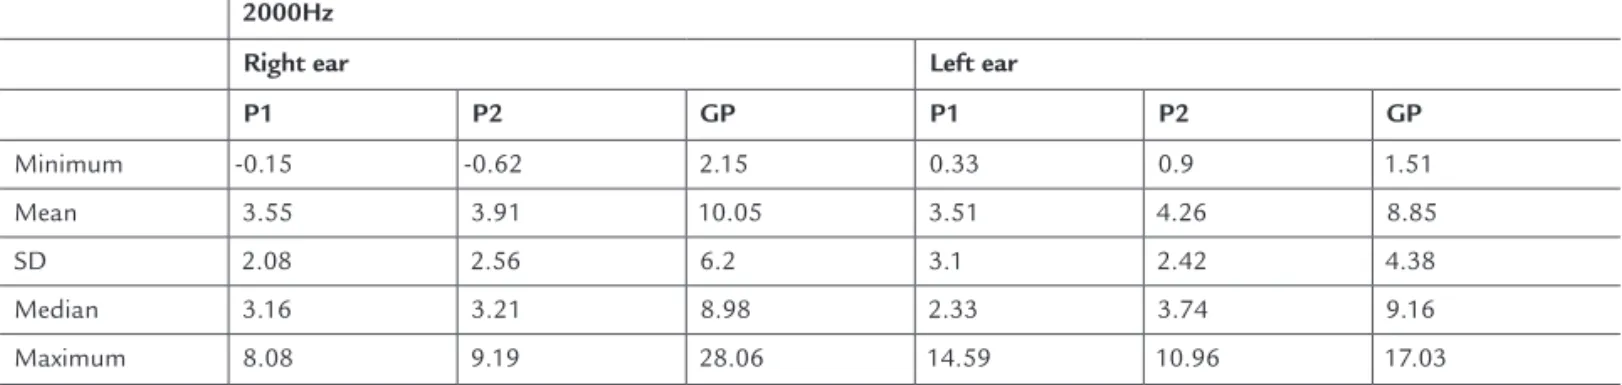
A descriptive analysis was undertaken of the slope values obtained with the realization of the DPOAE GC at fre-quencies of 2000 Hz and 4000 Hz in the three paradigms used in the study (Table 3 and 4).
The values of the slope obtained in paradigms P1 and P2 at 2000 Hz in the right ear and the left ear were compared, and no significant differences were found between them in both ears.When comparing the va-lues of the slope obtained in paradigms P1 and P2 at 4000 Hz in the right ear and the left ear, no significant difference was observed between them. We compared the slope values obtained at frequencies of 2000 Hz
• The intensity of L1 (intensity of frequency 1) was adjusted using the formula L1= 0.4L2+39 from Kummer et al.14
The exams were inalized when the background noise was equal to or lower than 0 dB SPL after a minimum of th-ree scans.
The following criteria were adopted to analyze the response in the signal to noise ratio (S/N):
• Lim0: intensity at which the S/N ratio is greater than or equal to zero – this was called Lim0 (threshold zero).
• Lim6: intensity at which the S/N ratio is greater than or equal to six – this was called Lim6 (threshold six).
To obtain the slope, three criteria were established in ac-cordance with the intensities established:
• GP = intensity varying from 35 to 65 dB SPL at 2kHz in 5 dB intervals.
• P1= intensity varying from 20 to 40 dB SPL at 2000 Hz and 4000 Hz in 3 dB intervals.
• P2= intensity varying from 40 to 65 dB NPS at 2000 Hz and 4000 Hz in 3 dB intervals.
Statistical analysis
The statistical analysis was undertaken using the pro-gram SPSS version 13.0.
The sample calculation was performed using Prime software, considering a signiicance level of 0.05.
For the descriptive analysis, the summary measures for quantitative variables were calculated. For qualitative
varia-TABLE 2 Distribution of emergence thresholds in decibels obtained in the 2 parameters (Lim0 and Lim6) by ear and by
frequency
Right ear Left ear
2000 Hz 4000 Hz 2000 Hz 4000 Hz
L0 L6 L0 L6 L0 L6 L0 L6
Minimum 22 25 28 28 19 19 19 19
Average 28.13 32.32 34.69 38.66 28.97 33.27 33.62 37.21
SD 6.25 7.7 6.8 8 6.4 7.2 8.4 9.4
Median 25 28 31 37 28 32.5 31 37
Maximum 53 53 59 44 44 50 62 62
p<0.001 p<0.001 p<0.001 p<0.001
and 4000 Hz in paradigm 1 in the right ear, and no sig-nificant difference between the frequencies was obtai-ned, with the same occurring in paradigm 2.When comparing the slope values obtained at frequencies of 2000 Hz and 4000 Hz in paradigm 1 and paradigm 2, on the left ear, a significant difference was not obtai-ned between frequencies.
D
ISCUSSIONThe same sequence presented in the results was maintai-ned for the presentation of the discussion.
Cochlear activity is characterized by the absolute signal of the response, and the criterion for identiication of the response depends on signal to noise ratio. Therefore, for analysis of the presence of DPOAE, it is necessary for the cochlear response to be above the noise. There is no
consen-sus in the literature about the recommended signal/noise ratio. Some studies have used an S/N ratio greater than or equal to 3dB, such as Neely et al.15 and Tiradentes et al.16
and there are others who have used an S/N ratio greater than 6dB, such as Gorga et al.8 and Boege and Janssen.17
The equipment used in this study - the ILO V6, analy-zes the presence of noise for each pair of frequencies tes-ted considering its mean plus 1 standard deviation. The-refore, the noise level displayed on the monitor screen is higher than the average noise by 6 dB, and therefore the presence of a response can be considered when the S/N ratio is greater than or equal to zero, according to the manufacturer’s protocol.
Analyzing the results when obtaining the DPOAE emer-gence thresholds with the GC, the results showed a signii-cant difference between the two criteria used (Lim0 and Lim 6) at the two frequencies (2000 Hz and 4000 Hz) in both ears, with the thresholds obtained in Lim0 smaller on ave-rage than those obtained in Lim6. According to a study by Dubno,6 signiicant differences were noted in the
emergen-ce thresholds of the DPOAE GC according to the criterion used at 2000 Hz and 4000 Hz. Comparing the results of the emergence thresholds according to the two criteria used (Lim0 and Lim6) signiicant differences at 2000 Hz were no-ted in both ears, as well as at 4000 Hz, also in both ears, the-refore always observing the criterion used in the study should be emphasized for possible comparisons of results.
The emergence thresholds at 2000 Hz were 30 dB on average, and 35 dB on average at 4000 Hz according to the criteria used (Table 2). These thresholds were lower than those obtained by Dubno6 where the responses emerged
TABLE 3 Distribution of the slope values obtained at 2000 Hz in the 3 paradigms for the right ear and left ear
2000Hz
Right ear Left ear
P1 P2 GP P1 P2 GP
Minimum -0.15 -0.62 2.15 0.33 0.9 1.51
Mean 3.55 3.91 10.05 3.51 4.26 8.85
SD 2.08 2.56 6.2 3.1 2.42 4.38
Median 3.16 3.21 8.98 2.33 3.74 9.16
Maximum 8.08 9.19 28.06 14.59 10.96 17.03
SD: standard deviation; P1: 1 paradigm (stimulus intensity ranging from 20 to 40 dB SPL); P2: paradigm 2 (stimulus intensity ranging from 40 to 65 dB SPL); GP: general paradigm (stimulus in-tensity ranging from 35 to 65 dB SPL).
TABLE 4 Distribution of the slope values obtained at
4000 Hz in the 2 paradigms for the right ear and left ear
4000Hz
Right ear Left ear
P1 P2 P1 P2
Minimum 0.54 -1.38 -0.04 0.2
Mean 3.97 3.7 3.01 3.06
SD 3.17 3.51 2.65 2.84
Median 2.6 2.68 2.4 2.51
Maximum 11.58 15.9 12.33 14.44
at 50 dB at 2000 Hz and 60 dB at 4000 Hz. In this study we considered three thresholds denominated Threshold1, Threshold2 and Threshold3 where:
• Threshold1 (Lim1) = lowest intensity studied whe-re the signal/noise ratio is gwhe-reater than or equal to 3dB;
• Threshold2 (Lim2) = lowest intensity studied whe-re the signal/noise ratio is gwhe-reater than or equal to 3dB and 2F1-F2 with a positive value; and
• Threshold3 (Lim3) = lowest intensity studied whe-re the signal/noise ratio is gwhe-reater than or equal to 3dB and subsequent intensities also present a S/N ratio greater than or equal to 3dB, with the emer-gence threshold considered when it appeared in 70% of cases.
Therefore, the responses were better at 2000 Hz compa-red to 4000 Hz such as those obtained in the aforemen-tioned study.
When comparing the left ear with the right ear, the differences were not signiicant due to the number of new-borns composing the sample, which was not suficient for this purpose. These results compare to those obtai-ned by Leme and Carvallo18 and Costa et al..19 There are
studies already established in the literature that show that OAE responses are better in the right ear for the female gender compared to the left ear for the male gender, Leme and Carvallo,18 Aidan et al..20 and Durante et al.21
The results obtained in the DPOAE growth curves in this study were used to calculate the mean responses for each intensity, using 2F1-F2 and the signal to noise ratio at the frequencies of 2000 Hz and 4000 Hz, in order to obtain an average curve proile for newborns and to iden-tify the occurrence of any compression pattern for the responses in this age group. To obtain the mean, the grou-ped results of the left and right ears at each intensity and frequency were used, given that there was no signiicant difference between them in this study.
The DPOAE GC were obtained for paradigms P1 and P2 based on the hypothesis that the slope would be higher (greater incline of the curve) in weak sounds (20 to 40dB SPL) and lower (lower incline of the curve) in midrange sounds (40 to 65dB SPL). According to Gorga et al.8
coch-lear gain is higher for weaker stimulus levels, decreasing as the level increases. That is, the cochlea is more
com-pressive when stimuli are of medium intensity. In this work, the slope values obtained at 2000 Hz were lower in P1 than P2 in both ears, and at 4000 Hz in the right ear P1 was higher than P2, and in the left ear P1 was lo-wer than P2, as in 2000 Hz. These differences lo-were not signiicant.However, visually, the slope in P1 is greater than in P2. The slope value was higher on average at 2000 Hz than 4000 Hz (except for the slope obtained in P1 in the right ear at 4000 Hz, which was greater than the cor-responding slope at 2000 Hz). If the DPOAE growth cur-ve enables detection of the presence of cochlear compres-sion upon calculating the slope, the numerical results of this study did not make it possible to prove the presence of cochlear compression in the sample, though looking at the growth curve graphs a decrease was seen in the slo-pe of the curves at midrange intensities.
It was not possible to make comparisons with other slope studies obtained in two paradigms, as no work using DPOAE GC in this way was found in the literature. Ho-wever, a study by Almeida7 noted a change in the incline
of the curve of the slope from 65 dB, which would be the compression point for the frequencies studied (the DPOAE GC was outlined with stimuli a variation range between 35 and 75 dB with 5 dB intervals at 2000 Hz and 4000 Hz). Comparing these results with the present study was not possible, because 65dB was the largest stimulus used in the paradigms presented. In studies with adults, the com-pression point was between 50 and 60 dB.3,15,22
When using the general paradigm the slope values were higher than those obtained in paradigms 1 and 2, but the comparison was not made because of the use of different criteria.
C
ONCLUSIONThe emergence thresholds were on average 30 dB SPL at 2000 Hz and 35 dB SPL at 4000 Hz, therefore the best emergence thresholds were at a frequency of 2000 Hz compared to 4000 Hz.
No difference in the slope values obtained in the DPOAE growth curves were noted, but slopes were stee-per at the weakest intensities (P1) and more linear at the moderate intensities (P2) suggesting that the visual analy-sis of the graph relects cochlear compression.
A
CKNOWLEDGEMENTSPeter Bray and Lee Van Middlesworth at Otodynamic, who collaborated with technical knowledge whenever consulted. Prof. Erika Fukunaga for the statistical analy-sis. Mirtes, Sonia and Daniel, postgraduate secretaries, for their constant and indispensable help. Sadia Hussein Mustafá for the articles obtained and cataloging data. The Faculty of Medical Sciences at the Santa Casa de São Paulo and São Paulo’s Holy House of Mercy Brotherhood. Capes for the scholarship grant provided. To those res-ponsible for the newborns that accepted the invitation to participate in this study.
R
ESUMOCurva de crescimento das emissões otoacústicas produ-to de disprodu-torção em neonaprodu-tos.
Introdução: o registro das emissões otoacústicas permitiu comprovar que a cóclea, além de receber os sons, produz energia acústica. Com a medida das emissões otoacústicas – produto de distorção (EOAPD), veriica-se o crescimento da resposta de acordo com a intensidade do estímulo sono-ro apresentado (curva de crescimento).
Objetivo: determinar os limiares de surgimento das EOA-PD nas frequências de 2.000 e 4.000 Hz com estímulo de 20 a 65 dB NPS e estabelecer os valores de slope obtidos nas curvas de crescimento.
Métodos: foram estudados 39 neonatos com 5 a 28 dias de vida sem indicadores de risco para perda auditiva. A capta-ção das curvas de crescimento das EOAPD foi realizada em 2.000 e 4.000 Hz com nível de intensidade variando de 20 a 65 dB em dois paradigmas (20 a 40 dB NPS e 40 a 65 dB NPS).
Resultados: houve diferença estatística signiicante dos limiares de surgimento das EOAPD dependendo do
cri-tério utilizado. Os limiares foram, em média, mais eleva-dos em 4.000 Hz do que em 2.000 Hz, e o slope foi, em mé-dia, maior em 2.000 Hz do que em 4.000 Hz; porém, com diferença não signiicante em ambos os casos.
Conclusão: os limiares de surgimento foram, em média, 30 dB NPS em 2.000 Hz e 35 dB NPS em 4.000 Hz. Os va-lores do slope variaram, em média, entre 3 e 4, chegando a 15 em alguns casos.
Palavras-chave: emissões otoacústicas espontâneas; tes-tes auditivos; audição; recém-nascido.
R
EFERENCES1. Kemp DT. Stimulated acoustic emissions from within the human auditory system. J Acoust Soc Am. 1978;64(5):1386-91.
2. Ruggero M, Rich N, Naryan SS, Robles L. Basilar-membrane responses to tones at the base of the chinchilla cochlea. J Acoust Soc Am.1997;101(4):2151-63. 3. Gorga MP, Neely ST, Dierking DM, Kopun J, Jolkowski K, Groenenboom
K, et al. Low–frequency and high- frequency cochlear nonlinearity in humans. J Acoust Soc Am. 2007;122(3):1671-80
4. Abdala C. Distorcion product otoacoustic emission (2i-f2) amplitude growth in human adults and neonates. House Ear Institute. J Acoust Soc. Am. 2000; 107(1):446-56.
5. Kemp DT. Otoacoustic emissions, their origin in cochlear function, and use. Br Med Bull. 2002;63:223-41.
6. Dubno JR, Horwitz AR, Ahlstrom JB. Estimates of basilar-membrane nonlinearity effects on masking of tones and speech. Ear Hear. 2007;28(1):2-17. 7. Almeida PP. Crescimento das emissões otoacústicas evocadas-produto de
distorção: estudo em neonatos [Dissertação] São Paulo: Faculdade de Medicina, Universidade de São Paulo; 2010.
8. Gorga MP, Neely ST, Dorn PA, Konrad-Martin D. The use of distorcion product otoacoustic emission suppression as an estimate of response growth. J Acoust Soc Am. 2002;111(1):271-84.
9. Gehr DD, Janssen T, Michaelis CE, Deingruber K, Lamm K. Middle ear and cochlear disorders result in different DPOAE growth behaviour:implications for the differentiation of sound conductive and cochlear hearing loss. Hear Res. 2004;193(1-2):9-19.
10. Janssen T, Niedermeyer HP, Arnold W. Diagnostics of the cochlear ampliier by means of distortion product otoacoustic emissions. ORL J Otorhinolaryngol Relat Spec. 2006;68(6):334-9.
11. Ballard JL, Khoury JC, Wedig K, Wang L, Eilers-Walsman BL, Lipp R. New Ballard Score, expanded to include extremely premature infants. Joint Committee on Infant Hearing 2007 Position Statement. ASHA. 1994;36:38-41.
12. Haddad GG, Green TP. Diagnostic approach to respiratory disease. In: Kliegman RM, Behrman RE, Jenson HB, Stanton BF, editors. Nelson textbook of pediatrics. 19th Philadelphia: Saunders Elsevier; 2011. chapter 366.
13. Almeida PP, Sanches SGG, Carvallo RMM. Limiar da função de crescimento das emissões otoacústicas por produto de distorção em neonatos Pró Fono. 2010;22(4):409-14.
14. Kummer P, Janssen T, Wolfgang A. The level and growth behavior of 2f1-f2 distortion product otoacoustic emission and its relationship to auditory sensitivity in normal heraring and cochlear hearing loss. J Acoust Soc Am. 1998;103(6):3431-44 .
15. Neely ST, Johnson TA, Kopun J, Dierking DM, Gorga MP. Distortion-product otoacoustic input/output characteristics in normal-hearing and hearing-impaired human ears. J Acoust Soc Am. 2009;126(2):728-38.
de distorção em indivíduos com audição normal. Rev Bras Otorrinolaringol. 2002;68(1):21-6.
17. Boege P, Janssen T. Pure-tone threshold estimation from extrapolated distortion product otoacoustic emission I/O- functions in normal and cochlear hearing loss ear. J Acoust Soc Am. 2002;111(4):1810-8. 18. Leme VN, Carvallo RMM. Nível de emissões otoacústicas por estímulo
transiente e por produto de distorção em neonatos com e sem risco para perda auditiva. J Bras Fonoaudiol. 2005;(23):388-93.
19. Costa JMD, Almeida VF, Oliveira CACP, Sampaio ALL. Emissões otoacústicas por estímulo transiente e por produto de distorção em recém-nascidos prematuros. Arq Int Otorrinolaringol.2009;13 (3); 309-16.
20. Aidan D, Lestang P, Avan P, Bonils P. Characteristics of transient evoked otoacoustic emissions (TEOEs) in neonates. Acta Otolaryngol. 1997;117(1):25-30. 21. Durante AS, Carvallo RMM, Costa FS, Soares JC. Characteristics of transient
evoked otoacoustic emission in newborn hearing screening program. Pró-Fono. 2005;17(2):133-40.