Original Article
Artigo Original
Priscila Campos Martins1 Thalita Evaristo Couto1 Ana Cristina Côrtes Gama2
Descritores
Fonoaudiologia Escala Visual Analógica Voz Disfonia Distúrbios da Voz Keywords
Speech, Language and Hearing Sciences Visual Analog Scale
Voice Dysphonia Voice Disorders
Correspondence address:
Priscila Campos Martins
Avenida Professor Alfredo Balena, 190, Sala 251, Belo Horizonte (MG), Brasil, CEP: 30130-100.
E-mail: [email protected]
Received: 09/05/2014
Study carried out at the Speech Language Pathology and Audiology Course, Universidade Federal de Minas Gerais – UFMG – Belo Horizonte (MG).
(1) Speech Language Pathology and Audiology Course, School of Medicine, Universidade Federal de Minas Gerais – UFMG – Belo Horizonte (MG), Brazil.
(2) Speech Language and Audiology Department, School of Medicine, Universidade Federal de Minas Gerais – UFMG – Belo Horizonte (MG), Brazil.
Financial support: Conselho Nacional de Desenvolvimento Cientíico e Tecnológico – CNPq.
Conlict of interests: nothing to declare.
Auditory-perceptual evaluation of the degree of vocal
deviation: correlation between the Visual Analogue Scale
and Numerical Scale
Avaliação perceptivo-auditiva do grau de desvio vocal:
correlação entre escala visual analógica e escala numérica
ABSTRACT
Purpose: To analyze the intra- and inter-rater agreement for visual analog scale and numerical scale in task of sustained vowel and to determine numerical cutoff points to visual analog scale corresponding to the degrees of the numeric scale. Methods: We selected 205 samples of the usual task of the sustained vowel /a/. Six voice specialists rated the overall degree of vocal deviation, irst by visual analog scale and, after two days, by the numeric scale. The results obtained by both scales were compared and the intra- and inter-rater agreement, the correlation between the scales, and the estimated cutoff points using the intraclass correlation and concordance Kappa coeficients, the Spearman coeficient, and analysis of variance, and the values of sensitivity and speciicity were analyzed.
Results: A strong correlation was observed between the scales. The following numerical cutoff values were found for visual analog scale corresponding to the numerical scale: neutral (degree zero) – 0 to 34 mm; mild (degree one) – 34.1 to 51 mm; moderate (degree two) – 51.1 to 63.5 mm; intense (degree three) – 63.6 to 77.5 mm; and extreme (degree four) – above 77.5 mm. Conclusion: The visual analog scale and numerical scale showed a strong correlation, being observed the greater intra- and inter-rater agreement in visual analog scale. Numerical cutoff values for visual analog scale were found. This correlation enables the comparison between the results found in the evaluation of the overall degree of vocal deviation by both scales, which are widely used in research and in the clinical speech therapy routine.
RESUMO
INTRODUCTION
Although there is no consensus as for the concept of nor-mal and altered voice(1,2), an emission considered to be of good quality by listeners and produced without discomfort by speak-ers characterizes a normal voice, whereas an emission consid-ered as noisy by listeners and produced with some discomfort by the speaker characterizes dysphonia(1).
The speech language evaluation is an effective instrument to describe the vocal proile of the individual, to characterize the vocal quality, and to quantify the vocal deviation(3). The most recommended forms of evaluation in speech language pathol-ogy clinical routine are the acoustic and perceptual-auditory analyses of the voice. The acoustic analysis quantiies the sound signal, which makes the vocal analysis more objective. The perceptual-auditory analysis is a subjective evaluation based on the auditory impressions the evaluators have on the vocal emission of the individual, which shows interference of anatomical and physiological data and provides information on the psychosocial aspects of the voice(4).
Despite the criticism about the subjectivity and impreci-sion of the terminology involved in this procedure, the percep-tual-auditory evaluation is traditional in the speech language pathology clinical routine, considered as the golden standard for the analysis of vocal quality(3). To potentially reduce the variability and the inconsistencies in the perceptual-auditory analysis, we developed a series of evaluation scales(4), consid-ering that the most often used ones are the Consensus Auditory Perceptual Evaluation – Voice (CAPE-V)(5,6), whose measur-ing of the severity of the voice disorder is carried out with the use of a visual analog scale (VAS), and the GRBAS scale(7,8), in which the measurement is performed through the use of a numerical scale (NS).
The CAPE-V VAS and the GRBAS NS are widely used for perceptual-auditory evaluation of the voice both in research and in speech language pathology clinical practice. In clinical settings , as well as in research, the vocal evaluation result is compared using these two scales, which use both the sustained vowel task and the automatic and chained speech. However, the different ways of measuring these two scales impair this comparison. Thus, making the comparison between the VAS and the NS, as well as analyzing their correlation and determin-ing speciic numerical cutoff points, will allow the comparison between these two scales.
The VAS consists of a straight line, usually of 100 mm length, in which listeners must mark the point corresponding to the extension of the variation of a given characteristic, such as the degree of voice deviation(4,9).The VAS is anchored by two verbal descriptors to represent the extremes, being usually anchored by “absence of pain or alteration” (in 0 mm in the straight line) and “maximum pain or alteration” (in 100 mm in the straight line). Numbers or verbal descriptors are not recommended in intermediary points of the straight line to avoid the agglomeration of points around a preferred numeri-cal value(9,10). Widely used in health by different professionals, the VAS is mainly used as self-perception tool of the patient for pain or discomfort(4,9,11), though it is also used to measure
the severity of a disease or alteration(6,10). The NS consists of a speciic number of equidistant points, such as a scale of four points indicating the degree of voice deviation, where zero cor-responds to a voice without deviation and three, to an extreme voice deviation(4,9). The NS is mainly used to measure the sever-ity of a disease or alteration(6,10). A research(10) comparing the VAS with the NS in evaluating the severity of allergic rhini-tis pointed out that the VAS represents best the severity of the situation, once that, through it, the patient presents best their perception of the alteration. Besides, doctors and patients par-ticipating in the research reported that the use of VAS is faster and easier than that of the NS.
The perceptual-auditory analysis of the voice is also inlu-enced by factors such as time of training and previous experience of the evaluator, as well as the guidance received, the degree of vocal quality deviation, and the speech task used(1,3,12). The sus-tained vowel and chained speech tasks are widely used in the perceptual-auditory evaluation of the voice. The vocal behavior substantially differentiates in these two speech language tasks, taking into consideration the difference in the perceptual-audi-tory evaluation of the type and degree of voice deviation(13).
Other studies(2,14) deined, with great similarity, the numerical cutoff point for the normal variability of voice for the VAS cor-responding to the zero degree of NS in the perceptual-auditory evaluation of voices from the task of chained speech. There was no study found in the literature that had analyzed such correspon-dence of the sustained vowel task. The irst research mentioned earlier(14) was carried out using a generic VAS and the GRBAS NS. Other studies(2,15) correlated a VAS and a NS, both generic. Only the third research mentioned earlier(2), besides inding the cutoff point for normal voice variability, deined the cutoff point values of indicatives of different degrees of vocal deviation for VAS from the values in an NS of four points. In this research, we opted to analyze the generic VAS and NS, as in the previ-ous studies, once it concludes the CAPE-V and GRBAS scales, though not limited to them. Besides, the GRBAS is a four-point scale and, in this present study, we have chosen to use a ive-point NS, as suggested in the study previously carried out(2) and in the International Classiication of Functioning (ICF)(16). In the ICF, it is recommended that the measuring of a problem (an impairment, limitation, restriction, or barrier) in a generic scale is performed with ive points, namely zero=neutral; one=slight problem; two=moderate problem; three=intense problem; and four=extreme problem.
The objectives of this study were to analyze the concordance intra- and inter-evaluators for the VAS and the NS in the sus-tained vowel task and to determine the numerical cutoff points of the VAS corresponding to the degree of neutral (degree zero), slight (degree one), moderate (degree two), intense (degree three), and extreme (degree four) vocal deviation.
METHODS
We selected 205 samples and archived 381 voices in data-bases in the medical Ofice of one of the authors and in the Speech Language and Audiology Ambulatory of the Hospital das Clínicas of the Universidade Federal de Minas Gerais. The database consisted of vocal samples from men and women aged 18 years or older, from the sustained vowel /a/ task on a regular basis for approximately 5 seconds, neutral and altered voices of various degrees, with dysphonia. All participants involved agreed to participate in the research and signed the informed consent. Each author listened to 381 voices separately, using a stereo headset, Multilaser Vibe Headphone model, and classiied them according to the overall dysphonia degree into the following: without deviation or with slight, moder-ate, intense, and extreme degrees of deviation. The voices that were in accordance with at least two evaluators were selected, totaling 205 samples consisting of neutral and altered voices of various degrees.
The size of the sample was determined from the Kappa index proposed by Fleiss, with statistical power of 80% and signiicance level of 5%, deining 205 voices for six evalua-tors. To analyze the intra-evaluators concordance, we repeated 20% voices randomly, totaling 226 voices.
Six evaluators, speech language and audiology therapists specialized in voice, aged between 24 and 36 years, with more than one year of experience in the area, were selected.
For the evaluation, a VAS of 100 mm and a ive-point NS were used. The parameter used in each voice was the overall voice deviation (G), which corresponds to the intensity of the voice alteration, subject to variations from “no alteration” to the most intense degree of alteration. Each evaluator received two envelopes, the irst one containing a CD-ROM with the voices recorded randomly and the VAS protocol, and the second envelope containing another CD-ROM with the same voices recorded, however with different names and orders, as well as the NS protocol. Besides, each evaluator received a stereo Multilaser Vibe Headphone.
The analysis tasks were performed independently and in two stages: evaluation of the sustained vowel samples through the VAS and the evaluation of the same voices with the NS. The interval between the two stages covered two days to reduce the possibility of memorization. In the VAS, the evaluator lis-tened to the voice and marked in the 100 mm straight line the measure that they considered was the deviation for that voice, namely 0 mm, no deviation and 100 mm, maximum deviation level. In the NS, the evaluator measured the G in a scale of ive points: zero, neutral; one, slight; two, moderate; three, intense; and four, extreme. The evaluators could listen to the voices more than once when necessary to be sure of their answers.
After each evaluator performed the requested tasks, the statistical analysis was carried out with the Microsoft® Ofice Excel 2007 and STATA (Stata Corporation, College Station, Texas) software, version 12.0. In all analyses, we considered a signiicance level of 5%. To analyze the intra- and inter-evaluator concordance of the VAS, the intraclass correlation coeficient was used and, for the NS, the Kappa concordance coeficient was used. The numerical synthesis of the data was performed, considering that, for the VAS, we analyzed means, quartiles,
minimum, maximum, and standard deviation, besides the dis-persion graphics and box plot; for the NS, frequency and pro-portions were analyzed. The correlation between the scales was evaluated through the Spearman coeficient. For the compari-son of the means, we used the analysis of variance (ANOVA). To estimate the cutoff point of the correspondence between VAS and NS, the sensitivity and speciicity of the scales were veriied through values of true positive (TP), true negatives (TN), false positives (FP), and false negatives (FN), using the formula VP/(VP+FN) for sensitivity and, for speciicity, VN/ (VN+FP). The values of TP, TN, FP and FN were found in the crossing of the category scale (NS) with the quintiles of the continuous scale (VAS).
RESULTS
The VAS was observed to present higher concordance val-ues of intra- and inter-evaluator when compared to the NS (Tables 1 and 2).
A strong correlation was observed between the VAS and the NS, veriied through the Spearman correlation coeficient (0.95). The distribution between the two scales was, in general,
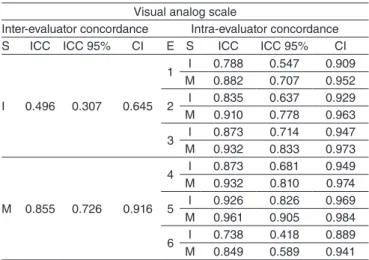
Table 1. Values of the inter- and intra-evaluator concordance in the analysis by the visual analog scale
Visual analog scale
Inter-evaluator concordance Intra-evaluator concordance
S ICC ICC 95% CI E S ICC ICC 95% CI
I 0.496 0.307 0.645
1 I 0.788 0.547 0.909
M 0.882 0.707 0.952
2 I 0.835 0.637 0.929
M 0.910 0.778 0.963
3 I 0.873 0.714 0.947
M 0.932 0.833 0.973
M 0.855 0.726 0.916
4 I 0.873 0.681 0.949
M 0.932 0.810 0.974
5 I 0.926 0.826 0.969
M 0.961 0.905 0.984
6 I 0.738 0.418 0.889
M 0.849 0.589 0.941
In the statistical analysis, the intraclass correlation coefficient (ICC) was used. Caption: S = scale; CI = confidence interval; E = evaluator; I = individual; M = mean
Table 2. Values of inter- and intra-evaluator concordance in the analysis by numerical scale
Numerical scale
Inter-evaluator concordance Intra-evaluator concordance
A Kappa p-value E C (%) Kappa p-value
0 0.075 <0.001 1 66.67 0.521 <0.001
1 0.144 <0.001 2 42.86 0.270 0.007
2 0.008 0.075 3 80.95 0.700 <0.001
3 0.051 0.059 4 76.19 0.629 <0.001
4 0.272 <0.001 5 57.14 0.382 0.001
Overall 0.114 <0.001 6 66.67 0.538 <0.001
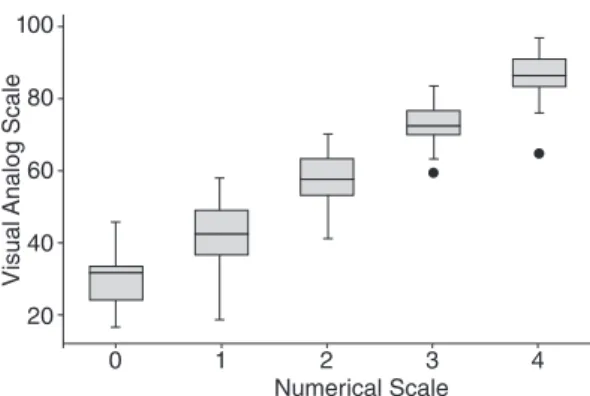
observed to be symmetrical, being more asymmetric in degrees zero, three, and four of the NS. A lower dispersion was found in degree three of the NS and the presence of outliers in degrees three and four, indicating that the analysis of one of the evalu-ators for that degree presented discrepant values in relation to the ones of other evaluators (Figure 1).
When performing the VAS analysis through the NS degrees using the ANOVA test, a difference was observed between the means (p<0.001). This result shows that the mean values found in the VAS for each degree are different from one degree to another in the NS.
The cutoff point for the VAS equivalent to the NS degrees deined by numerical synthesis and evaluation of sensitivity and speciicity of the points found are speciied in Table 3 and in Figure 2.
DISCUSSION
The term normal voice is controversial and the very nature of the human vocal manifestation offers limitations in establishing
a criterion broadly acceptable that allows a consensus(2,15). This dificulty is addressed by the literature, which reinforces the importance of standardization, despite all reservations that may be made about what is normal voice and its alterations(1).
Previous studies on the perceptual-auditory evaluations of the voice have shown that the reliability of this analysis may increase with the elimination of factors that inluence the vari-ability of the evaluator, using, for example, corresponding tasks, external synthetic anchors, sustained vowel stimuli, and unidi-mensional classiications, besides the protocols validated and used in large scale(17). In this study, the main interference factors in the perceptual-auditory analysis were properly controlled. As evaluators, we selected speech language and auditory ther-apists specialized in voice with more than one year of experi-ence in evaluating and treating voice disorders. It was decided to carry out the analysis of the overall degree of deviation (G), for being considered, according to the literature, a robust and reliable parameter(3). In a previous research(18), which aimed at characterizing the reliability of intra- and inter-evaluators in the evaluation of all the parameters of the GRBAS using the NS, the G, along with the roughness and breathiness param-eters, was what presents higher inter-evaluator concordance. For the evaluation of this research, a ive-point NS was used, as proposed by the ICF(16) to quantify a law, an impairment, problems, or barriers. A previous study(2) on the correlation between the VAS and the NS in the perceptual-auditory evalu-ation of the G also suggested such a proposal to allow a better deinition of normal variability of the voices and a separation of the slight deviations, as well as a more precise category of intense deviations(2,15). In the present research, the sustained vowel /a/ task produced on a regular basis was chosen, once that, according to the literature, the results found in the per-ceptual-auditory evaluation may differentiate according to the stimulus presented, also inluencing the inter-evaluator con-cordance(11,13,19). The sustained vowel is easier to be obtained and standardized, once it is not affected by the articulation of sound of speech and it is characterized by a relatively static coniguration of the laryngeal and supralaryngeal muscles with a minimum variation while producing it(20). This stability and consistency in the production of the sustained vowel collabo-rated to a high inter-evaluator concordance(18,20). A research(21) correlated the task of speech to the reliability found in the per-ceptual-auditory evaluation of the voice, and the task that pre-sented highest inter-evaluator concordance was the sustained vowel /a/ emission on a regular basis, for the G parameter.
This study observed a higher inter-evaluator concordance in the evaluation by the VAS (0.855) than by the NS (0.114) (Tables 1 and 2), results in concordance with a study that cor-related the two scales in the perceptual-auditory evaluation of the overall degree of voice deviation(2,15), observing values of inter-evaluator concordance slightly higher for the VAS (0.849) than for the NS (0.821). The higher inter-evaluator concordance allows stablishing between the normal variability of voice qual-ity and the overall voice deviation. Other studies that also ana-lyzed the G parameter, comparing the VAS and the NS, pointed out that the VAS presents higher inter-evaluator reliability and it is more sensitive to small marking differences than the
Visual Analog
Scale
Numerical Scale 100
80
60
40
20
0 1 2 3 4
A numerical synthesis of the correlation data between the visual analog scale and numerical scale, as well as the box plot graphic to represent this correlation.
Figure 1. Correlation between the visual analog scale and the numerical scale in the vowel task
Table 3. Cutoff point for the visual analog scale equivalent to the degrees of the numerical scale in the sustained vowel task
Degree Cutoff values
(mm) Sensitivity Specificity Efficiency
0 34 0.76 0.93 0.89
1 51 0.62 0.90 0.83
2 63.5 0.66 0.93 0.89
3 77.5 0.70 0.94 0.89
4 Above 77.5 0.90 0.94 0.93
A numerical synthesis of the data was carried out to find cutoff values and the evaluation of sensitivity and specificity of the points found.
Caption: N = neutral; S = slight; M = moderate; I = intense; E = extreme.
Figure 2. Grading ruler for the visual analog scale, based on the respective cutoff values, according to the perceptual-auditory analysis
34 51 63. 5 77.5
100 mm
E I
NS(4). A research(22) that compared the evaluation of G and of the roughness, breathiness, asthenia, and tension parameters and of 14 dysphonic voices in the sustained vowel task, per-formed by 29 evaluators, using the NS of the GRBAS scale and a VAS, veriied that there was a higher inter-evaluator con-cordance in the evaluation by the NS. The result found differs from that of this study, which may be related to the evaluated parameters, once that the overall degree of voice deviation. It may also be related to the size of the sample as well as the number of evaluators.
The intra-evaluator concordance in this study was also higher in the evaluation by the VAS (0.849 to 0.961) than in the NS (0.270 to 0.700) (Tables 1 and 2), which shows that the listen-ers were more consistent in their evaluations through VAS and corroborates the results of previous studies(2,15).
As for the correlation between the two scales, in the present research, a strong correlation was observed between the VAS and the NS, veriied through the Spearman correlation coefi-cient(0.95) for the sustained vowel task. This inding corrobo-rates with other analyses(2,4,14), despite having been carried out just with the chained speech task. All the indings showed that a correlation existed between the scales, allowing comparisons between the results.
In a study conducted in Finland, which had the objective of deining the differentiation between the normal variation of voice quality and voice alterations by perceptual-auditory analysis, two speech language and audiology therapists evalu-ated the G parameter of 226 samples through the GRBAS NS and the VAS(14). After comparing the evaluations through the two scales, the authors concluded that, in a VAS of 100 mm, 34 mm would be the cutoff point for the normal variation, considering that the voices marks above this point would represent an altered voice(14). This study was reproduced in Brazil, evaluating the same parameter, however the evalu-ations were carried out by a single evaluator(15). The result found was very close to that was found in the Finish study(14), considering the cutoff value obtained of 34.5 mm, showing that this form of analysis seems quite robust and do not suf-fer the inluence of cultural aspects of the voice quality(15). A second reproduction of the study was carried out in Brazil with four evaluators and 211 voice samples, with the objec-tive of deining cutoff values of different degrees of the voice deviation in the VAS, according to the values of a four-point NS(2). The cutoff value found for the normal variation on the voice quality was 35.5 mm; for the degree of voice deviation from slight to moderate was of 35.6 to 50.5 mm; for the mod-erate to the intense degree was 50.6 to 90.5 mm; and for the intense degree, it was over 90.5 mm. This was the only study performed previously that compared the VAS with a four-point NS in the perceptual-auditory evaluation of the overall voice degree and determined the cutoff values for the VAS corre-sponding to the NS degrees. All those studies were performed with voice samples of the chained speech task(2,14,23).
In this research, the following numerical cutoff values were found: neutral (degree zero), 0 to 34 mm; slight (degree one), 34.1 to 51 mm; moderate (degree two), 51.1 to 63.5 mm; intense (degree three), 63.6 to 77.5 mm; extreme (degree four),
above 77.5 mm (Table 3 and Figure 2). The results found in this research showed similarities with the indings in the liter-ature(2,14,23) and that the kind of speech task seems not to inlu-ence the correlation between the VAS and the NS for the neutral and slight deviation degrees. The points close to 34 and 50 mm are presented as cutoff values of the variation of the neutral voice quality and slight deviation, respectively, for the chained speech according to the literature(2,14,23) and for the sustained vowel according to the indings of this research. The values corresponding to the moderate and intense degrees of devia-tion between the VAS and the NS referred by the literature(2) are different from the results of this research (Table 3). Such discrepancy may be justiied by the speech task because the sustained vowel task tends to be evaluated with higher devia-tion when compared to the chained speech(24). This research also analyzed the extreme deviation degree according to what was oriented by the ICF(16); such correspondence was not vali-dated by the literature.
The results found allow the comparison between the percep-tual-auditory evaluation of the overall voice deviation degree by the VAS and the evaluation by the NS. It is suggested that new studies are carried out comparing the VAS and the NS in the perceptual-auditory evaluation of other voice parameters using the sustained vowel and the chained speech tasks.
CONCLUSION
It was veriied that the VAS and the NS showed a high correlation, observing a higher intra- and inter-evaluator con-cordance in the VAS. Numerical cutoff values of 34 mm for degree zero (neutral), 51 mm for degree one (slight), 63.5 mm for degree two (moderate), 77.5 mm for degree three (intense), and above 77.5 mm for degree four (extreme) of the VAS in the sustained vowel task were observed. This correlation allows the comparison between the results found in the evaluation of the overall degree of voice deviation by the VAS and the NS, scales widely used in researches and in the clinical speech lan-guage and audiology therapy routine.
*PCM, TEC, and ACCG designed and planned the project, as well as analyzed and interpreted the data.
REFERENCES
1. Behlau M, organizadora. Voz: o livro do especialista. vol. 1. Rio de Janeiro: Revinter; 2001.
2. Yamasaki R, Leão SHS, Madazio G, Padovani M, Azevedo R. Correspondência entre Escala Analógico-Visual e a Escala Numérica na Avaliação Perceptivo-Auditiva de Vozes. In: XVI Congresso Brasileiro de Fonoaudiologia e VIII Congresso Internacional de Fonoaudiologia; 2008 set 24-27; Campos do Jordão.
3. Oates J. Auditory-perceptual evaluation of disordered voice quality: pros, cons and future directions. Folia Phoniatr Logop. 2009;61(1):49-56. 4. Nemr K, Simões-Zenari M, Cordeiro GF, Tsuji D, Ogawa AI, Ubrig MT,
5. American Speech-Language-Hearing Association. Consensus auditory-perceptual evaluation of voice (CAPE-V). Rockville: ASHA Special Interest Division 3, Voice and Voice Disorders; 2002.
6. Zraick RI, Kempster GB, Connor NP, Thipeault S, Klaben B, Bursac Z, et al. Establishing validity of the Consensus Auditory-Perceptual Evaluation of Voice (CAPE-V). Am J Speech Lang Pathol. 2011;20:14-22. 7. Hirano M. Clinical examination of voice. New York: Springer-Verlag; 1981. 8. Silva RSA, Simões-Zenari M, Nemr NK. Impacto de treinamento auditivo na avaliação perceptivo-auditiva da voz realizada por estudantes de Fonoaudiologia. J Soc Bras Fonoaudiol. 2012;24(1):19-25. 9. Hawker GA, Mian S, Kendzerska T, French M. Measures of adult
pain: Visual Analog Scale for Pain (VAS Pain), Numeric Rating Scale for Pain (NRS Pain), McGill Pain Questionnaire (MPQ), Short-Form McGill Pain Questionnaire (SF-MPQ), Chronic Pain Grade Scale (CPGS), Short Form-36 Bodily Pain Scale (SF-36 BPS), and Measure of Intermittent and Constant Osteoarthritis Pain (ICOAP). Arthritis Care Res. 2011;63(S11):S240-52.
10. Rouve S, Didier A, Demoly P, Jankowsky R, Klossek JM, Annesi-Maesano I. Numeric score and visual analog scale in assessing seasonal allergic rhinitis severity. Rhinology. 2010;48(3):285-91.
11. Pires MDE, Oliveira G, Behlau M. Aplicação do protocolo de participação em atividades vocais - PPAV em duas diferentes escalas de resposta. J Soc Bras Fonoaudiol. 2011;23(3):297-300.
12. Chan K, Li M, Law T, Yiu E. Effects of immediate feedback on learning auditory perceptual voice quality evaluation. Int J Speech Lang Pathol. 2012;14(4):363-9.
13. Maryn Y, De Bodt M, Roy N. The Acoustic Voice Quality Index: toward improved treatment outcomes assessment in voice disorders. J Commun Disord. 2010;43(3):161-74.
14. Simberg S, Laine A, Sala E, Rönnemaa AM. Prevalence of voice disorders among future teachers. J Voice. 2000;14(2):231-5.
15. Yamasaki R, Leão SHS, Madazio G, Padovani M, Azevedo R. Análise perceptivo-auditiva de vozes normais e alteradas: escala analógica visual. In: XV Congresso Brasileiro de Fonoaudiologia e VII Congresso Internacional de Fonoaudiologia; 2007 out 16-20; Gramado.
16. Organização Mundial da Saúde. CIF: Classiicação Internacional de Funcionalidade, Incapacidade e Saúde. São Paulo: EDUSP; 2003. 17. Iwarsson J, Petersen NR. Effects of consensus training on the
reliability of auditory perceptual ratings of voice quality. J Voice. 2011;25(3):304-12.
18. Freitas SV, Pestana PM, Almeida V, Ferreira A. Audio-perceptual evaluation of Portuguese voice disorders - an inter and intra-judge reliability study. J Voice. 2014;28(2):210-5.
19. Costa FP, Yamasaki R, Behlau M. Inluência da escuta contextualizada na percepção da intensidade do desvio vocal. Audiol Commun Res. 2014;19(1):69-74.
20. Law T, Kim JH, Lee KY, Tang EC, Lam JH, van Hasselt AC, et al. Comparison of rater’s reliability on perceptual evaluation of different types of voice sample. J Voice. 2012;26(5):666.e13-21.
21. Lu FL, Matteson S. Speech tasks and inter-rater reliability in perceptual voice evaluation. J Voice. 2014;28(6):725-32.
22. Wuyts FL, De Bodt MS, Van de Heyning PH. Is the reliability of a visual analog scale higher than an ordinal scale? An experiment with the GRBAS scale for the perceptual evaluation of dysphonia. J Voice. 1999;13(4):508-17.
23. Behlau M, Oliveira G, Madazio G, Yamasaki R. Speech Language Pathology and the voice specialist in Brazil: an overview. In: Yui E., editor. International perspectives on voice disorders. Bristol: Multilingual Matters; 2013. p. 30-41.