Key words
Methodology; diagnosis; prognosis; meta-analysis; review literature.
Systematic Review and Meta-analysis of Diagnostic and Prognostic
Studies: a Tutorial
Marcos R. de Sousa
1,2e Antonio Luiz P. Ribeiro
1,2Serviço de Cardiologia do Hospital das Clínicas da Universidade Federal de Minas Gerais (UFMG)1, Programa de Pós-Graduação (Doutorado) em Clínica Médica da Faculdade de Medicina da Universidade Federal de Minas Gerais (UFMG)2, Belo Horizonte, MG - Brazil
Mailing address: Marcos R. de Sousa •
Rua Aristides Duarte, 39/601 - Barroca - 30410-040 - Belo horizonte, MG - Brazil
E-mail: [email protected]
Manuscript received January 01, 2008; revised manuscript received January 23, 2008; accepted Fabruary 14, 2008.
Summary
Systematic reviews with meta-analysis of studies on diagnostic tests or prognostic factors are research tools that are still being developed. The objective of the present paper is to describe the methodology of systematic review and meta-analysis of this type of studies, step by step. A literature review on the subject was made, the recommendations were compiled and the paper was organized in:
a) Introduction,
b) Details on the eight steps to be followed,
c) Form of publication of a systematic review with meta-analysis, and
d) Conclusion.
The systematic review methods were thoroughly described with a critical analysis of the methods of statistical compilation of results, with emphasis on the utilization of the Summary Receiver Operator Characteristic curve. References for the details of each statistical technique used were provided in the meta-analysis. We concluded that systematic reviews with meta-analysis of diagnostic tests or prognostic factors are useful in data compilation of various studies on the same subject, since they reduce biases and increase the statistical power of the primary research.
Introduction
A systematic review of the literature is a planned review of the scientific literature using systematic methods to identify, select and critically analyze relevant studies on a clearly formulated question. The purpose of the systematization is to reduce possible biases that would occur in a non-systematic review1, both for the biases observed in the form of a literature review and in the selection of manuscripts, and those detected by the critical analysis of each study. Meta-analysis is a statistical method used in systematic reviews to integrate the results of the
studies included and to increase the statistical power of the primary research2. Although some meta-analyses had been published in 1904 and 19552, the term meta-analysis was first used by Glass in 1976 to describe the statistical analysis of the results of analyses of many individual studies with the purpose of integrating their findings3. Sometimes the term meta-analysis is used as a synonym for systematic review, when the review includes meta-analysis4. Although occasionally used as synonyms, metanalysis and meta-analysis have different definitions. Metmeta-analysis is a linguistic resource that signifies the non-etymological breaking down of a word, locution or enunciation that was interpreted by the speakers in a meaning not original to it.
Studies on diagnostic and prognostic tests are old in the medical literature; however, the application of statistical methodology to diagnostic tests and prognostic evaluation tests was developed after its application in therapeutic studies5. Likewise, the standardization of the form of publication of diagnostic studies6 occurred almost a decade after the same process had occurred with therapeutic studies7. The main statistical concepts that are essential in the study of diagnostic methods and prognostic evaluation are listed in Figure 1 and will be used in the text that follows.
There are significant differences between meta-analyses of therapeutic intervention studies which have already been addressed in published handbooks, and meta-analyses of prognostic factors or diagnostic tests which are more recent and less standardized than the first ones8. Meta-analyses of studies comparing interventions or treatments usually include randomized studies with two similar groups assessing the same intervention, in general compared with placebo or with a conventional treatment. Meta-analyses of studies on prognostic factors or diagnostic tests, in turn, face different challenges, such as different cut-off points for the positive or negative result of a test, or assessment of tests that were performed in prospective studies for the analysis of therapeutic interventions. In the 1990’s, new statistical techniques of combination of studies on diagnostic tests were developed9-11. Since 1994, when a guideline for meta-analysis of studies on diagnostic tests12 was published, several different publications with criticisms and propositions on specific aspects of each stage of the process came up. The use of meta-analysis for diagnostic and prognostic tests is still being developed, but it has become increasingly more important1,3,8.
Figure 1 -Concepts and accuracy measurements of a diagnostic or prognostic test; Every clinical decision is based on probability, whether consciously or not; Diagnosis
tests can be used to evaluate the presence or absence of disease, to evaluate the severity of the clinical manifestations, to monitor the response to an intervention, and to estimate the prognosis; a - number of positive results (TP); b - number of false-positive results (FP); c - number of false-negative results (FN); d - number of true-negative results (TN); Speciicity (E) - probability of a true-negative test in non-diseased individuals; Sensitivity (S) - probability of a positive test in diseased individuals; Test accuracy: proportion of correct results; Negative predictive value (NPV) - probability of non-occurrence of disease in individuals who test negative; Positive predictive value (PPV) - probability of disease in individuals who test positive; p: in the formula of predictive values, it means prevalence of the disease in the population; Likelihood ratio of a positive test (LR+): measures how much more likely it is for a test to be positive in diseased individuals in comparison with non-diseased individuals; Likelihood ratio of a negative test (LR-): measures how much more likely it is for a test to be negative in diseased individuals in comparison with non-diseased individuals; True-positive rate (TPR) - total number of positive tests in diseased individuals; False-positive rate (FPR) - total number of positive tests in non-diseased individuals; ROC curve: Receiver Operator Characteristic curve. It is used to compare a test with a continuous result to the “gold-standard” or to an endpoint; It is a scatterplot where the y axis = sensitivity (TPR) and the x axis = 1-speciicity (FPR); The highest point in the north-west rectangle of the plot is the ideal point of test accuracy, with sensitivity = 100% and speciicity = 100%; DOR: diagnostic odds ratio – dificult to be clinically interpreted, but very useful from the statistical point of view in the assessment of the overall test accuracy and also very useful in meta-analysis, because it helps construct the sROC curve (summary ROC, pooled results of various studies in the form of an ROC curve).
Table 1 – Steps for systematic reviews and meta-analyses12,19
1. Deine clearly the question to be formulated.
2. Search all reliable studies addressing the question in different sources.
3. Select the studies by means of clear inclusion and exclusion criteria, and evaluate the quality of these studies.
4. Extract data from each study and display them clearly.
5. Evaluate heterogeneity among the studies.
6. Calculate the results of each study (and combine them, if appropriate), estimating diagnostic accuracy.
7. Assess the effect of variation in study validity on the estimates of diagnostic accuracy.
8. Interpret the results, assessing how much of the review and/or meta-analysis can be generalized according to the patients’ characteristics.
meta-analysis of diagnostic and prognostic studies. Next, we will review the steps necessary, as listed in Table 1.
Figure 2 -Article search and selection process6.
Search all the reliable studies addressing
the question in different sources
It is recommended that the search sources are widened as much as possible. Search in governmental publications, ethics commissions, abstracts in annals of congress, theses, and in electronic databases (MEDLINE, EMBASE, LILACS, etc.)3. In addition to the sources of study search, it is important to consult the Cochrane review library (www.bvs.br) in order to verify whether a given review has already been made. Even when unpublished data are not used, the contact with researchers of ongoing or unpublished studies may be important3. For MEDLINE database searching, specify clearly the literature search procedure with the search terms cited, with explicit inclusion and exclusion criteria12. The research method with search terms may interfere with the sensitivity of the systematic review14. It is important to search MeSH (Medical Subject Headings) descriptors, which is
the English vocabulary used for indexing articles (available at: http://www.ncbi.nlm.nih.gov/entrez/query.fcgi?db=mesh), to help in the research. The best strategy is usually obtained by the combination of the MeSH terms used with textwords14. For studies on prognostic markers, the association of the research subject with the terms (incidence[MeSH] OR mortality[MeSH] OR follow-up studies[MeSH] OR prognos*[Text Word] OR predict*[Text Word] OR course*[Text Word])14 is suggested in order to increase sensitivity. Make it clear how the literature review process was made (Figure 2).
Graph. 3 -Example of an inverted funnel or “Christmas tree” scatterplot; Each point in the plot represents a study with its diagnostic odds ratio and sample size; The shape of a symmetrical funnel suggests the absence of publication bias (in this case, an inverted funnel, also known as “Christmas tree”); It can be displayed with the order of the values in the vertical axis inverted, so it would assume a funnel shape; Asymmetry with study concentration in the right side (the side with higher values of diagnostic odds ratio) suggests publication bias, with less negative studies published.
To reduce the possibility of publication bias, the search sources should be widened as much as possible. A search method of therapeutic intervention studies that is difficult to be applied to diagnostic or prognostic test studies is to verifie the existence of studies registered, but not published, in ethics commissions or in governmental registers (for instance, www.clinicaltrials.gov), and look for their results16. Another source that can be used is abstracts from annals of congress, where studies presented but not published can be accessed17.
A statistical means of evaluating publication bias is the use of the funnel scatterplot, inverted funnel or “Christmas tree” (funnel plot)16. The premise of this plot is that sample size is the strongest correlate of publication bias3,15 (Graph 1). Symmetry may be objectively evaluated by means of statistical methods16. An asymmetrical shape suggests that there was publication bias, with a tendency of distribution of odds ratios to one side – usually the “more positive” side, since the “negatives” would not have been published.
Select studies by means of clear inclusion
and exclusion criteria, and evaluate the
quality of these studies
Ideally, two researchers should search and evaluate studies independently. The Kappa statistical test may be used to evaluate the agreement between two researchers. Explain how the disagreements between them were solved, which is usually done
by means of an arrangement and based on the opinion of a third experienced researcher. List the characteristics of each primary study and the results of each one clearly12. This task can be easier if the study was published according to the STARD (Standards for Reporting of Diagnostic Accuracy – www.consort-statement. org/stardstatement.htm) statement, which was formulated to ensure more clarity, methodological rigor, and the possibility of comparison between the studies of diagnostic methods18. Quality issues should be assessed (Table 2).
Extract data from each study and display
them clearly
Tables of study comparisons are very useful to analyze the clinical and methodological differences between the results (Table 2). Compare studies evaluating age and gender distribution, form of diagnosis or patient selection, relevant covariates, follow-up period, and sample size6. In order to obtain the data to be combined, collect the original false and true-positive, false and true-negative values. Occasionally, these data may be estimated from sensitivity and specificity values, as well as from the values of endpoint or reference test occurrence12.
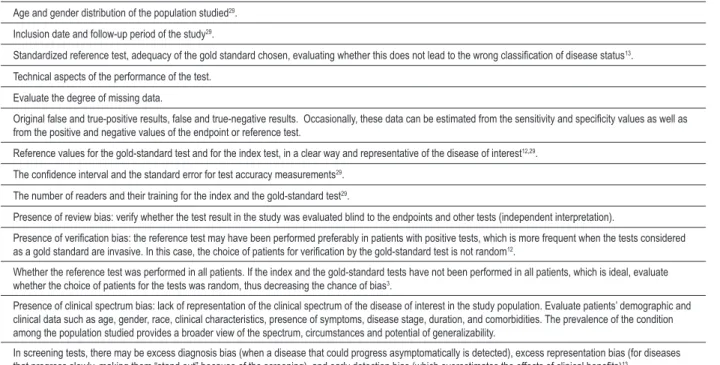
Table 2 – List of aspects to be checked in the assessment of diagnostic and prognostic studies during the systematic review and
meta-analysis
Age and gender distribution of the population studied29.
Inclusion date and follow-up period of the study29.
Standardized reference test, adequacy of the gold standard chosen, evaluating whether this does not lead to the wrong classiication of disease status13.
Technical aspects of the performance of the test.
Evaluate the degree of missing data.
Original false and true-positive results, false and true-negative results. Occasionally, these data can be estimated from the sensitivity and speciicity values as well as
from the positive and negative values of the endpoint or reference test.
Reference values for the gold-standard test and for the index test, in a clear way and representative of the disease of interest12,29. The conidence interval and the standard error for test accuracy measurements29.
The number of readers and their training for the index and the gold-standard test29.
Presence of review bias: verify whether the test result in the study was evaluated blind to the endpoints and other tests (independent interpretation).
Presence of veriication bias: the reference test may have been performed preferably in patients with positive tests, which is more frequent when the tests considered as a gold standard are invasive. In this case, the choice of patients for veriication by the gold-standard test is not random12.
Whether the reference test was performed in all patients. If the index and the gold-standard tests have not been performed in all patients, which is ideal, evaluate whether the choice of patients for the tests was random, thus decreasing the chance of bias3.
Presence of clinical spectrum bias: lack of representation of the clinical spectrum ofthe disease of interest in the study population. Evaluate patients’ demographic and clinical data such as age, gender, race, clinical characteristics, presence of symptoms, disease stage, duration, and comorbidities. The prevalence of the condition among the population studied provides a broader view of the spectrum, circumstances and potential of generalizability.
In screening tests, there may be excess diagnosis bias (when a disease that could progress asymptomatically is detected), excess representation bias (for diseases
that progress slowly, making them “stand out” because of the screening), and early detection bias (which overestimates the effects of clinical beneits)13.
• Why did the results vary among the studies? • Was variation random?
• Was variation caused by methodological differences? To answer these questions, methodological and statistical criteria for the assessment of heterogeneity are required.
Methodological criteria refer to the form of selection, design and comparison of the clinical characteristics of the patients included in each study. Tables demonstrating these aspects are necessary to enable comparison between the studies and should be explicit in the systematic review. From the methodological point of view, the sources of heterogeneity among the studies are many: random, design differences, the form of patient selection, differences in the therapeutic interventions used, and how the tests were evaluated19. Another cause of significant heterogeneity that is exclusive of diagnostic and prognostic test studies is the variation in the cut-off points for the reference values of the index test. Heterogeneity may exist even in randomized studies for therapeutic interventions because the randomization was not focused on the index test but rather on the therapeutic intervention. Retrospective studies are weakened because of their risk of selection bias. Verification bias (ascertainment bias, work-up bias) occurs when the indication of the gold-standard test is influenced by the result of the index test: for instance, when the probability of undergoing coronary angiography (“gold standard”) is greater among those with a positive exercise test than among those with a negative test. The analysis of the index test should ideally be blinded to other tests and to the endpoint. The bias caused by the spectrum of disease stages (spectrum bias) leads to variations
in the sensitivity and specificity of the index test due to the comparison of populations in different stages of the same disease: some studies with the majority of the patients in a mild and initial stage and other studies with patients in advanced stages of the disease19. The methodological aspects to be evaluated are shown in Table 2. The methods used to analyze the statistical heterogeneity of the studies will be addressed in the next topic, with the explanation of the form of combination (meta-analysis) of study results.
Calculate the results by means of
meta-analysis, estimating diagnostic accuracy
Using meta-analysis, it is possible to provide a pooled summary of the diagnostic accuracy (Table 3). In the electronic address http://www.hrc.es/investigacion/metadisc_en.htm a free software20 for the performance of meta-analysis of diagnostic or prognostic tests can be found. Other software and specialized programs using a binomial regression model approach based on the likelihood ratio and on the Bayes theorem are available in the electronic address www.mrc-bsu.cam.ac.uk/bugs/13. These software and specialized programs permit the evaluation of covariates influencing the test accuracy.
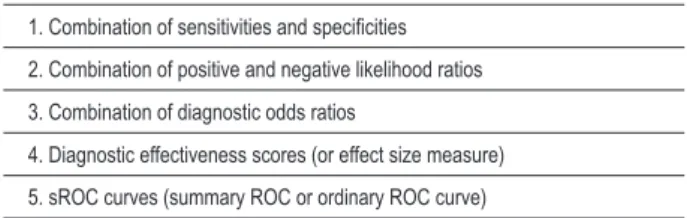
Table 3 – Forms of summarizing test accuracy by means of meta-analysis
1. Combination of sensitivities and speciicities
2. Combination of positive and negative likelihood ratios
3. Combination of diagnostic odds ratios
4. Diagnostic effectiveness scores (or effect size measure)
5. sROC curves (summary ROC or ordinary ROC curve)
if the fixed effects method considered that the variability among the studies resulted only from chance and ignored the heterogeneity among them15. On the other hand, the random effects methods incorporate a little bit of the heterogeneity among the studies in the results. Thus, they generate combined results with a greater confidence interval. Despite having this advantage and being more frequently recommended, random effects methods are criticized for giving greater weight to smaller studies15.
Given that in diagnostic test studies it is very common that the variability of results does not result merely from chance, since variability may be explicitly or implicitly caused by variation of the cut-off point, the variability estimates provided by the random effects model are particularly important10. Using random effects methods more frequently, the forms of meta-analysis of studies on diagnostic tests or prognostic factors are shown in Table 3. For each one of the methods, we will also discuss how to evaluate heterogeneity among the studies.
Combination of sensitivities and speciicities
The methods used for statistical combination of sensitivities and specificities of the studies are the same as those used for comparison of proportions. Sensitivity and specificity of the studies are combined in an integrated value of all studies (pooling) by the simple or weighted mean (by sample size or inverse variance of each study). In meta-analyses of diagnostic and prognostic studies, it is very common for authors to integrate the sensitivities and specificities obtained in each study. However, this is frequently inappropriate because of the difference of threshold or cut-off point of the index test, whether explicitly or implicitly6. There is a dependence relationship between the cut-off point and the sensitivity and specificity. An example of explicit variation in the cut-off point is when two different studies defined different and explicit cut-off points in the study to determine whether the test was positive or negative. Implicit variation, in turn, would occur, for instance, when the test is performed in studies with population differences that determine different sensitivities and specificities19. These implicit or explicit differences among the studies are called “threshold effect”. This effect may be evaluated using the Spearman’s correlation between the sensitivity and specificity found in the different studies included. When a “threshold effect” occurs, there is usually a strong and inverse correlation21. If sensitivity increases, specificity usually decreases. When sensitivity and specificity are mathematically integrated (pooling), it is necessary to use a method that takes this interdependency between sensitivity and specificity into consideration7. In addition to the fact that
diagnostic thresholds affect the test accuracy, it is important to observe if it is only the thresholds or also methodological problems of the study that determine the accuracy variation7. The evaluation of the statistical heterogeneity of sensitivity and specificity values obtained in the different studies may be carried out by means of the Mann-Whitney U test, Z test, meta-regression or logistic regression models19, as well as with the χ2 test on k-1 degrees of freedom (where k is the number of studies included). Because of all the problems mentioned, sensitivity and specificity combinations are seldom appropriate manners of combining results.
Combination of positive and negative likelihood ratios
The likelihood ratio of a positive test (LR+) measures how much more likely it is for diseased individuals to test positive than non-diseased individuals. The likelihood ratio of a negative test (LR-) measures how much more likely it is for diseased individuals to test negative than non-diseased individuals (Figure 1). Methods of combination of likelihood ratios may be fixed effects methods, such as Mantel-Haenszel or inverted variance, and more frequently random effects methods, such as the DerSimonian and Laird method. The analyses use combinations of likelihood ratios after having applied a log-transform19. The combined likelihood ratio has the advantage of permitting the analysis of tests whose result is a continuous variable or with many categories, thus avoiding loss of information when the variable is dichotomized. Another advantage is that, once the test is positive, the post-test odds of the disease may be calculated by the formula: post-test odds = pre-test odds x likelihood ratio12. Odds should be converted to probability (c=p/1-o and p=o/1+o – where o expresses odds and p expresses probability). So, the post-test probability= post-test odds/(post-test odds + 1) (http://www. cebm.net/index.aspx?o=1043).
Heterogeneity of results of likelihood ratio of the different studies may be evaluated by means of univariate tests, z tests and χ2 test. An interesting method for the evaluation of heterogeneity is the Cochrane’s Q (Q = Σwi(θi – θ)
2, where w i is the weight given to the study in the meta-analysis (by sample size, inverse variance, or size of variance), θ is the log mean likelihood ratio, and θi is the estimate of the log likelihood ratio for each study)19. The Q value will follow a χ2 distribution under the hypothesis that the likelihood ratio is the same for all studies. Another heterogeneity measurement that can be obtained from this Q value is the I2 statistic, which is called inconsistency measure and is estimated by the formula:
Diagnostic odds ratio
The diagnostic odds ratio is a statistical combination of sensitivity, specificity, and positive and negative likelihood ratios. It is not easy to to apply in clinical practice, but it is useful for several reasons:
a) It is a statistical measurement of the overall test accuracy;
b) It can be easily obtained from the cross-product of the 2 x 2 table (Figure 1);
c) It is frequently constant, despite the cut-off point used for the test in the different studies;
d) It is useful in the construction of the sROC curve confidence interval, as described below23.
It also expresses the positive likelihood ratio divided by the negative likelihood ratio. The diagnostic odds ratios of each study may be combined by means of fixed effects methods such as Mantel-Haenszel, and random effects methods (DerSimonian and Laird)23. In epidemiological studies for risk factors of rare or uncommon diseases, the value of the odds ratio is close to that of the relative risk. In the case of diagnostic studies, the odds ratios are generally numerically different from the relative risk because positive results are not rare events13.
Diagnostic effectiveness score
The effectiveness score quantifies the degree of overlap of results between diseased and non-diseased individuals, and can be interpreted as the number of standard deviations separating the mean between two distribution curves (diseased and non-diseased individuals, for instance) from results that behave as a continuous variable. It can be obtained by means of a specific calculation formula or from the diagnostic odds ratio23,24. It is the measurement of the standardized distance between the means of two populations - also known as effect size measure or effectiveness measure, which can also be evaluated by means of fixed or random effects models17. It is a quantitative measurement that can be used to compare diagnostic methods or to summarize study outcomes in meta-analyses. For further details on how to obtain it, we suggest Hasselblad and Hedges’ study24, which reviews the method. Like the sROC curve described below, the effectiveness score provides a description of the separation of two distributions of test results (between diseased and non-diseased individuals), regardless of the form of result distribution.
Ordinary or summary ROC curves – sROC curves
Scatterplots can be used to evaluate heterogeneity among the studies. The scatterplot in the ROC space displays the studies in the TPR vs FPR axes (Figure 1). We should note that the ROC curve was created for test results that behave as a continuous variable. However, in this case, each point is the combined result of TPR and FPR of each study. If the studies used different cut-off points, the choice is expected to determine a higher or lower sensitivity. Or else, if the sensitivity and specificity of the studies varied due to implicit causes, influenced by other covariates11, the studies are presumed to supplement each other to illustrate the
diagnostic accuracy of the test in different spectra of clinical forms or populations. If in this plot a curvature similar to an ROC curve appears when the points representing the studies are connected, then the difference between the studies is most likely caused by the cut-off point of the reference test value. This is another form of evaluation of the threshold effect19. Mild differences can result from chance, but other types of biases (selection, design, etc.) would presumably increase the variability observed and cause a more scattered configuration of the study representation19. The forest plots and the Galbraith plot also make the visualization of the heterogeneity among studies easier19. Thus, by presenting the studies in graphs or observing the results distribution in the ROC space, an idea of heterogeneity is provided. Additionally, after this evaluation of heterogeneity, the ROC space can be used to construct an adjusted curve that combines (meta-analysis) the study outcomes - the sROC curve as described below.
The sROC curve (ordinary or summary ROC curve) is the estimate of an ordinary ROC curve adjusted for the study outcomes in the ROC space12. The sROC curve is recommended to evaluate the accuracy of a diagnostic test, based on data from a meta-analysis25. We point out the sROC curve as the best option of meta-analysis when there is variation in the cut-off point of the reference test value or when there are implicit or explicit variations in the studies that generate sensitivity and specificity differences13,19,23 (Graph 2). Due to these variations frequently found in this type of study, the mean sensitivity and specificity of the different studies do not reflect the test accuracy adequately13.
The curve can be obtained from the diagnostic odds ratio (described in section “Diagnostic odds ratio”), considering the magnitude of heterogeneity among the studies. The overall diagnostic odds ratio is very robust for heterogeneity and is homogeneous when it does not suffer variations related to the cut-off point of the index test25. The margin of standard error of the curve is adequate when the studies are homogeneous, and was proven to be a reasonable approximation for heterogeneous studies25.
Graph. 2 -Hypothetical sROC curve; The sROC curve shows the study distribution (each study is a point in the scatterplot) maintaining the interdependency relationship between sensitivity and speciicity, which varies according to the cut-off limit, whether implicitly or explicitly.
the construction of the linear regression model that precedes the ROC curve. The best option is to construct both curves (one with weighted models and the other not including the variance and n weight) and compare them13. Despite these limitations and theoretical questions, the area under the sROC curve is one of the most robust and useful methods to summarize diagnostic studies data.
As an alternative to globally evaluate the test summarizing the sROC curve, the summary Q measurement is suggested, which evaluates the point of the sROC curve where sensitivity equals specificity. The Q value is invariant to heterogeneity and is quite robust25. It is equivalent to the point of symmetry of the ROC curve13. The Q measurement, with values between 0.5 and 1.0 (the greater the better), is a global measurement of test efficacy11. This summary measure shows how much closer to the north-west rectangle the “curve shoulder” is11. If lower than or equal to 0.5, the test does not contribute to the evaluation, and the closer to 1.0, the better the test accuracy13. Like the area under the curve, it also evaluates test efficacy globally. If at least ten studies are evaluated, Q distribution is Gaussian (normal)23. The Q value can be used to compare methods or verify biases, separating studies with methodological problems in subgroups and comparing their Q values with those of other study subgroups23. The standard error of the AUC and the Q standard error are numerically close25. When the confidence interval of the Q value or of the AUC cross 0.5, the test does not present a significant performance and does not contribute to the evaluation of the disease.
Assess the effect of variation in study
validity on the estimates of diagnostic
accuracy
When assessing the internal and external validity of each study and of the combined results, it is necessary to decide how to deal with the heterogeneity found. There are four options to deal with heterogeneity among studies and interpret results variations:
1) Ignoring heterogeneity and using fixed effects methods;
2) Using statistical tests of heterogeneity (which have low sensitivity) and not combining results if heterogeneity is present;
3) Incorporating heterogeneity by using random effects methods; or
4) Explaining the differences by means of analyses of study subgroups or meta-regression, including covariates in the analysis.
the same technique described27. In this manner, it is possible to identify areas for further research12.
For instance, a subgroup of studies presents verification bias (when only the test-positives plus the test-negatives with clinically suspected disease undergo the gold-standard method), which frequently underestimates the test. Another subgroup of studies presents review bias (for not evaluating the test blind to the other tests and to endpoints), which tends to overestimate the test. Pooling these studies in quality scores is not always appropriate. They can be analyzed separately by type of methodological flaw, by analyzing how the flaw affects the test accuracy27. Thus, the results of overall accuracy measurements can be compared in each subgroup. As such, the effect of the variation of patients and test characteristics on estimates of accuracy can also be assessed12.
In comparative meta-analysis of tests, it is fundamental that the tests have been applied to the same patients, or at least that the patients have been randomized to receive each test12. However, most of the times, it is unfeasible or unethical to perform all tests or invasive tests in all patients, and this issue is controversial28. In the comparison of tests, there are techniques for the construction of sROC curves of the tests alone or in combination, evaluating whether the combination of tests increases the diagnostic or prognostic accuracy13,29.
Interpret the results assessing how much
of the meta-analysis can be generalized
according to the patients characteristics
Assess how much the results can be generalized according to the clinical characteristics of the patients studied in comparison with the target population in which the meta-analysis was applied, or the relationship between the test accuracy and the year of publication12. Decide on possible applications in specific populations. Additionally, generating new hypotheses to be tested is an important contribution.
Comments on the form of publication of the
meta-analysis
By analogy with the Quality of Reporting of Meta-analysis (QUOROM)6 conference for publication of meta-analyses of studies on therapeutic intervention, the methodology should be thoroughly described when publishing the results of meta-analysis of diagnostic and prognostic studies, and each phase of the process should be explicit18. The title should identify the study as a meta-analysis or systematic review. The summary should be structured with description of the following aspects: the clinical question, the sources and database, the methods of review and selection of the literature and of quantitative synthesis of the data in a reproducible form, the results with estimates and confidence intervals, and the conclusion with the main results. The introduction should
contextualize and provide the background to the objective. The methodology should give details on the sources and search strategies, the period and language, criteria of study selection, form of assessment of publication bias, assessment of quality and methodological validity of the studies, the form of data extraction ideally by two researchers, the study characteristics, the form of assessment of heterogeneity, and the form of mathematically summarizing data. The results should present the review flow according to Figure 2, the study characteristics29,30 assessing age and gender distribution, form of diagnosis of patient selection, relevant covariates, follow-up period, sample size6 (Table 2), and the estimates of diagnostic or prognostic accuracy with the respective confidence intervals. In the discussion, summarize the key issues, discuss the clinical inferences based on the internal and external validity, interpret the results in light of all the evidences, describe the limitations and potential biases - especially publication bias - and suggest further studies6.
Conclusion
Systematic reviews of the literature of a clearly formulated question, with a well-planned article search and selection technique, are extremely useful tools in research on diagnostic or prognostic methods. In some cases, it is possible to compile data by means of statistical techniques, thus increasing the power of the estimates of diagnostic accuracy of the test in the primary research. By means of the critical analysis of biases, these techniques provide information that may be useful for the clinical practice and for the formulation of questions to be tested in further studies.
Acknowledgement
The authors thank Prof. Carisi A. Polanczyk, from
Universidade Federal do Rio Grande do Sul, for text review
and suggestions.
This study was partially funded by Conselho Nacional de desenvolvimento Científico e Tecnológico (CNPq) and
by Coordenação de Aperfeiçoamento de Pessoal de Nível
Superior (Capes).
Potential Conflict of Interest
No potential conflict of interest relevant to this article was reported.
Sources of Funding
This study was partially funded by CNPq and CAPES.
Study Association
References
1 Halligan S. Systematic reviews and meta-analysis of diagnostic tests. Clin Radiol. 2005; 60 (9): 977-9.
2 Sacks HS, Reitman D, Pagano D, Kupelnick B. Meta-analysis: an update. Mt Sinai J Med. 1996; 63 (3-4): 216-24.
3 Zhou A, Obuchowski N, McClish D. Issues in meta-analysis for diagnostic tests. In: Zhou A, Obuchowski N, McClish D, eds. Statistical methods in diagnostic medicine. New York: Wiley & Sons, Inc; 2002. p. 222-40.
4 Alderson P GS, Higgins JPT (eds.). Cochrane Reviewers’ Handbook 4.2.2 updated March 2004. Chichester, UK: John Wiley & Sons, Inc; 2004.
5 Knottnerus JA. The evidence base of clinical diagnosis. London: BMJ Publishing Group; 2002.
6 Moher DCD, Eastwood S, Olkin I, Rennie D, Stroup DF, for the QUOROM Group*. Improving the quality of reports of meta-analyses of randomised controlled trials: the QUOROM statement. Lancet. 1999; 354: 1896-900.
7 Begg C, Cho M, Eastwood S, Horton R, Moher D, Olkin I, et al. Improving the quality of reporting of randomized controlled trials: the CONSORT statement. JAMA. 1996; 276: 637-9.
8 Higgins JPT, Green S (eds). Cochrane Handbook for Systematic Reviews of Interventions 4.2.6 updated September 2006. Chichester: John Wiley & Sons, Inc; 2006.
9 Velanovich V. Meta-analysis for combining Bayesian probabilities. Med Hypotheses. 1991; 35 (3): 192-5.
10 Littenberg B, Moses LE. Estimating diagnostic accuracy from multiple conflicting reports: a new meta-analytic method. Med Decis Making. 1993; 13 (4): 313-21.
11 Moses LE SD, Littenberg B. Combining independent studies of a diagnostic test into a summary ROC curve: data-analytic approaches and some additional considerations. Stat Med. 1993; 12 (14): 1293-316.
12 Irwig L, Tosteson AN, Gatsonis C, Lau J, Colditz G, Chalmers TC, et al. Guidelines for meta-analyses evaluating diagnostic tests. Ann Intern Med. 1994; 120 (8): 667-76.
13 Pepe MS. The statistical evaluation of medical tests for classification and prediction. New York: Oxford University Press Inc; 2003.
14 Wilczynski NL, Haynes RB, Hedges Team. Developing optimal search strategies for detecting clinically sound prognostic studies in MEDLINE: an analytic survey. BMC Med. 2004; 2: 23.
15 Moayyedi P. Meta-analysis: can we mix apples and oranges? Am J Gastroenterol. 2004; 99 (12): 2297-301.
16 Egger M, Smith GD. Bias in location and selection of studies. BMJ. 1998; 316:
61-6.
17 Vaitkus PT, Brar C. N-acetylcysteine in the prevention of contrast-induced nephropathy: publication bias perpetuated by meta-analyses. Am Heart J. 2007; 153 (2): 275-80.
18 Bossuyt PM, Reitsma JB, Bruns DE, Gatsonis CA, Glasziou PP, Irwig LM, et al. The STARD statement for reporting studies of diagnostic accuracy: explanation and elaboration. The Standards for Reporting of Diagnostic Accuracy Group. Croat Med J. 2003; 44 (5): 639-50.
19 Dinnes J, Deeks J, Kirby J, Roderick P. A methodological review of how heterogeneity has been examined in systematic reviews of diagnostic test accuracy. Health Technol Assess. 2005; 9 (12): 1-113, iii.
20 Zamora J, Abraira V, Muriel A, Khan K, Coomarasamy A. Meta-DiSc: a software for meta-analysis of test accuracy data. BMC Med Res Methodol. 2006; 6: 31.
21 Devillé WL, Buntinx F, Bouter LM, Montori VM, de Vet HC, van der Windt DA, et al. Conducting systematic reviews of diagnostic studies: didactic guidelines. BMC Med Res Methodol. 2002; 2: 9.
22 Higgins JP, Thompson SG, Deeks JJ, Altman DG. Measuring inconsistency in meta-analyses. BMJ. 2003; 327: 557-60.
23 Zhou A, Obuchowski N, McClish D. Statistical methods for meta-analysis. In: Zhou A, Obuchowski N, McClish D (eds). Statistical methods in diagnostic medicine. New York: John Wiley & Sons, Inc; 2002. p. 396-417.
24 Hasselblad V, Hedges LV. Meta-analysis of screening and diagnostic tests. Psychol Bull. 1995; 117 (1): 167-78.
25 Walter SD. Properties of the summary receiver operating characteristic (SROC) curve for diagnostic test data. Stat Med. 2002; 21 (9): 1237-56.
26 Rutter CM, Gatsonis CA. A hierarchical regression approach to meta-analysis of diagnostic test accuracy evaluations. Stat Med. 2001; 20: 2865-84.
27 Irwig LMP, Glasziou P, Fahey M. Meta-analytic methods for diagnostic test accuracy. J Clin Epidemiol. 1995; 48 (1): 119-30.
28 Kertai MD, Boersma E, Bax JJ, Heijenbrok-Kal MH, Hunink MG, L’Talien GJ, et al. A meta-analysis comparing the prognostic accuracy of six diagnostic tests for predicting perioperative cardiac risk in patients undergoing major vascular surgery. Heart. 2003; 89 (11): 1327-34.
29 Rutjes AW, Reitsma JB, Di Nisio M, Smidt N, van Rijn JC, Bossuyt PM. Evidence of bias and variation in diagnostic accuracy studies. CMAJ. 2006; 174 (4): 469-76.