Childhood anemia prevalence and associated
factors in Salvador, Bahia, Brazil
Prevalência e fatores associados
à ocorrência da anemia em pré-escolares
na cidade de Salvador, Bahia, Brasil
1 Escola de Nutrição, Universidade Federal da Bahia, Salvador, Brasil. 2 Instituto de Saúde Coletiva, Universidade Federal da Bahia, Salvador, Brasil. 3 Faculdade de Ciências da Saúde, Universidade de Brasília, Brasília, Brasil.
Correspondence A. M. O. Assis Escola de Nutrição, Universidade Federal da Bahia. Rua Araújo Pinho 32, Salvador, BA 40110-150, Brasil [email protected]
Ana Marlúcia O. Assis 1 Mauricio L. Barreto 2
Gecynalda Soares da Silva Gomes 1 Matildes da Silva Prado 1
Nedja Silva dos Santos 1 Leonor Maria Pacheco Santos 3 Lílian Ramos Sampaio 1 Rita de Cássia Ribeiro 1
Lucivalda Pereira Magalhães de Oliveira 1 Valterlinda Alves de Oliveira 1
Abstract
A cross-sectional study was conducted in 1996 to estimate the prevalence of anemia in a stratified sample of 603 preschool children and identify factors associated with the disease. Hemoglobin assays were conducted in finger-prick blood samples using a Hemocue hemoglobinometer. Anemia was defined as hemoglobin below 11.0g/dl. Logistic regression analysis was used to evaluate the potential associations. Observed anemia prevalence was 46.3%. Associated fac-tors were: the 6-12-month and 12-24-month age brackets, the lowest tertiles for iron density and protein content dietary intake, and any degree of deficit in the height-for-age anthropometric pa-rameter. Inadequate physical, sanitary, and en-vironmental conditions in the home were asso-ciated with a significantly increased risk of ane-mia. Anemia constitutes an important health problem in this study’s child population. Im-provements in living conditions and dietary quality could contribute to a reduction in ane-mia prevalence.
Anemia; Preschool Child; Logistic Models
Introduction
Anemia is a highly frequent disease worldwide. It affects individuals in all stages of life, although preschool children and pregnant women are the most heavily affected. The highest prevalence rates are observed in these two groups in under-developed countries, but these rates are also high in developed countries 1.
Although there are no population-based da-ta to characterize the distribution and magni-tude of anemia in Brazil, studies from repre-sentative samples of population segments in various areas of the country 2,3indicate that
anemia is highly prevalent among preschool children. This period of life is characterized by rapid growth, which increases the demand for iron; if the micronutrient balance becomes neg-ative, the disease can develop 4. Various factors
are associated with the occurrence of anemia, amongst which genetic causes, parasitic and infectious diseases, and other micronutrient deficiencies, in addition to low consumption of iron-rich food and high intake of iron absorp-tion inhibitors or iron-chelating substances 5.
Inadequate social and economic conditions for the child and family are particularly important factors 6. However, the evidence indicates that
if anemia prevalence is high, the most proba-ble cause is dietary iron deficiency 5. Thus, at
Considering anemia’s negative effects on preschool physical growth, psychomotor devel-opment, and learning 1, as well as on the immune
system’s response capacity 5, this study was
planned to identify the anemia prevalence and factors associated with the disease in a represen-tative sample of preschool children in the city of Salvador, Bahia, Brazil. The results of this study may contribute for the definition of measures to combat the disease in the pursuit of an adequate child health and nutrition.
Population and method
Study design and population
The study included 603 preschool children from the city of Salvador, part of a larger investigation that was planned to evaluate the nutritional status and living conditions in this population segment 7.
The sample size in this study was estimated on the basis of a 20% prevalence rate for ane-mia. Thirty census tracts were selected 8,
distrib-uted randomly among the four zones in which the city was mapped, according to the Living Conditions Index proposed by Paim 9. In each
census tract, sixty households were visited and approximately six hundred children were se-lected, one in each household, including an ad-ditional 5% to cover occasional losses. A three-stage cluster sampling strategy was thus adopt-ed in which the census tract was the primary selection unit, the household was the secondary unit, and the child was the tertiary unit.
Data collection
Data collection was performed from October to November 1996 by trained interviewers and supervised by the researchers. The information was provided by the child’s mother or guardian.
Laboratory assessment
Blood samples were taken by the finger prick technique, using disposable lancets. A portable hemoglobinometer (Hemocue, Laguna Hills) 5
was used to determine the hemoglobin concen-tration. A second measurement was performed when the hemoglobin level was < 9g/dl, and the mean of the two measurements was adopt-ed as the final value.
Food consumption
Information on 24-hour food intake relates to the period from Tuesday through Saturday, thus
avoiding recording weekend food consump-tion, which normally does not reflect the daily diet 10. An album with drawings of foods and
standard measurements of liquids was used for the interviewer to recall the size of the portions served 11. This information was processed
us-ing Virtual Nutri, version 1.
Anthropometric data
The children were weighed unclothed or using a minimum of clothing, with a microelectronic scale (Fillizola), provided on loan by the former Brazilian National Institute of Food and Nutri-tion. The children’s length and height were measured, respectively, with a portable wood-en infantometer and stadiometer 12. Variations
of 100g and 0.1cm were accepted, respectively, for weight and length/height. The date of birth was recorded from the birth certificate and birth weight from the child’s or maternity hos-pital’s card. Anthropometric measurements were standardized as recommended by the World Health Organization (WHO) 12.
Socioeconomic and environmental data
These data relate to the family’s social and en-vironmental conditions and the household’s physical conditions and sanitation.
Reported morbidity
The morbidity pattern was based on the symp-toms and/or complaints reported by the mother and/or guardian and relates to the two weeks prior to the interview. Hospital admissions for any reason refer to the 12 months prior to the in-terview.
Ethical aspects
The child’s inclusion in the study was condi-tioned on the mother or guardian’s verbal con-sent. Any diagnosis of anemia and severe mal-nutrition was communicated immediately to the mother or guardian, and the child was re-ferred to the health service for pediatric treat-ment and also to the Nutrition Service of the Health Unit belonging to the Program for Treat-ment of the Malnourished.
Data analysis
Anemia was defined in children from 6 to 72 months of age as hemoglobin < 11.0g/dl 5. Due
of age, which is accepted in clinical practice 13.
Hemoglobin ≥11.0g/dl was considered normal. This classification was used in the logistic re-gression analysis, and the variable was adopted as dependent. To describe the event in the pop-ulation, anemia was further classified as mild/ moderate (hemoglobin from 9.5 to 10.9g/dl) and severe (< 9.5g/dl).
Key explanatory variables included the height-for-age and weight-for-age anthropo-metric indicators. This study used the cutoff point of < -1SD from the population reference mean of the National Center for Health Statis-tics (NCHS) 14to characterize an
anthropomet-ric deficit and ≥-1SD to characterize eutrophy. The aim was thus to identify the association between anemia and any degree of malnutri-tion, and not merely the severe and moderate forms. The authors agree with the concern ex-pressed by WHO experts 15, that the
identifica-tion of determinants of childhood malnutriidentifica-tion should focus on defining measures to best im-prove children’s health and nutritional condi-tions, and that the most important impact of these measures occurs when all children at risk of malnutrition are contemplated, rather than only those whose malnutrition is situated < -2SD from the z-score, the accepted cutoff point for identifying severe and moderate malnutrition and for defining measures to treat malnour-ished children. In addition, the impact of mal-nutrition on mortality is not limited to the se-vere and moderate forms. The mild form makes a major contribution to mortality 16, and its
at-tributable risk is 46.0% to 93.0% for preschool children in poor countries 17.
This range of variables also includes those related to household physical conditions (type of flooring, walls, and number of rooms), envi-ronmental and sanitary conditions (source of drinking water, forms of garbage storage, type of sewerage, and toilet facilities), and health/ sanitary conditions of the environmental perido-mestic. These variables constituted an index adapted to the Issler & Giugliani model 18, built
by the sum of the points for each variable and grouped in tertiles.
As a further condition associated with the family environment, the model considered the number of inhabitants per bedroom, classified as 1 to 2 (taken as the reference) as compared to the other categories (3 to 4; 5 to 6; and > 6), interpreted as increasing risk.
The dietary variables are represented by di-etary calories (classified in quartiles), by the amount of iron and protein categorized in ter-tiles, and by dietary iron density, which was calculated by dividing the amount of this
mi-cronutrient per 100kcal of the diet and subse-quently classified in tertiles.
The head-of-family’s age was categorized as 14 to 25; 25 to 65; and > 65 years. The 25 to 65 year age bracket was taken as the reference. The child’s age was categorized based on the critical periods for anemia and for changes in eating patterns (0 to 6, 6 to 12, 12 to 24; and 24 to 60 months, with 0 to 6 months as the refer-ence). Male gender was taken as protective for both children and heads of family.
Birth weight was classified as < 2500g and ≥
2500g (reference) and morbidity and hospital-ization was categorized as 0 and 1. Whenever indicated the variables were transformed into their respective dummies.
Considering that the sampling design for this study involved a three-stage cluster struc-ture, a weighting of the statistical analysis was adopted to incorporate the clustering effect in the inferences and standard error of the esti-mates and to designate the relative importance of the elements in the sample population 19.
For weighting purposes, the sample weight was adopted, which was calculated as the inverse of the probability of the child being selected.
The EpiInfo CSAMPLEmodule was used to estimate prevalence. Logistic regression was adopted to evaluate the associations of inter-est. Backward-type regression was used for se-lection of variables. A 20% significance level was used to introduce the variable in the mod-el and a 5% levmod-el was used to maintain the vari-able in the model. The Stata program was used for these procedures.
Results
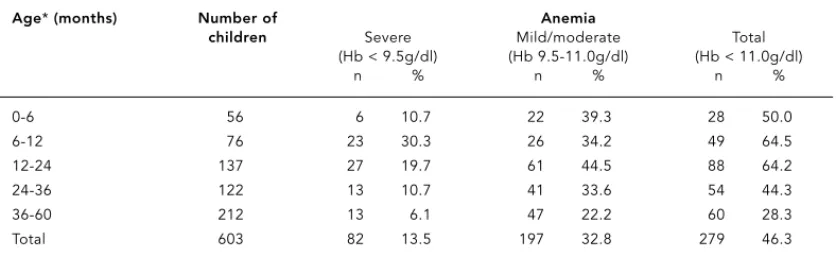
The hemoglobin measurement performed in 603 preschool children led to the diagnosis of 46.3% (95%CI: 42.3%-50.3%) as anemic, with a differentiated distribution according to age (p < 0.001). Anemia was less frequent in children from 0 to 6 months, increased from 6 to 24 months, and dropped again progressively with age. Severe anemia (hemoglobin < 9.5g/dl) was identified in 13.5% of the children in the sample (Table 1).
heads of family 25 to 65 years of age (OR = 0.37; 95%CI: 0.17-0.79).
A dietary iron density of ≤0.4mg/100kcalth
conferred an odds ratio of 1.69 (95%CI: 1.11-2.56) for the child to present anemia as com-pared to > 0.6 mg/100kcalth. Furthermore, the
odds of anemia were 1.53 (95%CI: 1.02-2.30) when iron consumption was located in the lowest tertile (≤4.2mg/day), as compared to the highest tertile (≥7.3mg/day).
Mean daily protein intake ≤28.8g conferred an increased risk of anemia (OR = 1.53; 95%CI: 1.05-2.23), as compared to a protein intake of greater than 44.6g/day.
Table 3 shows the adjusted parameters in the logistic regression model for anemia. After adjusting the model, it was observed that the risk of anemia by age was increased and that children from 6 to 12 months of age showed an increased risk (OR = 5.35; 95%CI: 1.73-16.58) as compared to those in the 12 to 24 month bracket (OR = 4.78; 95%CI: 1.97-11.57). Children whose dietary iron density was ≤0.4mg/100kcalthhad
a 3.11 greater odds of anemia (95%CI: 1.13-8.58) than those whose iron density was > 0.6mg/ 100kcalth. Likewise, a protein intake of ≤28.8g
led to 2.35 odds of anemia (95%CI: 1.10-5.02) as compared to the highest tertile in the distri-bution (> 44.6g/dia).
After adjusting the model, children whose height-for-age index was below -1 z-score had an increased odds of developing anemia as com-pared to those with the index greater than or equal to -1 z-score (OR = 2.19; 95%CI: 1.07-4.45). Finally, the odds of the child presenting ane-mia increased as the household physical, envi-ronmental, and sanitary conditions became more precarious. Children living in households with only “fair” physical, environmental, and
sanitary conditions had odds of 1.70 (95%CI: 1.10-2.61) of presenting anemia. The odds in-creased to 2.09 (95%CI: 1.22-3.60) in the pres-ence of precarious conditions, as compared to children living in households with adequate physical, environmental, and sanitary condi-tions.
Discussion
According to this study, prevalence of anemia in preschool children in Salvador, Bahia, Brazil (46.3%) was higher than the WHO definition 5
(≥40%) for characterizing the disease as a ma-jor health problem for this population group. The prevalence observed in Bahian children (46.3%) in 1996 was similar to that identified in the city of São Paulo (46.9%) that same year 3
and in Recife, Pernambuco State (46.4%) in 1997 2for children under five years of age.
The child’s age was associated significantly with the occurrence of anemia; the risk was higher among children 6 to 12 months, de-creasingly slightly from 12 to 24 months. These age range, significantly associated with ane-mia, are the same in which the most important changes occur in child-feeding regimens, name-ly weaning, complementary foods and exposure to the family unit’s eating patterns. The short median duration of exclusive and total breast-feeding, along with the low iron content in complementary foods in children under two years of age in this study 7may partially explain
these increased risks. For these children, breast-feeding and especially prolonged breastfeed-ing are important strategies for preventbreastfeed-ing ane-mia, given the high bioavailability of iron in hu-man breast milk (50.0%) 5.
Table 1
Prevalence of anemia in preschool children. Salvador, Bahia, Brazil, 1996.
Age*(months) Number of Anemia
children Severe Mild/moderate Total (Hb < 9.5g/dl) (Hb 9.5-11.0g/dl) (Hb < 11.0g/dl)
n % n % n %
0-6 56 6 10.7 22 39.3 28 50.0
6-12 76 23 30.3 26 34.2 49 64.5
12-24 137 27 19.7 61 44.5 88 64.2
24-36 122 13 10.7 41 33.6 54 44.3
36-60 212 13 6.1 47 22.2 60 28.3
Total 603 82 13.5 197 32.8 279 46.3
Table 2
Unadjusted odds ratio for the association between anemia and biological, nutritional, social, and environmental variables in preschool children. Salvador, Bahia, Brazil, 1996.
Variables n % Anemia
gross OR 95%CI p-value
Age (months)
0-6 55 9.6 1.00 – –
6-12 75 12.4 1.99 1.01-3.94 0.047
12-24 133 23.2 1.94 107-3.51 0.030
24-60 328 54.8 0.57 0.30-1.06 0.074
Child’s gender
Male 291 49.4 1.00 – –
Female 300 50.6 0.91 0.69-119 0.466
Birth weight (g)
≥2,500 452 76.6 1.00 – –
< 2,500 129 23.4 0.82 0.49-1.37 0.437
Presence of disease*
No 369 62.7 1.00 – –
Yes 217 37.3 1.16 0.80-1.68 0.437
Hospitalization during the year preceding the interview
No 492 85.1 1.00
Yes 85 14.9 1.46 0.96-2.23 0.078
Height-for-age indicator
≥-1 (z score) 487 82.4 1.00
< -1 (z score) 104 17.6 1.40 0.85-2.33 0.181
Weight-for-age indicator
≥-1 (z score) 470 79.8 1.00
< -1 (z score) 121 20.2 0.90 0.56-1.47 0.672
Gender, head of family
Male 456 78.0 1.00 – –
Female 128 22.0 1.20 0.78-1.82 0.407
Age, head of family (years)
25-65 382 65.6 1.00 – –
14-25 149 25.4 1.10 0.70-1.72 0.682
Over 65 52 9.0 0.37 0.17-0.79 0.011
Dietary iron density (mg/100kcal)**
> 0.6 198 34.5 1.00
0.6-0.4 214 38.0 1.09 0.71-1.67 0.697
≤0.4 158 27.5 1.69 1.11-2.56 0.015
Distribution of dietary iron content (mg/day)**
> 7.3 190 33.2 1.00
4.3-7.3 207 36.5 1.17 0.82-1.67 0.383
≤4.2 173 30.3 1.53 1.02-2.30 0.039
The diets that these children were exposed to may be reflected in the high anemia rates, particularly because of the low iron content, es-pecially heme iron, and rich in phytates and poor in non-heme iron absorption activators like vitamin C. Such eating practices are known to facilitate the development of anemia 1.
According to the WHO, if anemia prevalence is greater than 40.0%, the most probable cause is iron-deficient diet 5. In this study, dietary iron
density ≤0.4mg/100kcalthwas associated
sig-nificantly with anemia in the children, as com-pared to > 0.6mg/100kcalthdietary iron density.
In the first two years of life, iron density in complementary foods should be approximate-ly 0.8mg/100kcalth20. Offering children highly
diluted food and low iron content can limit this density. Regardless of age, mean iron intake for children in this study was 6.0mg/day, and only one third of the children had diets with an availability of ≥6.0mg/day, thus indicating the limited adequacy of dietary iron. Another key
dietary factor associated with anemia was pro-tein intake ≤ 28.8g/day as compared to > 44.6g/day. According to the WHO 20, not only
iron, but also protein, zinc, folic acid, and vita-mins A, B12, and C among others are necessary
for hematopoiesis.
Adjusting the model for the other variables highlighted the statistical importance of the as-sociation between anemia and inadequacy of the height-for-age indicator, below < -1 z-score. Under such conditions, the risk was 2.19 (95%CI: 1.07-4.45) times greater for these as compared to eutrophic children. This finding is of great epidemiological importance, particularly be-cause a major decline has recently been detect-ed in severe and moderate malnutrition among children in Salvador, based on both the weight-for-age and height-weight-for-age anthropometric in-dices 7. This decrease may have been due to
in-terventions in the field of health, nutrition, and sanitation by government agencies and non-governmental organizations. However, the evi-Table 2 (continued)
Variables n % Anemia
gross OR 95%CI p-value
Distribution, dietary protein content (g/day)**
> 44.6 182 32.0 1.00 – –
44.6-28.9 191 33.6 1.20 0.73-1.97 0.470
≤28.8 197 34.4 1.53 1.05-2.23 0.027
Distribution, dietary calorie content (kcal/day)***
> 1,461.8 138 24.4 1.00 – –
1,461.8-1,131.8 133 22.9 1.39 0.83-2.32 0.205
1,131.9-828.9 147 26.0 1.00 0.64-1.55 0.985
≤828.8 152 26.7 1.26 0.81-1.95 0.291
Per capita family income (times monthly minimum wage)
> 166.7 90 20.6 1.00 – –
166.7-68.9 126 28.0 0.86 0.50-1.48 0.580
68.8-35.9 117 25.5 1.18 0.62-2.25 0.602
≤358 114 25.8 1.26 0.71-2.23 0.418
Index of household physical, environmental, and sanitary conditions
Good 192 31.8 1.00 – –
Fair 217 36.8 1.32 0.92-1.90 0.125
Precarious 182 31.4 1.47 0.92-2.37 0.106
Number of inhabitants per bedroom
1-2 203 35.0 1.00 – –
3-4 277 47.6 1.30 0.84-2.02 0.231
> 5 99 17.4 1.33 0.86-2.06 0.188
dence indicates that such measures have failed to make a similar impact on the mild form of this disease. Taking the height-for-age indica-tor specifically, for the combined severe and moderate forms, one observes a low prevalence (3.0%); however, the mild form shows a high prevalence (15.1%). Evidence indicates that mi-cronutrient deficiency (particularly of zinc, vit-amin A, and iron), especially during the phase of the rapid growth, can contribute to persis-tently high rates of the mild form of linear growth deficit 4. This situation may explain the
epidemiological malnutrition profile identified among children in Salvador.
This study’s data also signal a dose-response relationship between anemia and precarious household physical, environmental, and sani-tary conditions, as observed when the results were adjusted for the model’s other variables.
A relationship has currently been well-es-tablished between adverse conditions in the social and economic 21as well as sanitary
envi-ronment 22, constraining health and nutrition
indicators in childhood. This scenario is repro-duced particularly in geographic spaces marked by the same social and economic inequalities. In this sense, factors associated with anemia in children in Salvador were similar to those iden-tified in preschool children in the State of Per-nambuco, during the same period in which this study was conducted 2, indicating that children
in Northeast Brazil are exposed to similar living conditions, determining a similar context for childhood health and nutrition.
Despite the limitation of the study’s cross-sectional design, which prevents all the poten-tial confounding variables from being con-trolled, the results reinforce the evidence that the nutritional status of the children investigat-ed here expresses the conditions in the social, economic, and sanitary environment and the food consumption pattern to which they are exposed. They are also highly significant in the epidemiological sense, to the extent that this Table 3
Adjusted odds ratio for the association between anemia and biological, nutritional, social, and environmental variables in preschool children in Salvador, Bahia, Brazil, 1996.
Variables Hemoglobin (< 11.0g/dl)
adjusted OR* 95%CI p-value
Age (months)
0-6 1.00
6-12 5.35 1.73-16.58 0.005
12-24 4.78 1.97-11.57 0.001
24-60 1.00 0.38-2.64 0.997
Dietary iron density (mg/100kcalth)**
> 0.6 1.00
0.6-0.4 1.22 0.61-2.45 0.568
≤0.4 3.11 1.13-8.58 0.029
Distribution, dietary protein content (g/day)**
> 44.6 1.00
44.6-28.9 1.39 0.61-3.20 0.427
≤28.8 2.35 1.10-5.02 0.028
Height-for-age indicator
≥-1 (z score) 1.00
< -1 (z score) 219 1.07-4.45 0.032
Index of household physical, environmental, and sanitary conditions
Good 1.00 – –
Fair 1.70 1.10-2.61 0.017
Precarious 2.09 1.22-360 0.009
deficit is associated with increased morbidity from infectious disease, thus jeopardizing child-hood physical growth and learning 5.
The high prevalence of anemia among preschool children in underdeveloped coun-tries has motivated the implementation of poli-cies to combat iron deficiency 5, in Brazil as
well as in other countries. However, these pro-grams have shown little progress as compared to iodine and vitamin A supplementation
pro-grams 1. This fact may indicate that in addition
to the logistic problems identified with the dis-tribution of prophylactic doses of iron, mea-sures to combat iron deficiency should also take into account the association between ane-mia, food intake, the child’s anthropometric status, and the physical, sanitary, and environ-mental conditions in the household and sur-roundings.
Contributors
M. O. Assis participated in the elaboration of the de-sign for the statistical analysis. Together with M. L. Barreto, M. S. Prado and L. M. P. Santos collaborated in the study design. A. M. O. Assis, M. S. Prado, L. M. P. Santos, L. R. Sampaio, and R. C. Ribeiro coordinated the field work. G. S. S. Gomes collaborated in the elab-oration and implementation of the statistical analysis. N. S. Santos, V. A. Oliveira and L. P. M. Oliveira collab-orated in the data collection, implementation, and in-terpretation of the results in the food consumption analysis A. M. O. Assis, M. L. Barreto, and M. S. Prado participated in the final version of the article. N. S. Santos, L. M. P. Santos, L. R. Sampaio, R. C. Ribeiro, L. P. M. Oliveira, and V. A. Oliveira conducted the final revision.
Resumo
Este é um estudo transversal, realizado na cidade de Salvador, Bahia, Brasil, em 1996, envolvendo 603 pré-escolares com o objetivo de estimar a prevalência e identificar os fatores associados à ocorrência da ane-mia. A concentração da hemoglobina foi determinada utilizando-se o hemoglobinômetro (Hemocue). Níveis de hemoglobina abaixo de 11,0g/dl caracterizaram a anemia. Utilizou-se a análise de regressão logística para avaliar as associações de interesse. A prevalência da anemia foi de 46,3%. As faixas etárias de 6 a 12 e 12 a 24 meses, a densidade de ferro e a quantidade de proteína, situados no terceiro tercil da distribuição de consumo e quaisquer níveis de inadequação da altura em relação à idade constituíram-se em fatores de risco para a ocorrência da anemia. Inadequadas condições físicas, sanitárias e ambientais do domicilio imprimi-ram riscos crescentes e significantes na ocorrência da anemia A anemia é um importante problema de saú-de nas crianças investigadas. Melhorias das condições de moradia e da qualidade da dieta consumida po-dem contribuir para diminuir a ocorrência da enfer-midade.
References
1. Administrative Committee on Coordination/Sub Committee on Nutrition. 4thReport on the world
nutrition situation. Nutrition throughout the life cycle. Geneva: Administrative Committee on Co-ordination/Sub Committee on Nutrition; 2000. 2. Osório MM, Lira PI, Ashworth A. Factors
associat-ed with Hb concentration in children agassociat-ed 6-59 months in the State of Pernambuco, Brazil. Br J Nut 2004; 91:307-15.
3. Monteiro CA, Szarfarc SC, Mondini L. Tendência secular da anemia na infância na cidade de São Paulo (1984-1996). Rev Saúde Pública 2000; 34: 62-72.
4. Administrative Committee on Coordination/Sub Committee on Nutrition and Poverty. Geneva: Administrative Committee on Coordination/Sub Committee on Nutrition; 1997. (Report Nutrition Policy Paper no16).
5. World Health Organization. Iron deficiency anaemia: assessment, prevention and control. A guide for programme managers. Geneva: World Health Organization; 2001. ( Technical Report WHO/NHD/01.3).
6. Administrative Committee on Coordination/Sub Committee on Nutrition. What works? A review of efficacy and effectiveness of nutrition interven-tions. Geneva: Administrative Committee on Co-ordination/Sub Committee on Nutrition; 2001. 7. Assis AMO, Barreto ML, Santos LMP, Sampaio LR,
Magalhães LP, Prado MS, et al.. Condições de vi-da, saúde e nutrição na infância em Salvador. Sal-vador: Bureau Editora; 2000.
8. Fundação Instituto Brasileiro de Geografia e Es-tatística. Censo Demográfico – Bahia. Rio de Ja-neiro: Fundação Instituto Brasileiro de Geografia e Estatística; 1991.
9. Paim JS. Análise da situação de saúde no Municí-pio de Salvador, segundo as condições de vida. Salvador: Organização Pan-Americana da Saúde/ Conselho Nacional de Ciência e Tecnologia; 1995. 10. Willett W. Nutritional epidemiology. New York:
Oxford University Press; 1990.
11. Magalhães LP, Oliveira VA, Santos JM. Guia para estimar consumo alimentar. Salvador: Núcleo de Pesquisa de Nutrição e Epidemiologia, Universi-dade Federal da Bahia; 1996.
12. Organización Mundial de la Salud. Medición del cambio del estado nutricional. Geneva: Organi-zación Mundial de la Salud; 1983.
13. Wintrobe M, Lee GR, Bogs TR, Bithell TC, Foerster J, Athens J, et al. Clinical hematology. 8thEd.
Philadelphia: Lea & Febiger; 1981.
14. National Center for Health Statistics. Growth curves for children birth-18 years. Washington DC: National Center for Health Statistics; 1977. (Vital and Health Statistics Series 11).
15. World Health Organization. Global database on child growth and malnutrition. Program of Nutri-tion and Family and Reproductive Health. Gene-va: World Health Organization; 1997.
16. de Onis, M, Frongillo EA, Blössner M. Is malnutri-tion declining? An analysis of changes in levels of child malnutrition since 1980. Bull World Health Organ 2000; 78:1222-33.
17. Pelletier DL. The relationship between child an-thropometry and mortality in developing coun-tries: Implications for policy, programs and fu-ture research. J Nutr 1994; 124 Suppl:2047S-81S. 18. Issler RM, Giugliani ER, Kreutz GT, Meneses CF,
Justo EB, Kreutz VM, et al. Poverty levels and chil-dren’s health status: study of risk factors in an ur-ban population of low socioeconomic level. Rev Saúde Publica 1996; 30:506-11.
19. Kish L. Survey sample. New York: John Wiley & Sons; 1965.
20. World Health Organization. Complementary feed-ing of children in development countries: a re-view of current scientific knowledge. Geneva: World Health Organization; 1998. (Technical Re-port WHO/NUT/98.1).
21. Victora CG, Wagstaff A, Schellenberg JA, Gwatkin D, Claeson M, Habicht JP. Applying an equity lens to child health and mortality: more of the same is not enough. Lancet 2003; 362:233-41.
22. Checkey W, Gilman RH, Black RE, Epstein LD, Cabrera L, Sterling CR, et al. Effect of water and sanitation on childhood health in a poor Peruvian peri-urban community. Lancet 2004; 363:112-8.
Submitted on 23/Jun/2003