Fisioter. Mov., Curitiba, v. 30, n. 2, p. 255-265, Apr./June 2017 Licenciado sob uma Licença Creative Commons DOI: http://dx.doi.org/10.1590/1980-5918.030.002.AO06
[T]
Prevalence and factors associated to back pain in adults from
the northeast of São Paulo, Brazil: a population-based study
Prevalência e fatores associados à dor na coluna vertebral em
adultos do noroeste de São Paulo, Brasil: estudo de base populacional
Alberto De Vitta[a], Marta Helena Souza De Conti[a], Nicoly Machado Maciel[a], Débora de Melo Trize[a], José Eduardo Corrente[b], Tânia Ruiz[b]*
[a] Universidade do Sagrado Coração (USC), Bauru, São Paulo, Brazil [b] Universidade Estadual Paulista (UNESP), Botucatu, São Paulo, Brazil
[R]
Abstract
Introduction: Back pain has become a serious public health problem. Objective: To determine the preva-lence of back pain in a population-based sample of subjects over 20 years old living in the city of Bauru (São Paulo, Brazil) and to analyze the associations to variables- sociodemographic, ergonomic and lifestyle-related – and to morbidity. Methods: a cross-sectional study which evaluated 600 adults over 20 years old, both gender and living in the city. We used a structured protocol and the Nordic questionnaire. Also, we developed a descriptive analysis, bivariate and multivariate by binary logistic regression. Results: The prevalence of back pain was of 50.3% (CI 46.3 to 54.3), since 42.3% (CI 36.9 to 48.0) in men and 57.6% (CI 51.9 to 63.0) in women, with statistical significant difference (p = 0.001). Different variables remained in final models when assessed by gender. For male to be widowed and divorced and smoking habits and, for women to be widowed and divorced, to work in seated position and to perform occupational activities that demand carrying and lifting weight. Conclusion: We verified high prevalence in back pain in the population
* AV: PhD, e-mail: [email protected]
MHSC: PhD, e-mail: [email protected] NMM: Master Student, e-mail: [email protected] DMT: Doctoral Student, e-mail: [email protected] JEC: PhD, e-mail: [email protected]
256
of Bauru and high association to widowed/divorced in both gender, with women performing occupational activities usually or always in seated position, those who carry or lift weight in work and men who smoke.
Keywords: Epidemiology. Spine. Back Pain. Neck Pain. Risk Factors.
Resumo
Introdução: As dores na coluna vertebral tornaram-se um grave problema de saúde pública. Objetivo: Verificar a
prevalência de dor na coluna vertebral em uma amostra de base populacional de indivíduos com idade superior a 20 anos residentes na cidade de Bauru (São Paulo, Brasil) e analisar as associações as variáveis sociodemográficas, ergonômicas, relacionadas ao estilo de vida e a morbidade referida. Métodos: Estudo transversal que avaliou 600 adultos com idade superior a 20 anos, de ambos os sexos, moradores da zona urbana do município. Utilizou-se um protocolo estruturado e o questionário Nórdico. Realizou-se uma análise descritiva, bivariada e multivariada por regressão logística binária. Resultados: A prevalência de dor nas costas foi 50,3% (IC95% 46,3 a 54,3), sendo que, 42,3% (IC95% 36,9 a 48,0) nos homens e 57,6% (IC95% 51,9 a 63,0) nas mulheres com diferença estatisticamente significativa (p = 0,001). Diferentes variáveis permaneceram nos modelos finais ao se considerarem, em separado, o sexo masculino e o feminino. Ser viúvo e separado e tabagismo para o sexo masculino e, para o feminino, ser viúva e separada, trabalho na postura sentada e exercer atividades ocupacionais que exigem transporte e carregamento de peso. Conclusão: Verificou uma prevalência alta de dor na coluna vertebral na população de Bauru e marcante
associação com marcante associação com os viúvos/separados, em ambos os sexos, com as mulheres que exercem suas atividades ocupacionais, geralmente ou sempre, na postura sentada, naqueles que transportam e carregam pesos regulamente no trabalho e nos homens tabagistas.
Palavras-chave: Epidemiologia. Coluna Vertebral. Dor Lombar. Dor Cervical. Fatores de Risco.
Introduction
Back pain has become a serious public health problem, since it has high incidence in economically active population, whereas seventy percent of adults experience it in some point of their lives, resulting in more than 15 million doctors’ appointments in one year (1).
Population-based studies about the prevalence of back pain are relevant since it creates social and economic consequences for both State and subjects. To the subject, it means the loss of life quality and, to the State, the costs of treatment and rehabilitation, besides work absence. Also, knowing the
sociodemo-graphic and behavioral profile; the work and general
health of these subjects; and the risk factors associ
-ated to musculoskeletal symptoms, is essential for public policies that aim this problem control based on preventive and/or therapeutic interventions (2).
Back pain may have specific causes (inflammatory
diseases, degenerative diseases, neoplasia, congenital impairment, muscle weakness, degeneration signs of
spine or intervertebral discs) and non-specific, such
as sociodemographic factors (age, gender, income and education), behavioral (smoking and low physical activity level), every day and work expositions (ex-haustive work, vibration, vicious posture, repetitive movements), among others (obesity and psychologi-cal factors) (3, 4, 5).
Some studies show the relation between back pain and the associated factors. In Salvador (BA, Brazil), researchers observed that being single was a protec-tor facprotec-tor, while smoking habit was a possible facprotec-tor to back pain (3). However, in Pelotas (RS, Brazil) sub-jects between 50 and 59 years old presented about eight times more chronic back pain than those be-tween 20 and 29. The categories of low education level, from 1 to 4 and 5 to 8 years of studying had, at least, double the risk of presenting the condition than the people who had 12 years of education or
more. Also, they found significant risks higher than
2.0 for people with current smoking habit when
com-pared to those who doesn’t smoke; as well as those
257
from 2010, which provide a list of private homes ad-dresses of each census sector. We drawn 50 urban
census sectors of the 476 identified.
For each census sector, we determined a number
of households to be drawn by calculating the ratio of subjects average by the household number in each sample domain (6). Therefore, we estimated it should be visited around 12 households by census sector. These households were draw systematically and were considered eligible to be interviewed all the subjects living in the house. In the case of refuse, a new house-hold was drawn.
We considered being losses the subjects that were not reached after four visits, being, at least, one at
night and one on the weekends; and those who were
unable to answer the interview due to travelling. And, refuses were considered those who denial to answer the questionnaire by personal option.
Subjects who were institutionalized (nursing homes, hospitals, prisons, etc.) and those not hav-ing mental condition to answer were excluded from study. The aged subjects were submitted to a mini-exam of Mental State in the beginning of the question-naire, to assess their cognitive state and verify the reliability of their answers. Participants who scored below 27 points were excluded (7).
The interviews were conducted by 10 interview-ers, senior students of the Physical Therapy gradu-ation. All of them completed 40 hours of training, which included aspects related to interviewing tech-nique, household approach and training related to interest questions of the research tool. A pilot study was conducted as part of the interviewers training
to verify question understanding. Field practice was
supervised by researchers involved in the study, being each supervisor responsible for following two interviewers.
Data collection comprised the period between
February and June 2012, by means of question
-naires. The code was developed right after the in-terviews by the interviewers themselves. The super-visors had also carried through the quality control that consisted on the application of questionnaires with reduced number of questions, to 10% of the interviewed subjects.
The data from aspects demographic (gender, age, marital status and color of the skin), socioeconomic
(education and income); ergonomic (seated work,
standing, crouched, lying, kneeled, vibration and/or
trepidation, carrying weight, repetitive movement);
performing repetitive movements or carrying weight, when compared to those who perform activities in vicious position (4). In American adults, back and low back pain was related to the presence of com-orbities (respiratory, cardiovascular and gastroin-testinal diseases, among others) and psychological alterations (depression, insomnia or trouble falling asleep) (1). In Thailand, researchers observed that back pain was associated to incorrect posture at work (forward bending while sitting), standing more than two hours in occupational activities and previous
his-tory of working as an office worker (5).
Considering the theoretical reference, we aimed to verify the prevalence of back pain in a population-based sample of subjects over 20 years old living in the city of Bauru (São Paulo, Brazil), and to analyze the associations to sociodemographic, ergonomic and lifestyle-related variables and to morbidity.
Methods
Cross-sectional study developed in the urban zone in the city of Bauru SP, Brazil, a city with 316.064 habitants, in which 207.021 is over 20 years old.
First, we defined groups of age and gender called
sample domains, for those, it will be guaranteed mini-mum number to allow further analysis. The sample
domains were: From 20 to 35 years old for male gen
-der; 20 to 35 for female; 36 to 59 for male; 36 to 59 for female; 60 years or more for male; 60 years or
more for female.
The sample calculation was based on the esti-mated proportion in the population subgroups of
50% (p = 0.50), since it is the maximum variability that conduct to obtain sizes of conservatory samples;
the confidence interval of 95% (z = 1.96) in the de
-termination of it in estimative; sample error of 10%
indicating the amplitude between sample evalua-tion and populaevalua-tion parameter should not exceed
this value (d = 0.1); and the design effect (deff) equal
to 2. Therefore, the sample size for the group was a minimum of 200 subjects (100 male and 100 female), a total of 600 participants.
258
age and color of the skin); second, where there are
socioeconomic variables (income and education) and
demographic variables (marital status); and third
that encloses the ergonomic variables (seated work, standing, crouching, knelling, lying, vibration and/or trepidation and repetitive movement) and the behav-ioral variable (low physical activity, smoking). The
effect of variables in the first level were controlled between themselves; those in the second level they
were controlled between them and for the ones in the
first level; variables in the third level were controlled
between them and for the ones in the two previous levels. The variable that presented in the bivariate
analysis value p ≤ 0.2 came into the hierarchized
model of analysis. Variables that in the multivariate
analysis also presented value p ≤ 0.2 remained in
the model whenever they filled the criteria for prob
-able factors of confusion. For the election of vari-ables
that remained in the model of logistic regression, it was used the selection process backward stepwise,
remaining, in the final model, all variables that pre
-sented value p < 0.05.
The project was approved by the Committee of Ethics in Research of the Universidade do Sagrado Coração, under protocol number 251/97. The
partici-pants signed the Consent Form, as recommendations
of Resolution 196 of the National Health Council.
Results
In the drawn households 641 subjects were found to be eligible, being effectively interviewed 600
in-dividuals. The main reasons of losses (n = 41) were:
“it did not have anybody at home” and “they had an appointment with the interviewer and they did not at-tend”; and the reasons of refusals: “they do not answer the interview” and “too long and out of time to answer”.
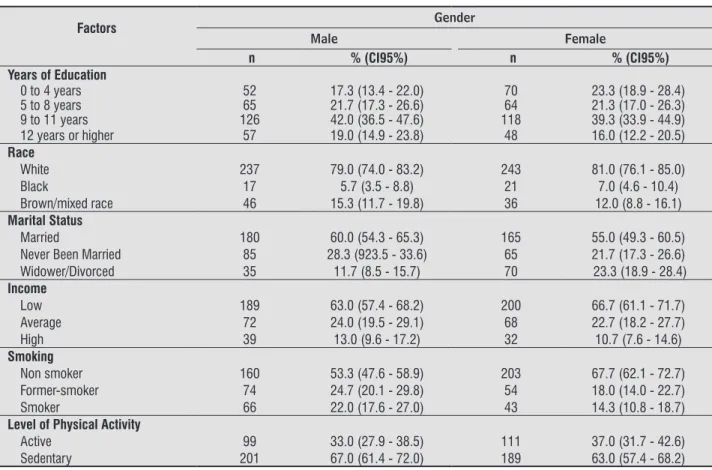
Table 1 shows the sociodemographic character-istics — level of physical activity and smoking — of the sample with individuals over 20 years old, living in the city of Bauru.
From the interviewed subjects 94.3% watch TV
whereas 90.0% of them do it more than three times per week and 43.8% three or more hours per day. Regarding computer and videogame usage, 47.7%
use it and 41.5% of subjects do it over than five hours
per day and 26.5% up to two hours per day.
Regarding the position at work, we observed that
32.3% of the subjects always work in seated position;
and related to the life style (physical activity, smok-ing), were collected by means of a pre-coded ques-tionnaire, with closed questions. We considered to
be a smoker those who affirmed to smoke daily (at
least a cigarette per day) or occasionally (less than
one cigarette per day); and former-smokers were
considered those who had quit smoking at least six months ago.
To verify the level of physical activity, we applied the International Questionnaire of Physical Activity —
Short Form (IPAQ-SF), which contains questions re
-lated to the weekly frequency and the duration in minutes of every day physical activities of vigorous, moderate and for walking. The questionnaire was properly validated for the Brazilian population,
get-ting coefficient of validation for the short version of r = 0.75 (8). A cut-point of 150 minutes per week
was used to classify subjects as active (150 min/per
week or more) or insufficiently active — below of
150 min/per week (9).
The Morbidity data was collected by means of in-terview, in which subjects answered to the following question: amongst the alternatives below (hyperten-sion, osteoporosis, diabetes, osteoarthrosis, skin dis-eases, gastrointestinal, respiratory, duodenal or liver disease, genital and urinary system), that one (s) that corresponds (m) to diagnosis (s) have received from any doctor in the last 12 months (10).
The question used for the definition of pain in the
spine was: “In the last year, have you already felt any pain in your back?” In the case of positive answer, the interviewed subject would have to indicate the
part in a figure of an erect human being differing,
with colors, the regions of the lumbar, thoracic and cervical column (11).
The obtained data were introduced in a data base and the analysis were conducted using the statistical program SPSS, version 10.0 (SPSS, Chicago, United States). The analysis was conducted through a de-scriptive and inferential approach. In the dede-scriptive approach, we conducted the distributions of absolute
and relative frequency for categorical variables; and in
the analytical approach we developed bivariate analy-sis through Pearson’s chi-square test and followed by a multivariate analysis by binary logistic regression, according to the hierarchical model. We adopted the method “backward stepwise” of variables introduc-tion. The model considered for the hierarchy
previ-ous mentioned was constituted by three levels: first,
259
to 38.0), followed by thoracic pain (22.5%; CI95% 19.3 to 26.0) and cervical pain (20.3%; CI95% 17.2 a 23.7).
In Table 2 we observed that back pain was
sig-nificantly higher in subjects widowed or divorced for
both gender; in low income women, and low educa
-tion level and smokers men. We also notice, for men ever since the age increased there was a tendency of increasing the frequency of pain.
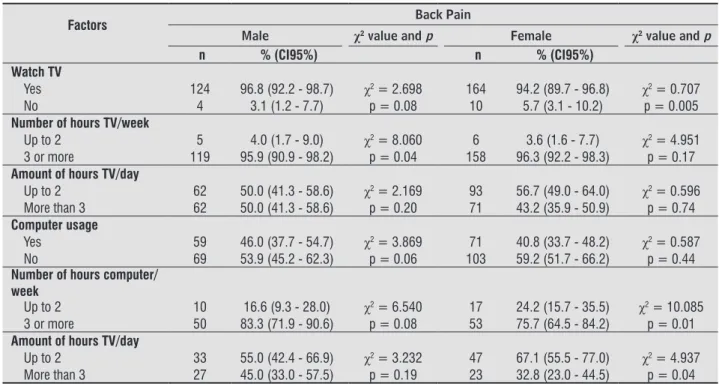
In Table 3 analysis, we observed that back pain was
significantly higher in men who watch TV more than 3
times in week and women who use the computer more than 3 times in week and more than 3 hours per day.
43.8% standing; 24.7% standing and forward bend
-ing; 6.8% sitting and forward bend-ing; 2.8% in kneeled position; and 2.0% sitting lifting weight. Near
36.5% of the subjects always performed repetitive
movements; 13.8% always carried weight; and 7.0%
were always exposed to vibration.
From total of subjects, 50.3% (CI95% 46.3 to 54.3)
reported back pain at least once in the last 12 months previous to the interview, since 42.3% (CI95% 36.9 to 48.0) of men and 57.6% (CI95% 51.9 to 63.0) of
wom-en, with statistical significant difference (p=0.001). Low back pain was predominant (34.2%; CI 95% 30.4
Table 1 - Frequency distribution of the sociodemographic characteristics – level of physical activity and smoking – from the sample with individuals over 20 years old, living in the city of Bauru, by gender
Factors Gender
Male Female
n % (CI95%) n % (CI95%)
Years of Education
0 to 4 years 52 17.3 (13.4 - 22.0) 70 23.3 (18.9 - 28.4)
5 to 8 years 65 21.7 (17.3 - 26.6) 64 21.3 (17.0 - 26.3)
9 to 11 years 126 42.0 (36.5 - 47.6) 118 39.3 (33.9 - 44.9)
12 years or higher 57 19.0 (14.9 - 23.8) 48 16.0 (12.2 - 20.5)
Race
White 237 79.0 (74.0 - 83.2) 243 81.0 (76.1 - 85.0)
Black 17 5.7 (3.5 - 8.8) 21 7.0 (4.6 - 10.4)
Brown/mixed race 46 15.3 (11.7 - 19.8) 36 12.0 (8.8 - 16.1)
Marital Status
Married 180 60.0 (54.3 - 65.3) 165 55.0 (49.3 - 60.5)
Never Been Married 85 28.3 (923.5 - 33.6) 65 21.7 (17.3 - 26.6)
Widower/Divorced 35 11.7 (8.5 - 15.7) 70 23.3 (18.9 - 28.4)
Income
Low 189 63.0 (57.4 - 68.2) 200 66.7 (61.1 - 71.7)
Average 72 24.0 (19.5 - 29.1) 68 22.7 (18.2 - 27.7)
High 39 13.0 (9.6 - 17.2) 32 10.7 (7.6 - 14.6)
Smoking
Non smoker 160 53.3 (47.6 - 58.9) 203 67.7 (62.1 - 72.7)
Former-smoker 74 24.7 (20.1 - 29.8) 54 18.0 (14.0 - 22.7)
Smoker 66 22.0 (17.6 - 27.0) 43 14.3 (10.8 - 18.7)
Level of Physical Activity
Active 99 33.0 (27.9 - 38.5) 111 37.0 (31.7 - 42.6)
Sedentary 201 67.0 (61.4 - 72.0) 189 63.0 (57.4 - 68.2)
Table 2 - Bivariate analysis between sociodemographic characteristics – smoking and physical activity level and pain in spine – from subjects over 20 years old, living in the city of Bauru (São Paulo, Brazil), by gender
Factors Back Pain
Male χ2 value and p Female χ2 value and p
n % (CI95%) n % (CI95%)
Age
20 to 35 years old 33 25.7 (18.9 - 33.9) 57 32.7 (26.2 - 40.0)
36 to 59 years old 46 35.9 (28.1 - 44.5) χ2 = 5.914 56 32.1 (25.6 - 39.4) χ2 = 0.575
60 or more 49 38.2 (30.3 - 46.9) p = 0.05 61 35.0 (28.3 - 42.4) p = 0.74
260
Table 3 - Bivariate analysis between back pain and sedentary activities of the sample with subjects over 20 years old, liv-ing in the city of Bauru (São Paulo, Brazil), by gender
Factors Back Pain
Male χ2 value and p Female χ2 value and p
n % (CI95%) n % (CI95%)
Watch TV
Yes 124 96.8 (92.2 - 98.7) χ2 = 2.698 164 94.2 (89.7 - 96.8) χ2 = 0.707
No 4 3.1 (1.2 - 7.7) p = 0.08 10 5.7 (3.1 - 10.2) p = 0.005
Number of hours TV/week
Up to 2 5 4.0 (1.7 - 9.0) χ2 = 8.060 6 3.6 (1.6 - 7.7) χ2 = 4.951
3 or more 119 95.9 (90.9 - 98.2) p = 0.04 158 96.3 (92.2 - 98.3) p = 0.17
Amount of hours TV/day
Up to 2 62 50.0 (41.3 - 58.6) χ2 = 2.169 93 56.7 (49.0 - 64.0) χ2 = 0.596
More than 3 62 50.0 (41.3 - 58.6) p = 0.20 71 43.2 (35.9 - 50.9) p = 0.74
Computer usage
Yes 59 46.0 (37.7 - 54.7) χ2 = 3.869 71 40.8 (33.7 - 48.2) χ2 = 0.587
No 69 53.9 (45.2 - 62.3) p = 0.06 103 59.2 (51.7 - 66.2) p = 0.44
Number of hours computer/ week
Up to 2 10 16.6 (9.3 - 28.0) χ2 = 6.540 17 24.2 (15.7 - 35.5) χ2 = 10.085
3 or more 50 83.3 (71.9 - 90.6) p = 0.08 53 75.7 (64.5 - 84.2) p = 0.01
Amount of hours TV/day
Up to 2 33 55.0 (42.4 - 66.9) χ2 = 3.232 47 67.1 (55.5 - 77.0) χ2 = 4.937
More than 3 27 45.0 (33.0 - 57.5) p = 0.19 23 32.8 (23.0 - 44.5) p = 0.04
Table 2 - Bivariate analysis between sociodemographic characteristics – smoking and physical activity level and pain in spine – from subjects over 20 years old, living in the city of Bauru (São Paulo, Brazil), by gender
Factors Back Pain
Male χ2 value and p Female χ2 value and p
n % (CI95%) n % (CI95%)
Years of Education
0 to 4 years old 29 22.6 (16.2 - 30.6) 47 27.0 (20.9 - 34.0)
5 to 8 years old 28 21.8 (15.5 - 29.8) χ2 = 8.311 35 20.1 (14.8 - 26.6) χ2 = 3.187
9 to 11 years old 43 33.5 (26.0 - 42.1) p = 0.03 66 37.9 (31.0 - 45.3) p = 0.34
More than 12 years old 28 21.8 (15.5 - 29.8) 26 14.9 (10.4 - 20.9)
Race
White 94 73.4 (65.1 - 80.3) 138 79.3 (72.6 - 84.6)
Black 7 5.4 (2.6 - 10.8) χ2 = 5.721 13 7.4 (4.4 - 12.3) χ2 = 0.670
Brown/mixed race 27 21.0 (14.9 - 28.9) p = 0.05 23 13.2 (8.9 - 19.0) p = 0.67
Marital Status
Married 71 55.4 (46.8 - 63.7) 90 51.7 (44.3 - 59.0)
Never Been Married 32 25.0 (18.3 - 33.1) χ2 = 13.476 36 20.6 (15.3 - 27.3) χ2 = 4.202
Widower/Divorced 25 19.5 (13.5 - 27.2) p = 0.001 48 27.5 (21.4 - 34.6) p = 0.04
Income
Low 82 64.0 (55.4 - 71.8) 127 72.9 (65.9 - 79.0)
Average 31 24.2 (17.6 - 32.3) χ2 = 0.326 32 18.3 (13.4 - 24.8) χ2 = 7.451
High 15 11.7 (7.2 - 18.4) p = 0.84 15 8.6 (5.2 - 13.7) p = 0.02
Smoking
Non smoker 54 42.1 (33.9 - 50.8) 121 69.5 (62.3 - 75.9)
Former-smoker 37 28.9 (21.7 - 37.2) χ2 = 11.667 30 17.2 (12.3 - 23.5) χ2 = 0.707
Smoker 37 28.9 (21.7 - 37.2) p = 0.003 23 13.2 (8.9 - 19.0) p = 0.70
Level of Physical Activity
Active 46 35.9 (28.1 - 44.5) χ2 = 0.870 63 36.2 (29.4 - 44.5) χ2 = 0.112
Sedentary 82 64.0 (55.4 - 71.8) p = 0.35 111 63.7 (56.4 - 70.5) p = 0.73
261
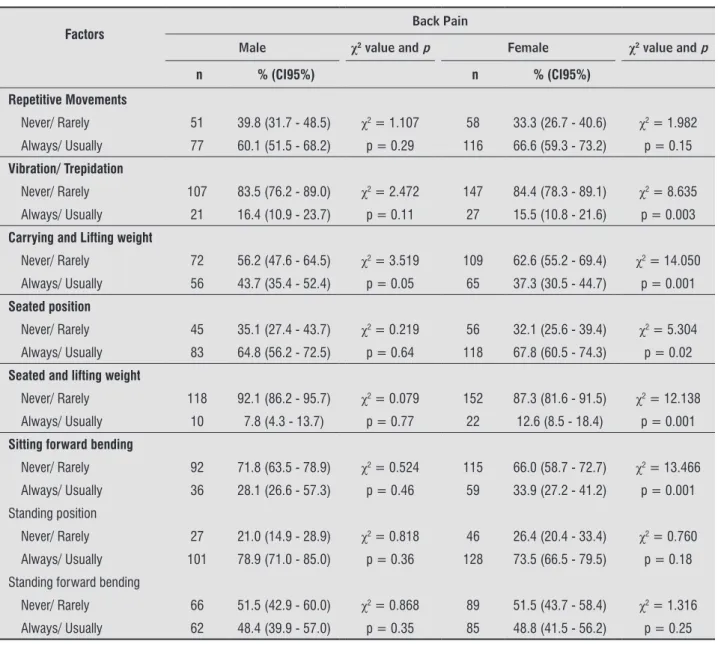
Table 4 - Bivariate analysis between back pain and ergonomic variables of the sample with subjects over 20 years old, liv-ing in the city of Bauru (São Paulo, Brazil), by gender
Factors Back Pain
Male χ2 value and p Female χ2 value and p
n % (CI95%) n % (CI95%)
Repetitive Movements
Never/ Rarely 51 39.8 (31.7 - 48.5) χ2 = 1.107 58 33.3 (26.7 - 40.6) χ2 = 1.982
Always/ Usually 77 60.1 (51.5 - 68.2) p = 0.29 116 66.6 (59.3 - 73.2) p = 0.15
Vibration/ Trepidation
Never/ Rarely 107 83.5 (76.2 - 89.0) χ2 = 2.472 147 84.4 (78.3 - 89.1) χ2 = 8.635
Always/ Usually 21 16.4 (10.9 - 23.7) p = 0.11 27 15.5 (10.8 - 21.6) p = 0.003
Carrying and Lifting weight
Never/ Rarely 72 56.2 (47.6 - 64.5) χ2 = 3.519 109 62.6 (55.2 - 69.4) χ2 = 14.050
Always/ Usually 56 43.7 (35.4 - 52.4) p = 0.05 65 37.3 (30.5 - 44.7) p = 0.001
Seated position
Never/ Rarely 45 35.1 (27.4 - 43.7) χ2 = 0.219 56 32.1 (25.6 - 39.4) χ2 = 5.304
Always/ Usually 83 64.8 (56.2 - 72.5) p = 0.64 118 67.8 (60.5 - 74.3) p = 0.02
Seated and lifting weight
Never/ Rarely 118 92.1 (86.2 - 95.7) χ2 = 0.079 152 87.3 (81.6 - 91.5) χ2 = 12.138
Always/ Usually 10 7.8 (4.3 - 13.7) p = 0.77 22 12.6 (8.5 - 18.4) p = 0.001
Sitting forward bending
Never/ Rarely 92 71.8 (63.5 - 78.9) χ2 = 0.524 115 66.0 (58.7 - 72.7) χ2 = 13.466
Always/ Usually 36 28.1 (26.6 - 57.3) p = 0.46 59 33.9 (27.2 - 41.2) p = 0.001
Standing position
Never/ Rarely 27 21.0 (14.9 - 28.9) χ2 = 0.818 46 26.4 (20.4 - 33.4) χ2 = 0.760
Always/ Usually 101 78.9 (71.0 - 85.0) p = 0.36 128 73.5 (66.5 - 79.5) p = 0.18
Standing forward bending
Never/ Rarely 66 51.5 (42.9 - 60.0) χ2 = 0.868 89 51.5 (43.7 - 58.4) χ2 = 1.316
Always/ Usually 62 48.4 (39.9 - 57.0) p = 0.35 85 48.8 (41.5 - 56.2) p = 0.25
To define the association between back pain and
ergonomic variables, frequencies obtained in catego-ries “never” and “rarely” were enclosed in one group, the same was done with categories “usually”and “always”.
We observed that prevalence of pain is higher for those usually/always exposed to work
demand-ing carrydemand-ing and liftdemand-ing weight for both gender; for
women performing a work in seated position, seated position lifting weight and sitting forward bending, and with vibration when comparing to those who never do any of them (Table 4).
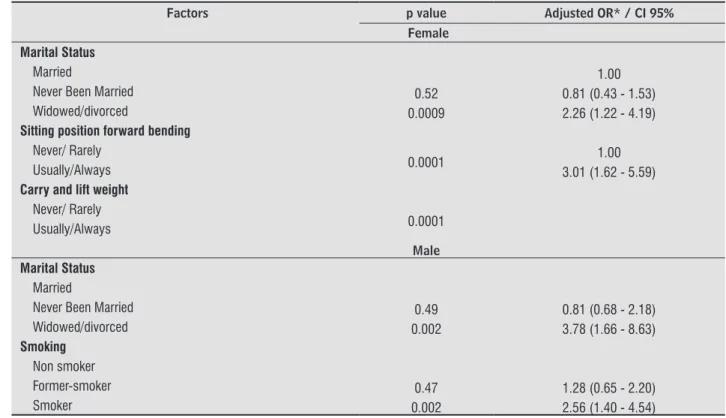
The prevalence of back pain disclosed that wid-owed and divorced women and men had, respectively, two and three times higher risk of presenting the con-dition than single and married. Nevertheless, we no-tice that women who perform daily activities, usually
or always, in seated position, presented significant
262
related to musculoskeletal system, being the first
cause of Statutory Sick Pay and the third of ill-health retirement in Brazil. Moreover, it is essential to con-sider the limitation on domestic and professional ac-tivities and leisure, and also the demand for health service that this problem creates (18).
Women presented a higher prevalence of back
pain than men, with statistical significant difference (p = 0.001), similar to studies conducted in England
(14) and Spain (16). However, such results are not consistent. In Vitória da Conquista (Bahia, Brazil) it was not observed association between gender and back pain (19).
Differences between genders can be explained through some assumptions. The first one is related to
the physical strength that is smaller in women than men, causing more energy expenditure for them when they are exposed to the demand of similar work, increasing the risk of musculoskeletal over-load. An additional assumption is psychosocial or-der, since it is believed that women complain more
often than men; that is, according to this thought, the
contrasts result from the differences in the predis-position of men and women in report information. Discussion
In this study the prevalence of back pain was of 50.3% similar to reports from a city in the south of Brazil (12), in which the prevalence was of 63.1% and
in Spain (13) of 50.9%, contrasting with findings from
England (14) of prevalence in only 23.0%. Considering regions of the back, 34% of subjects reported to feel pain in lumbar region as the higher prevalence among body parts that were asked. Epidemiologic data of other studies points to the prevalence of lumbar region lower than those observed in Bauru. In the
northeast of Brazil (3) the prevalence was in 14.2%;
28.5% in adults from Thailand (15); 19.9% in sub
-jects from Spain (16); and 21.9% in the autonomous
region of Madrid-SP (17).
When these variation are related to prevalence indexes, it is inferred that cultural aspects, socioeco-nomic characteristics (income and education), the people perception of health and the quality of health
systems, may have influence in the assessment of
pain, positive or negatively.
The prevalence of back pain is an important indi-cator when it is the most common cause of invalidity
Table 5 - Final model of multivariate analysis of logistic regression for variables associations with back pain of the sample with subjects over 20 years old, living in the city of Bauru (São Paulo, Brazil), by gender
Factors p value Adjusted OR* / CI 95%
Female
Marital Status
Married 1.00
Never Been Married 0.52 0.81 (0.43 - 1.53)
Widowed/divorced 0.0009 2.26 (1.22 - 4.19)
Sitting position forward bending Never/ Rarely
0.0001 1.00
Usually/Always 3.01 (1.62 - 5.59)
Carry and lift weight Never/ Rarely
0.0001 Usually/Always
Male
Marital Status Married
Never Been Married 0.49 0.81 (0.68 - 2.18)
Widowed/divorced 0.002 3.78 (1.66 - 8.63)
Smoking Non smoker
Former-smoker 0.47 1.28 (0.65 - 2.20)
Smoker 0.002 2.56 (1.40 - 4.54)
263
that act on it. Also, this position in work contributes to a shortening of some muscles (ischiotibial, ab-dominal and adductor, amongst others) resulting in biomechanical alterations in spine. All these
modi-fications, caused by seated position associated to
improper habits, extended time and other factors,
promote the development of inflammatory processes
in musculoskeletal structures with associated painful simptomatology (2).
In this study, women who carried through occupa-tional activities that demanded carry and lift weight presented 2.78 chances to report back pain. A study in India (25) revealed that diligent women who car-ried through this movement during working hours presented 1.56 more possibility of back pain risk than the ones who did not and, in Malaysia (24), was noticed that women amongst the subjects that carried through occupational activities demanding carry and lift weight
presented more possibilities of back pain. During the
activities of carrying and lifting weight, three types of stress are transmitted through lumbar column tis-sues: compression force, shear and torsion force. It has been suggested that disc compression is responsible for terminal plate fracture, herniated disc and causing
nervous root irritation; and the shear compression modifies the viscoelastic properties of tissues, making
them more vulnerable to injuries. In biomechanical evaluations, these movements created increase of body and intra-abdominal muscular activity, resulting in lost of compression forces on spine (26).
Biomechanical studies state that the mechanisms
of feedback can influence the overload and its re
-sponse. For example, pain can take an individual to
modify the pattern of movement, modifying the way
as they carry and lift a specific weight. This adapta
-tion enables the individual to be exposed to more loads than their capacity supports (27).
Smoking men had two times more possibilities to develop back pain. In Vitória da Conquista, smokers
had 15% more chance of back pain; and in the South of Brazil, significant risks of pain in the lumbar column,
more than 2.0, were found for people who smoke cur-rently when comparing to those who do not smoke. This fact can be explained by the following theories:
the first one refers to the effect of the nicotine that
produces a reduction on blood circulation and some substances as sulfate and oxygen in the vertebral body what probably reduces the nutrition of vertebral discs. To conclude, the use of the tobacco could be related Possibly women have more social permission to talk
on about their symptoms and feelings or have a more developed observation capacity, both factors associ-ated to social and educational factors (20).
Regarding the condition association to the in-dependent variables, investigated in this study,
re-mained associated to back pain in the final model the marital status, for both gender; for women to
perform activities that demand carrying and lifting
weight and to work in seated position; and for men
to be a smoker.
In this study, for both gender, widower/divorced subjects presented more risks of back pain than sin-gle and married ones. In the population of Salvador (4) we observed that to be single it appeared as
pro-tective factor (RP = 0.60; 95%: 0.43 0.84), whereas,
in dentists, the widower/divorced subjects pre-sented greater risk of pain (21). In the population of Cambridge (14) and Madrid (17), relation between
these variables was not verified. Literature reports
that the influence of the marital status on the condi
-tion is not completely clear. Probably, marital
situa-tion is not a risk factor for pain, but a risk flag could
be related, for example, to the more ergonomic ex-positions in work/domicile or to behavioral charac-teristics (4). Another reasonable explanation would be more social supports for those who live in a stable union, therefore, married people present a smaller risk of developing depression (22).
Women, who worked in the seated position for-ward bending the body, presented three times more possibilities to report back pain. In white collars in
Canada (23), researchers verified those who worked in seated position with postural risks (body flexion
and rotation, absence of forearm and feet support) presented 5.04 more possibility of back pain risk than those who did not do it. In Malaysia, there is no as-sociation between seated position and back pain (24). The seated position for a long time can cause changes in intervertebral discs, ligaments,
articu-late capsules and muscle. Associated to body flexion,
diminishes the lordosis curve, promoting anterior annulus and pulpous nucleus compression of the intervertebral disc, stretching of posterior annulus, articular capsule and posterior ligaments. The lack of
movement during this position reduces the disc fluid
and diminishes blood supplement to the muscles.
Evidences suggest that the extended lumbar flexion
264
2. Vitta A, Canonici AA, Conti MHS, Simeão SFAP. Pre -valência e fatores associados à dor musculoesquelé-tica em profissionais de atividades sedentárias. Fi -sioter Mov. 2012;25(2): 273-80.
3. Almeida ICGB, Sá KN, Silva MB, Matos MA, Lessa I. Prevalência de dor lombar crônica na população da ci-dade de Salvador. Rev Bras Ortop. 2008;43(3):96-102.
4. Silva MC, Fassa AC, Valle NCJ. Dor lombar crônica em uma população adulta do Sul do Brasil: pre-valência e fatores associados. Cad Saude Publica. 2004;20(2):377-85.
5. Janwantanakul1 P, Pensri1 P, Moolkay P, Jiamjaras-rangsi W. Development of a risk score for low back pain inoffice workers-a cross-sectional study. BMC Musculoskelet Disord. 2011;12(23):2-8.
6. Alves MCGP. Técnicas de replicação em análise de dados de inquéritos domiciliares [dissertation]. São Paulo: Faculdade de Saúde Pública da USP; 2002. Portuguese.
7. Folstein MF, Folstein SE, McHugh PR. Mini-mental state: a practical method for grading the cognitive state of patients for the clinician. J Psychiatr Res. 1975;12(3):189-98.
8. Matsudo SMM, Araújo TL, Matsudo VKR, Andrade DR, Oliveira LC, Braggion GF. Questionário Internacional de Atividade Física (IPAQ): estudo de validade e re -produtibilidade no Brasil. Rev. Bras. Ativ. Fís. e. Saúde. 2001;6(2):5-18.
9. Physical Activity Guidelines Advisory Committee. Physical Activity Guidelines Advisory Committee Report, 2008. Washington (DC): U.S. Department of Health and Human Services; 2008.
10. Campolina AG, Ciconelli RM. Qualidade de Vida me-didas de utilidade: parâmetros clínicos para as toma -das de decisão em saúde. Rev Panam Salud Publica. 2006;19(2):128-36.
11. Kuorinka IJ, De Jong LC, Kilbon A, Vinterberg H, Bier -ingsorensen F, Anderson, G. Standardised Nordic Questionnaires for Analysis of Musculoskeletal Symp-toms. Appl Ergon. 1987;18(30): 233-7.
12. Ferreira GD, Silva MC, Rombaldi AJ, Wrege ED, Siqueira FV, Hallal PC. Prevalência de dor nas costas e fatores associados em adultos do Sul do Brasil: estudo de base populacional. Rev Bras Fisioter. 2011;15(1):31-6. the psychosocial risk factors for the outcome as low
socioeconomic status that would imply in more physi-cal demands of work and stress (28).
Physical therapy has as study object, human move-ment in all its forms of expression and potentialities, in the pathological alterations, kinetic-functional, or its psychic and organic repercussions, objectifying to preserve, develop, restore the integrity of organs, systems and functions. Therefore, data of the pres-ent study on prevalence and factors associated to back pain not only contribute for the development of actions directed to cure and individual rehabilita-tion, but also it contributes for the proposal of
inter-ventions on health promotion and prevention. For
example, as in analysis and changes of risk factors on occupational and domestic environments, in the elaboration and application of functional physical ac-tivities programs and of postural education (29, 30). A limitation of the present study was the fact of all the assessments were based on self-report. In some cases, it could have occurred, mainly on the
symptoms, subjects’ difficulty in remembering the
presence or absence of the symptoms after twelve months. However, the study outcomes are
compa-rable to those of specific literature. A high point of
this study was the number of subjects interviewed.
Conclusion
We verified high prevalence in back pain in the
population of Bauru, and high association to widowed/ divorced in both gender, with women performing occu-pational activities usually or always in seated position, who carry or lift weight in work and men who smoke.
Acknowledgements
We would like to special thank the participants,
the FAPESP (Foundation of Support to Education
and Research of the State of São Paulo) and to CNPq
(National Advice of Research) for financing this project.
References
265
23. Lapointe J, Dionne CE, Brisson C, Montreuil S. Interac -tion between postural risk factors and job strain on self-reported musculoskeletal symptoms among users of video display units: a three-year prospective study. Scand J Work Environ Health. 2009;35(2):134-44.
24. Chandrasakaran A, Chee HL, Rampal KG, Tan GLE. Work-related musculoskeletal problems among women workers in the semiconductor in-dustry in Peninsular Malaysia. Int J Occup Environ Health. 2004;10(1):63-71.
25. Das B. An evaluation of low back pain among female brick field workers of West Bengal, India. Environ Health Prev Med. 2015;20(5):360-8.
26. Bernard BP. Musculoskeletal Disorders and Workplace Factors: A Critical Review of Epidemiologic Evidence for Work-Related Musculoskeletal Disorders of the Neck, Upper Extremity, and Low Back. Cincinnati (OH): National Institute for Occupational Safety and Health; 1997.
27. Mazloum A, Nozad H, Kumashiro M. Occupational low back pain among workers in some small-sized facto-ries in Ardabil, Iran. Ind Health. 2006;44(1):135-9.
28. Boshuizen HC, Verbeek JHAM, Broersen JPJ. Do smok -ers get more back pain? Spine (Phila Pa 1976). 1993; 18(1):35-40.
29. Conselho Federal de Fisioterapia e Terapia Ocupa -cional [cited 2015 Oct 15]. Available from: http:// coffito.gov.br/nsite.
30. Baú LM, Klein AA. O reconhecimento da especialidade em fisioterapia do trabalho pelo COFFITO e Ministério do Trabalho/CBO: Uma conquista para a fisioterapia e a saúde do trabalhador. Rev Bras Fisioter. 2009; 13(2):V-VI.
Received in 07/23/2014 Recebido em 23/07/2014
Approved in 06/15/2016 Aprovado em 15/06/2016 13. Bassols A, Bosch F, Campillo M, Baños JE. Back pain
in the general population of Catalonia (Spain). Preva-lence, characteristics and therapeutic behavior. Gac Sanit. 2003;17(2):97-107.
14. Docking RE, Fleming J, Brayne C, Zhao J, Macfarlane GJ, Gareth T, et al. Epidemiology of back pain in older adults: prevalence and risk factors for back pain onset. Rheumatology (Oxford). 2011;50(9):1645-53.
15. Tomita S, Arphorn S, Muto T, Koetkhlai K, Naing SS, Chaikittiporn C. Prevalence and risk factors of low back pain among Thai and Myanmar migrant seafood processing factory workers in Samut Sakorn Province, Thailand. Ind Health. 2010;48(3):283-91.
16. Fernández-de-las-Peñas C, Hernández-Barrera V, Alonso-Blanco C, Palacios-Ceña D, Carrasco-Garrido P, Jiménez-Sánchez S, et al. Prevalence of Neck and Low Back Pain in Community-Dwelling Adults in Spain: A Population-Based National Study. Spine (Phila Pa 1976). 2011;36(3):E213-9.
17. Jiménez-Sáncheza S, Fernández-de-las-Peñas C, Carrasco-Garridoa P, Hernández-Barreraa V, Alon -so-Blancod C, Palacios-Ceñad D, et al. Prevalence of chronic head, neck and low back pain and associated factors in women residing in the Autonomous Region of Madrid (Spain). Gac Sanit. 2012;26(6):534-40.
18. Meziat Filho N, Silva GA. Invalidez por dor nas costas entre segurados da Previdência Social do Brasil. Rev Saude Publica. 2011;45(3):494-502.
19. Santos LRCS, Assunção AA, Lima EP. Dor nas costas em adultos residentes em territórios quilombolas. Rev Saude Publica. 2014;48(5):750-7.
20. Vitta A, Zapater AR, Campos RS, Padovani CR. Descon -fortos musculoesqueléticos percebidos em trabalha-dores de diferentes faixas etárias, gêneros e ocupa -ções. Fisioter Mov. 2007;20(1):29-36.
21. Bachiega JC. Sintomas de distúrbios osteomuscula -res relacionados à atividade de cirurgiões-dentistas brasileiros [master´s thesis]. São Paulo: Universidade Nove de Julho; 2009. Portuguese.