Understanding churn and its reasons: The GuestU case
A thesis submitted in fulfilment of the requirements for
the degree
Master of Economics M.Sc.
at
Nova School of Business and Economics
as a
Directed Research Internship in Cooperation with GuestU
by
Lars Uden
under supervision of
Professor Miguel Muñoz Duarte
II
Disclaimer
This disclaimer states the originality of the master thesis. The author, Lars Uden, thereby
declares the presented work to be his own and that the only references used in the process are
the ones listed. Further, this thesis has never been submitted to any other University in the
attempt of obtaining a degree.
The author is responsible for the content of the paper and also holder of the copyright. The
III
Abstract
In the age of computerisation, entrepreneurs around the world aim to revolutionise their field
with ground-breaking ICTs. GuestU is one of those offering mobile application development
to small and medium-sized tourism enterprises. To assure the young start-ups steady growth
this paper aims to identify reasons for the high customer churn risk. Primary data is used to
analyse end-user behaviour and particularly the success of acquisition and activation. Results
show troubling download quantities as well as retention rates leading to the recommendations
for GuestU to incentivise and guide their customers in increasing promotion for the
applications.
IV
Table of Contents
List of Tables ... V List of Images ... V List of PDFs ... VI List of Abbreviations ... VI
1. Introduction ... 1
1.1. Background ... 1
1.2. Problem ... 1
1.3. Disposition ... 2
2. Context ... 2
2.1. Impact of ICT on the Tourism Market ... 2
2.2. The AARRR Model - Identifying Bottlenecks in Mobile Applications ... 4
3. Methodology ... 5
3.1. Tools for Data Collection ... 5
3.2. Interviews ... 7
4. GuestU ... 7
4.1. Secondary Product - Clarice ... 8
4.2. Main Product – Mobile Applications for SMTEs ... 9
4.3. Competition ... 9
5. GuestU Performance Analysis: PART I - Acquisition ... 11
5.1. Quantitative Analysis ... 12
5.1.1. Economic Value ... 12
5.1.2. Cluster Analysis ... 13
5.1.3. Deductions ... 14
5.2. Qualitative Analysis ... 15
5.2.1. Methods of Promotion ... 15
5.2.2. Success of Individual Methods ... 17
5.3. Conclusions and Recommendations: Acquisition ... 19
6. GuestU Performance Analysis: PART II - Activation and Retention ... 20
6.1. Retention Rate Table ... 20
6.2. Comparison with other Applications ... 21
6.3. Conclusions and Recommendations: Activation and Retention ... 22
7. Conclusion ... 23
References ... 25
Appendix 1: Tables ... 30
Appendix 2: Images ... 38
V
List of Tables
Table 1: Analysis of aggregated downloads
Table 2: Applications categorised by average downloads
Table 3: Promotion tools applied by the interviewed SMTEs
Table 4: Average retention rate for the first 10 days since first use
Table 5: Average retention rates of GuestU compared to global average
Table 6: App Annie Downloads
Table 7: Aggregated Downloads Analysis including Economic Value
Table 8: Promotion methods used by interviewed customers
Table 9: GuestU retention rates
Table 10: GuestU retention compared to global average
List of Images
Image 1: Original image from Dave McClure’s presentation of the AARRR model
Images 2-7: Screenshots of My Story Hotels application exemplary of all GuestU applications
Images 2-4: Home screen, SMTE screen and Points of Interest screen
Images 5-7: Booking screen, Routes screen and Events screen
Images 8-15: Screenshots of the Booking.com free virtual travel guide for the customers
Image 8: Landing page of the travel guide
Image 9: Section 2 - Get in and around
Image 10: Section 3 - My Location
Image 11: Section 4 - Districts
Image 12: Section 5 - Attractions
Image 13: Section 6 - Restaurants
Image 14: Section 7 - City Secrets
Image 15: Section 8 - Practical Tips
Image 16: Guestfolio’s example Mobile Concierge
Image 17: Picture of GuestU promotion support for their customers
VI Image 19: Lisbon Hostel reception promotion
Image 20: Lisbon Old Town Hostel reception promotion
Image 21: Webpage Goodmorning Hostel Webpage representation
Image 22: Webpage Sant’Alfama Webpage representation Image 23: Email notification from Lisbon Old Town Hostel
Image 24: Email notification from My Story Hotels Baixa
List of PDFs
PDF 1: Template of monthly report for GuestU customers with Google Analytics
PDF 2: Template of monthly comparison for GuestU customers with Google Analytics Page 1
PDF 3: Template of monthly comparison for GuestU customers with Google Analytics Page 2
List of Abbreviations
ASO App Store Optimisation
B2B Business-to-Business
B2B2C Business-to-Business-to-Consumer
B2C Business-to-Consumer
CRM Customer Relationship Management
CRS Computer Reservation System
GDS Global Distribution System
ICT Information Communication Technology
KPI Key Performance Indicator
PR Public Relation
SaaS Software as a Service
SDK Software Development Kit
SEO Search Engine Optimisation
VII Note:
The B2B2C business model of GuestU makes a clear differentiation between customer and
users necessary to ensure easy understanding. The thesis will therefore refer to GuestU’s direct clients, hotels/hostels/apartments, as customers or SMTEs. The visitors of these
accommodations and thereby users of the applications will be referred to either as guests or
end-users according to context.
Note:
The mentioned mobile applications can be downloaded in the Google PlayStore as well as the
1
1.
Introduction
1.1.
Background
In a rapidly computerising and mobilising world, mobile applications are the embodiment of
innovation and growth. Thousands of new applications enter the app stores daily with
customised solutions for every need. At the end of July 2015 there were 1,6 million applications
available in Google’s Play Store alone1 and still there are industries falling behind in the development. The tourism industry is one of them, giving multiple areas for innovative
technology solutions.
The GuestU company tackles one of these areas by offering the development and maintenance
of customised mobile applications to small and medium sized tourism enterprises (SMTEs).
The applications aim to concentrate all information desired by travellers about their
accommodation as well as the surrounding destination in one mobile concierge directly on the
smartphone. It thereby revolutionises the travel guide with a modern information
communication technology (ICT) solution.
1.2.
Problem
GuestU is a young technology start-up typically focussed on growth and customer gain but with
an acute risk of customer churn. In October 2015 GuestU achieved its highest acquisition of
new customers. At the same time, the customer relationship management (CRM) is increasingly
busy interacting with displeased customers guided by the feedback of their guests. This puts
GuestU at risk of high rates of unrenewed contracts. The urgency of the problem is highlighted
by two customers who have recently stopped to meet their monthly obligations with GuestU.
Attaining new customers is always more expensive than retaining existing customers (Hadden,
Tiwari, Roy & Ruta, 2007) which puts GuestU under pressure to improve customer satisfaction.
This thesis aims to identify potential bottlenecks in the process to achieving end-user (hotel
guests’) satisfaction. Building upon those results, the thesis gives suggestions on how to reduce
customers’ churn risk and improve GuestU’s standing.
2
Further challenges of GuestU include the high development costs of making minor changes in
the applications due to their high quantity as well as increasing competition from strong
competitors. These challenges are taken into consideration for the recommendations as
appropriate.
1.3.
Disposition
This thesis starts with a context description which first reviews the developments and impact of
new ICTs on the tourism market and secondly depicts the AARRR model created by Dave
McClure as a guideline to identify bottlenecks in end-user satisfaction with mobile applications.
Building upon the AARRR model the methodology explains the analysis process and
legitimates the primary data from GuestU. Further it also explains the qualitative interviews
conducted. Section 4 specifies GuestU, its product and the competition. At last, sections 5 and
6 respectively analyse the success of end-user acquisition as well as activation/retention and
discuss opportunities of improvement. The conclusion characteristically summarises the
findings and gives an outlook on potential follow-up research.
2.
Context
2.1.
Impact of ICT on the Tourism Market
The first section of the context gives an overview of the information communication technology
innovations in the tourism market since the first computerisation of the market. It thereby
functions as a literature review giving basis for following analyses.
Early ICT Development: Marketing and Booking
Early ICT developments in the hospitality market targeted booking possibilities and marketing
methods. The integration and impact of global communication into the tourism market started
with the development of Computer Reservation Systems (CRSs) in the 1970s and the Global
Distribution Systems (GDSs) in the late 1980s. These allowed intermediaries, primarily travel
agencies, to supply destination information as well as booking options in a market with
otherwise overwhelming heterogeneous supply (Poon, 1993). Later, in the late 1990s the
internet and the development of search optimisation ICTs reduced the necessity of
intermediaries by reducing search costs and allowing direct booking (Buhalis and Morrison,
3
customers’ bargaining power (Kim and Lee, 2004). It also improved the SMTEs position by opening the possibility of attracting new customers with low-cost marketing strategies.
Advertising small and medium tourism enterprises was previously challenging when competing
with larger hotel chains and became easier through low-cost online representation. Nowadays
online representation has turned into a must for all SMTEs and is not sufficient. Instead it
became important to stick out of the mass via high quality online image creation (Odlyzko,
2000) as well as search engine optimisation (SEO).
Current ICT Developments: Value Creation
The increase of information available has made customers increasingly demanding about the
value of their trips (Buhalis, 2008). As a result, ICTs now should supply travel suggestions that
are warranted by reviews of other users. Alternatively, they have to enhance the value for
money of the trip by allowing communication with other travellers and locals or offering
up-to-date customised information about the destination. As a result, the latest developments of
ICT products for the tourism market no longer solely function as marketing tools for the SMTEs
or booking suppliers but they create extra value and deliver a service for the traveller (Buhalis
and Licata, 2002). An adaptation to this demand is currently observable among all major ICT
supplying companies of the tourism market (see 4.5. The Competition and Positioning). The
main criticism remaining is that implemented ICTs are often not engaged with sufficiently by
managers to guaranty their success (Law and Jogaratnam, 2005).
Advantages of ICTs for SMTEs
The development of the internet and ICTs intensely impacts the tourism market due to the
strong overlap of active internet users and the travelling population. It thereby opens up
possibilities for early adopters while holding risks for laggards. The possibilities are fourfold
(Ashari, 2014). Firstly, it supplies rapid spread of vast amounts of information to large
audiences while at the same time allowing ICTs to process the information customised to each
travellers’ needs. Secondly, the costs of creating, transferring and accessing that information is
reduced dramatically giving opportunities for scalability. Thirdly and particularly important for
tourism, it reduces the impact of geographical distance allowing for global communication.
And at last, the enhanced communication possibilities build a framework for increased
transparency in the market. SMTEs need to seize this opportunity and constantly adapt to new
4
2.2.
The AARRR Model - Identifying Bottlenecks in Mobile
Applications
Knowing that new ICTs are regularly implemented but often not engaged with sufficiently by
managers creates the necessity to identify the bottlenecks on the path to user satisfaction. In
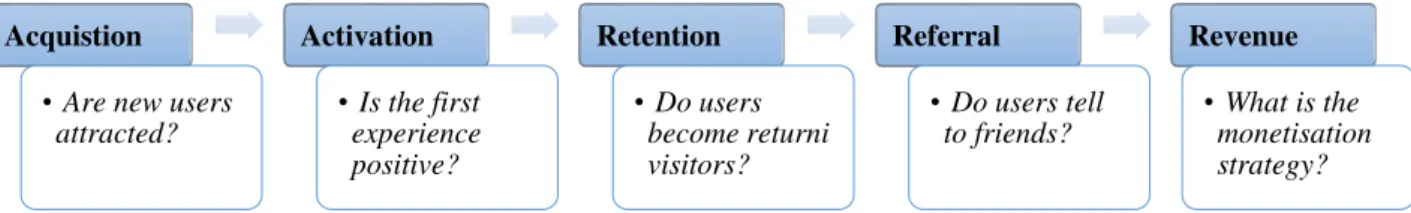
case of mobile applications, the AARRR model presented by Dave McClure2 on the 20th of June 2007 (McClure, 2007) functions as a useful framework for such analysis. Due to its name
also known as the pirate model, it has become the most popular start-up matrix to define the
measurable success steps of webpages as well as mobile application.
The model sets five chronological steps for start-ups to analyse. By doing so, a start-up can
focus its attention on the particular step in need. Figure 1 shows and explains those five steps3. They are generalised for all webpages and mobile application but need to be adapted in their
details for each individual business-case.
Figure 1: The five steps of the AARRR Model
The primary benefit of the model, is the chronological build-up which assures well-structured
analysis and thereby prevents investments into the development of currently non-relevant
activities. Improving retention rates is only reasonable after sufficient acquisition and activation
have been established. However, well-chosen and implemented actions for one segment can
retroactively contribute other parts of the matrix.
The secondary benefit of the model is direct measurability of the success of each individual
step using end-user behaviour data gathered with online tools such as Google Analytics.
Additional to these benefits, the model also suggests methods of resolution in case of step
2 He is also the founder of 500 Start-ups, a company functioning as a successful angel investor in the start-up market.
3 Image 1 in the appendix additionally shows the original figure from Dave McClure’s presentation which also includes potential solutions for each individual step.
Acquistion
• Are new users attracted?
Activation
• Is the first experience positive?
Retention
• Do users become returni visitors?
Referral
•Do users tell to friends?
Revenue
5
specific bottlenecks as seen in image 1. These solutions are focussed on direct B2C business
models though and therefore adaptions have to be made for local and small mobile applications.
3.
Methodology
This analysis aims to identify the bottlenecks in achieving end-user satisfaction of the GuestU
mobile applications in order to reduce potential risks of customer churn. It is based on primary
data from GuestU. The data contains information about the downloads as well as the usage of
the applications. After the data is quantitatively analysed on bottlenecks it is followed by
qualitative interviews that support the results and help suggest potential solutions.
The analysis is aligned to the AARRR model giving it the chronological outlook. The case
study results show significant bottlenecks in the early stages, acquisition of new users as well
as activation and retention rates. The analysis is therefore split into two analysis sections. The
first and primary investigates the acquisition of new users. It starts with a quantitative analysis
of the applications download numbers based on data from App Annie. This is followed by
qualitative interviews with concierges of eight SMTE customers of GuestU to identify the
successful methods of promotion for the applications. The second section analysis activation
and retention based on data from Liquid. The data is aggregated for all of GuestU’s applications and shows the return rate of users and thereby indicates the user satisfaction with the
application. It is compared with the average return rates of other applications based on data
from the mobile applications analysis company Quettra4.
The rest of the methodology chronologically explains the used primary data in origin, reasoning
as well as potential flaws of the data. This is followed by a short understanding of the interview
method conducted.
3.1.
Tools for Data Collection
The quantitative analysis is based on data gathered using three different online tools: App
Annie, Liquid and Google Analytics5. After the respective software development kit (SDK) of a tool is implemented into the code of an application, the tool starts to track the behaviour of
users within the application. Developers of mobile applications use multiple platforms to
4 Reference is in the section online under Chen, A. as it is retrieved from his blog. The article includes detailed information about the data as explained in section 6.
6
analyse their applications as the type of behaviour tracked only partially overlaps. GuestU is
still a young and growing technology start-up and is as such typically focussed on growth to
achieve scalability of their product. The implementation of data mining tools is complex and
time consuming therefore it is still in the development phase. This causes gaps in the data sets
that are highlighted in the following methodology description.
App Annie is the number one trusted tool by the largest mobile applications developers for
tracking downloads and revenues. According to GuestU’s head of development, Marcelino Moreno, this is because App Annie retrieves its data directly from the two largest application
stores (Google’s PlayStore and Apple’s App Store) which differentiates it from otherwise similar tools. App Annie’s data does not include all of GuestU’s applications. Table 6 shows the number of downloads measured for 109 applications since the beginning of 2015 until end
of October. The newer GuestU applications were not yet implemented with App Annie’s SDK and their data was thus not tracked. But the latest customers were obtained applying the same
measures as the previous and were not treated differently. Therefore, there is no selection bias
or structural variance in treatment and the incompleteness of the data does not affect the results.
Google Analytics not only tracks revenues and downloads but multiple other key performance
indicators (KPIs). The tracking method particular for new users/downloads differs to that of
App Annie’s which results in slightly different results6. The differences should be negligible though. Unfortunately, the implementation of Google Analytics’ SDK into GuestU’s applications still needs adjustments. As a result, the download numbers and thereby other KPIs
are not reliable and show errors particularly for downloads from Apple’s App Store. Google Analytics can therefore not be included in this analysis but holds great potential as the third
appendix and the recommendations show.
Liquid is used to analyse customer satisfaction (6. GuestU Performance Analysis: Part II) with
similar but less KPIs than Google Analytics. GuestU’s applications are newly equipped with Liquid’s SDK. The implementation started at the beginning of August 2015 and last adjustments finished on the 19th. Indifference to App Annie, Liquid includes all applications
that existed by the beginning of August which were 138 at the time. This combined with the indirect tracking system7 of new users in Liquid, causes slightly higher numbers for new users
6 Discrepancies can occur based on Google’s different tracking method. 1. Downloads conducted from two devices that are identified as having the same user only count once. 2. Users revisiting a webpage or an application after two years are considered new users rather than returning users.
7
compared to the aggregated downloads measured in App Annie. But the conclusions drawn in
the second part of the analysis are independent of those drawn in the first part making the slight
difference in base data irrelevant. Additionally, the results obtained from Liquid data are all
based on percentages or averages relative to the overall amount of users. The number of users
included therefore does not impair the conclusions. Currently Liquid only gathers aggregated
data of all applications and thereby does not allow for comparison among the applications or
cluster analyses.
3.2.
Interviews
The interviews were conducted with eight concierges and managers of GuestU customers in
Lisbon. They followed the acquisition analysis in the attempt to understand differences in
promotion methods. The interviews were conducted qualitatively and open to the comments of
the concierges allowing for the understanding of the concierge’s expertise as well as her/his evaluation of the application. Information was thereby revealed about the perceived satisfaction
of guests with the application as well as information about the success of the STME in general.
At the same, time the interviews were guided along the various promotion methods applied.
The primary question was thereby which methods were used and how they were implemented
followed by questions about which of them the concierge perceived more impactful. Personal
observations of the implementations during the interviews was additionally integrated in the
analysis. Quality of promotion could thereby be assessed by a uniform measure.
4. GuestU
GuestU is a young mobile technology start-up based in Lisbon. Originally founded in 2011
under the name XTourmaker. Today the company has 50 employees and has developed close
to 200 mobile hotel applications. The idea is a B2B2C software as a service (SaaS) business
model offering the development of custom mobile applications to small and medium-sized
tourism enterprises (SMTE’s) such as hotels, hostel and apartments. These mobile applications for smartphones include information about the respective accommodation as well as the
surrounding city or town. Additionally, a feature for direct communication between the SMTEs
concierge and the guests is intended to be implemented in the future. Thereby, it has all
characteristics of a concierge directly from the phone which is reflected in GuestU’s official
8
In the B2B2C business model the SMTEs are GuestU’s customers paying for the development and maintenance of the application while the end-users of the product are the respective
SMTEs’ guests. The payment model for the applications is a fixed monthly fee of 80 Euros which includes development as well as updates. The minimum contract duration is one year.
The added value for the hotel, hostel or apartment is increased customer satisfaction and loyalty
as well as higher quantity and quality reviews of guests. The latter becomes increasingly
valuable nowadays as reviews become easier to create and access online (Wang & Fesenmaier,
2004b). 50,2% of American travellers check user-generated content before travel and 25,4% of
them particularly check hotel reviews before booking (State of the American Traveller Survey,
2015). By increasing reviews and customers’ satisfaction GuestU applications increase future bookings and guests’ loyalty.
4.1. Secondary Product - Clarice
At the start of November 2015, GuestU launched another product, a mobile application named
Clarice. It very similarly aims to improve the information access for modern travellers but the
business model is unalike the previous. It is one single application that is independent of the
middle-man, SMTEs, but rather directly targets end-users in a B2C classification. The
application is free and the long-run monetisation plan is through advertisements once a
sufficient customer base is build
The content of the application is similar to the current applications supplying information about
the location including events, interesting sites and routes. The application not only offers
content but also supplies real-time direct communication with GuestU employees answering all
possible questions about the area. This feature differentiates the product from competitors in
the area of tourism information supply. Currently, the new product, Clarice, and the previous
applications do not interact. In the long run they are planned to be connected with the intend of
creating one application including all relevant information for tourists about accommodation
and location as well as offering the possibility of answering questions in real-time. Due to its
alternative character in application and in business model, Clarice is extracted from the
9
4.2. Main Product
–
Mobile Applications for SMTEs
The mobile applications for smartphones that GuestU offers, aim to summarise all information
the concierge or receptionist of an accommodation has and to include them into one mobile
application. It gives guests the possibility to plan their trip in advance from home as well as to
help them orientate themselves during the course of their stay. The applications are customised
to the preferences of the individual SMTE while following a modular design. Image 2, is a
screenshot of one home screen exemplary of all GuestU applications. From there the application
provides information about the hotel as well as the surrounding area. The latter is summarised
in points of interest, routes and events as seen on the home screen image. At last it offers a
direct booking option for the guests. These five main screens can respectively be seen in images
3 to 7. They are followed on the next screens by information specific to the respective events,
routes etc. The content of the applications is created and integrated by GuestU as part of the
development service. Currently, the applications are programmed for the two biggest mobile
application operating systems, Google’s Android and Apple’s IOS8.
The target groups of GuestU applications are tourists rather than business travellers on the
end-user level and SMTEs in the form of small and medium sized hotels, hostels and apartments9 on the B2B level. The user interface and content of the applications therefore focusses on
leisure-time activities and are multilingual to suite tourists struggling with language barriers.
Additionally, the content can be downloaded which allows offline usage of the applications
particularly helping tourists who often lack internet connection while travelling. This is also
one of the features making GuestU applications appealing compared to their competition.
The customer target group on the B2B level are SMTEs which aligns with the end-user target
group of tourists rather than business travellers who generally favour the consistency of large
hotel chains. GuestU’s target market therefore is the range of small to medium-sized tourism enterprises (SMTEs).
4.3. Competition
GuestU has a vast target group for their applications in SMTE’s but also great competition. They have to compete with large established companies on the general ICT market for tourism
8 Together they already had 85% market share in 2014 with increasing tendencies according to Statista. http://www.statista.com/statistics/263453/global-market-share-held-by-smartphone-operating-systems/ last retrieved: 05.01.2016
10
and with other growing companies specifically for the position of a mobile concierge service.
Virtually every company offering centralised online information about travel locations or online
booking options is potential competition for GuestU’s applications.
To understand the ICT market for tourism and travel more clearly it is useful to split it into
three target time phases: pre-stay, during stay and post-stay information supply for travellers.
GuestU primarily targets pre-stay trip planning and booking while also providing further
orientation during the course of the stay. Not included is post-stay information or services.
Post-stay remains challenging for all competitors in this market. Compared to GuestU, the
largest tourism ICT providing companies, Priceline (Booking.com) and TripAdvisor, each
started by targeting one of the time periods and only recently started to extend to the others.
Their goal is now to capture all stages of a trip and thereby increase retention and customer
loyalty. For GuestU this means a significant increase in competition.
Priceline as one of the main competitors considerably benefits from vertical integration of
travel guides into their existing booking system. Just recently they started to offer free of charge
online webpage based city guides to their customers. The link to these is send alongside with
the booking confirmation. This comes with significant economies of scope and presents a major
challenge for GuestU. The information of the guides strongly overlaps and often exceeds that
of GuestU applications. Image 8 is a screenshot of the landing page of an example guide of
Milan. It is followed by screenshot images 9 to 15 showing the individual sections of the guide.
Additionally, Priceline still benefits from the webpage based character of their guides that do
not require a download, thereby eliminating one primary obstacle when acquiring new users.
Once the new travel guides get the approval of their customers, the travel guides will be
implemented not into many but the one booking.com application. Guests will therefore only
have to download one application for all travels. Again Priceline can take advantage of vertical
integration.
TripAdvisor originally focussed on recommending restaurants based on other customer reviews.
This system has now been expanded to all travel related categories of hotels, flights and
activities thereby offering similar information as GuestU but based on customer created content.
The inclusion of hotels and flights into their portfolio automatically increased customer
engagement to the pre-stay phase of their users’ due to the necessity of in advance booking for these categories. Additionally, TripAdvisor partnered with Guestfolio10, a company focussing
11
on hotel guest relationship management, in February 201411. The company offers marketing solutions exactly for pre- and post-travel customer communication. Particularly worrisome for
GuestU is that they also offer mobile concierge solutions as exemplarily shown in image 16.
With this TripAdvisor together with Guestfolio potentially turn from general competition for
the ICT tourism market to becoming a direct competitor for the mobile concierge market.
Priceline’s guides and TripAdvisor’s new partnering build a great competitive threat to GuestU due to the companies superior established customer base and financial resources. Priceline
primarily benefits from vertical integration while TripAdvisor benefits from the attained
know-how of Guestfolio. These advantages are considered in the action recommendations for GuestU.
5. GuestU Performance Analysis: PART I - Acquisition
Acquisition is the first step along the AARRR model, so the first part of the GuestU
performance analysis. It measures the success of acquisition of end-users on the basis of
downloads per hotel application, and gives suggestions for improvement. Acquisition is also
the most demanded information by GuestU’s SMTE customers, according to José Gomes former head of CRM at GuestU. They use it as the basis to assess the value of their application.
It is therefore elementary for GuestU to encourage end-user downloads to reduce the risk of
customer churn.
The amount of acquisition can clearly be observed via quantity of downloads that an application
obtains. The evaluation of success in the quantity of downloads is more challenging. The small
and local applications of GuestU cannot be compared in their number of downloads with other
global applications. Absolute numbers of downloads are therefore only the first indicator but
give no perfect representation of success.
To overcome the lack of comparability the analysis focuses on economic value of the
applications. The number of downloads are considered relative to the monthly costs thereby
resulting in the measurement of costs per download for the SMTE customer. The analysis
concludes too low downloads and consequently too high costs.
The first step of the economic value analysis is based on averages without differentiation
between the applications (5.1.1. Economic Value). Following these results is an internal
12
comparison between GuestU’s applications that categorises them based on download quantities (5.1.2. Cluster Analysis). It identifies significant variance in download quantities and concludes
discrepancies in promotion as the reason.
In consequence, the qualitative and last part of the acquisition analysis examines which methods
of promotion are more successful in convincing guests of downloading. The conclusions and
subsequent behaviour recommendations build upon those results.
5.1.
Quantitative Analysis
The quantitative section of the acquisition analysis builds upon the App Annie data for
downloads. It concludes general demand for the applications but low downloads due to a lack
of promotion.
5.1.1.
Economic Value
Summarising the download information of the applications shows surprisingly low numbers.
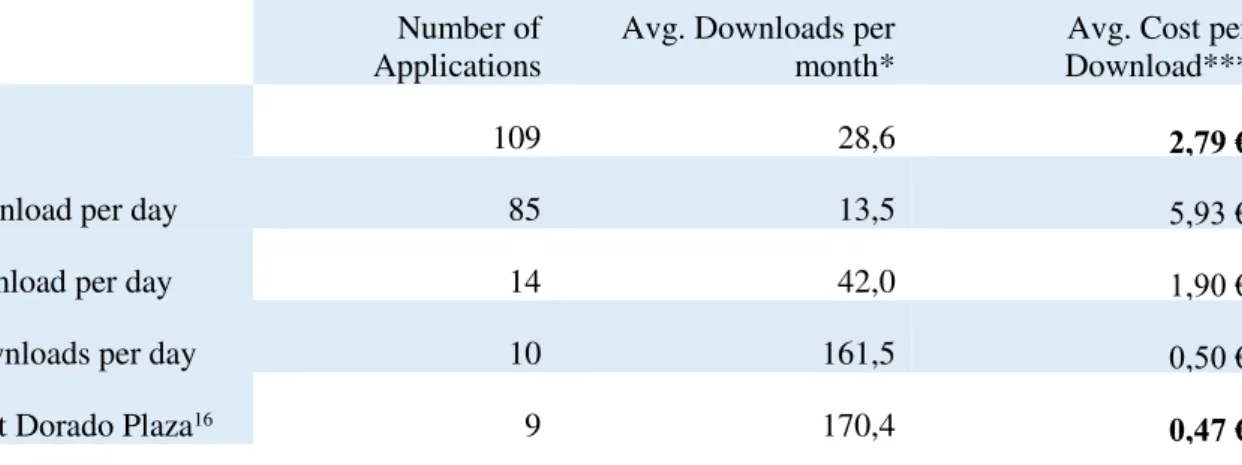
The data includes 109 applications throughout the time period of ten months as shown in table
6. The total downloads of all applications sum up to 30 419 which is an average of 276,54 per
application through the course of ten months as shown in table 1 below. Finally, that leads to
an average of 28,64 downloads per application per month which is less than one download per
day. These calculations are highlighted in table 1.12 The downloads are surprisingly low and unsatisfying for customers and thereby for GuestU.
Table 1: Analysis of aggregated downloads13
Time Horizon
Full Time Period Per Month* Per Day
Total Downloads 30419 1062,0 100,06
Downloads Per Hotel 276,5 28,6 0,91
Standard Deviation 461,7 48,5 1,59
The economic value calculation reveals high costs per download for the SMTEs. For GuestU’s customers’ the economic measure of success best presents the value of the application. Other
12 They account for the months that individual new applications were not yet implemented into the data gathering (example: Sant’Alfama) as well as for customers that terminated the contract during the ten months’ observation period (example: Naco na Pedra).
13
measures such as relative downloads per guest better reflect effectiveness in acquisition but the
economic value prevails in importance to reduce attrition.
Independent of the number of visitors a SMTE has, less than a single download a day is
economically not sufficient to justify the fixed monthly costs of eighty euros. Using the average
of 28,64 downloads per month, this sums up to 2,79 Euros for each download (see: table 2
below) which by itself does not assure a return to the application nor a satisfied end-user. The
SMTE managers as direct customers of GuestU do not have a long-run benefit of the application
with these download numbers and are at risk of terminating the contract. Therefore, it is
important to understand the root of the problem and define potential solutions.
5.1.2.
Cluster Analysis
This section builds upon the previous general analysis that concluded unsuccessful end-user
acquisition and compares the GuestU hotel applications among each other to identify the cause.
The download data shows overall lower downloads than necessary but it also indicates high
variances between each hotel applications. The standard deviation of the average downloads
per month is 48,55 around the average of only 28,64 (see: table 1 above). This points towards
substantial differences in the success of download acquisition.
To account for these differences table 2 categorises the applications into three clusters. It shows
that 85 of the 109 examined applications do not exceed one download per day building the first
cluster. The second cluster is smaller with 14 applications between one and two downloads a
day. The highest of which reaches 1,86 average downloads (Lisbon Old Town Hostel). This is
followed by a significant jump in downloads to the next application with 3,34 average
downloads (The House Boutique B&B, see table 6). Including this application there are nine14 applications that are considered the high download cluster. They achieve at least three
downloads per day averages. The sudden jump in downloads implies a substantial difference in
economic value for the top category of applications. The average cost per download for these
nine is down to 0,47 Euros (see: table 2 below). The sudden jump also implies conditions in
which guests perceive the application substantially differently than at other SMTE customers
and are consequently more willing to download. This leads to the following conclusions.
14
Table 2: Applications categorised by average downloads15
Number of Applications
Avg. Downloads per month*
Avg. Cost per Download***
All 109 28,6
2,79 €
Low: < 1 Download per day 85 13,5
5,93 €
Mid: > 1 Download per day 14 42,0
1,90 €
High: > 3 Downloads per day 10 161,5
0,50 €
High - Without Dorado Plaza16 9 170,4
0,47 €
5.1.3.
Deductions
The variance in the downloads and the success of the nine high download cluster applications
points towards two important early conclusions:
1. There is a general demand for the product. The high downloads of some applications clearly
reflect guests’ demand for the mobile concierge service and consequently indicate a lack of advertisement for the other applications. It gives no further conclusions about the satisfaction
with the product itself but shows demand. This result is of high value and leads to the follow
up question why other customers’ applications are less demanded.
2. A selected few of GuestU’s customers promote the application more successfully than others. The significant differences in the success of the acquisition process can only indicate towards
equally significant differences in the promotion and advertising of the application. There is no
reason to assume that other factors such as, the small variations between the applications,
influence the downloads. The applications can be considered as homogeneous goods. Further,
the product quality cannot be observed by the end-user before download. Consequently, only
promotion can affect the decision of download.
15
5.2.
Qualitative Analysis
The qualitative analysis builds upon the conclusions of the quantitative to identify which are
the relevant differences in the promotion between successful and unsuccessful applications. To
identify these differences, interviews with eight concierges of different SMTE customers were
conducted. The interview partners are highlighted in table 6 and depicted in more detail in table
317 below. They were chosen based on the respective download numbers aiming to interview representative customers for the different download clusters. Additionally, the SMTEs had to
be located in Lisbon to allow for personal visits18. The personal interviews also allowed for a first-hand observation of the advertising/promotion methods applied within the
accommodation.
The results of the interviews strongly support the general assumption of significant correlation
between promotion and successful acquisition and give indications of which promotion are
particularly well suited for GuestU applications.
5.2.1.
Methods of Promotion
GuestU currently supplies their customers with hardly any means to promote the applications
nor does GuestU create any incentives for their customers to promote the application
themselves. One framed print as seen on image 17 is the only document send to new customers.
In consequence, the interviews have shown that the SMTEs do their own promotion which
results in substantial variations in the methods, quantities and qualities.
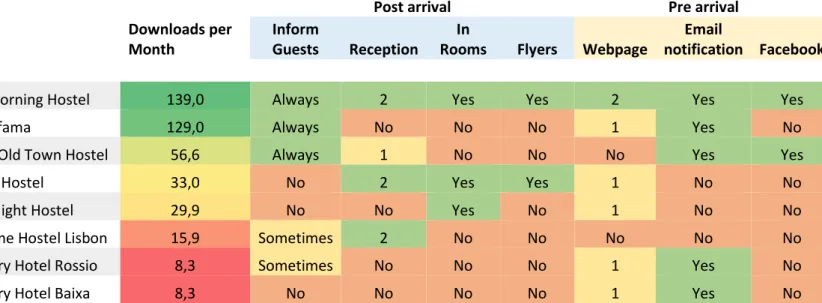
The means of promotion can be summarised in seven methods. Below table 3 lists the
interviewed SMTEs by monthly average of downloads19 and respectively indicates which of the promotion methods were implemented. Additionally, the methods are categorised as either
pre-arrival or post-pre-arrival promotion methods. GuestU applications can be used as a trip planning
tool before the start of the trip as well as for orientation during the stay. It is therefore important
to separately examine which promotion method is effective for the two phases.
17 Table 3 is a summarised version of table 8 in the appendix.
18Sant’Alfama apartments were not visited personally because it is without reception and new guests are led in personally. Instead a telephone interview was conducted with the manager.
19 The interviews also revealed the sizes of the SMTEs measured in number of beds. Table 8 includes these sizes and states the average monthly downloads per bed. The worry that SMTE size impacts the downloads does not prevail. The results are similar in ordering and categorisation to the general average downloads per month with
the exception that Sant’Alfama does even better. Further analyses therefore continue with general average
16
Table 3: Promotion tools applied by the interviewed SMTEs
1. Verbally informing visitors upon arrival in the hotel/hostel/apartment.
2. Visual information at reception about the application.
3. Visual promotion in rooms of the accommodation.
4. Flyers available to the guests at the reception.
5. Representation on the SMTEs webpage and the quality of representation.
6. Email notifications about the application previous to arrival and their quality.
7. Promotion via social media particularly Facebook.
Table 3 not only accounts for implementation itself but also for the quality of implementation
if significant differences exposed themselves because quality can strongly impact the final
success. Images 19 and 20 are exemplary of difference in quality of the visual information at
the reception and the screenshot images 21 and 22 similarly reflect quality differences in
webpage representation.
Quality was consequently evaluated for three out of the seven promotion methods: verbally
informing guests upon arrival, visual information at reception and webpage representation. The
assessments is on a simple basis: Good = 2, OK = 1 and non-existent = No. In case of verbally
informing visitors the categorisation is self-explanatory Always informing, Sometimes
informing and No not informing20.
20 More detailed explanations of the seven promotion methods as well as their evaluation are in table 8.
Post arrival Pre arrival
Name
Downloads per Month
Inform
Guests Reception
In
Rooms Flyers Webpage
notification Facebook
Goodmorning Hostel 139,0 Always 2 Yes Yes 2 Yes Yes
Sant'Alfama 129,0 Always No No No 1 Yes No
Lisbon Old Town Hostel 56,6 Always 1 No No No Yes Yes
Lisb'on Hostel 33,0 No 2 Yes Yes 1 No No
Good Night Hostel 29,9 No No Yes No 1 No No
Welcome Hostel Lisbon 15,9 Sometimes 2 No No No No No
My Story Hotel Rossio 8,3 Sometimes No No No 1 Yes No
17
5.2.2.
Success of Individual Methods
The results of the interviews support the primary hypothesis of a correlation between promotion
and downloads but more importantly they helped identify the indispensable impact engaged
concierges and managers have on acquisition. The concierges of the two high download
category customers, Goodmorning Hostel and Sant’Alfama, personally inform new guests of
the application’s benefits, assure email notifications and answer all questions remaining. Opposing these, are the Good Night Hostel, where the concierge assumed that they no longer
offered the application and the Lisb’on Hostel, where the concierges assumed the application
to currently be offline.
This aligns with the current criticism that ICTs are often technically implemented but not
sufficiently integrated by the management. The deficiency in communication impairs the
effectiveness of getting the respective applications to the end-user thereby reducing its value
for the customer. This is potentially the most relevant finding and leads to the proposal for
GuestU to increase its customer engagement by offering support and incentives to promote the
application.
The following gives a more in detail analysis of the individual effectiveness of the promotion
methods including conclusions for GuestU.
Successful post-arrival promotion methods: Verbally Informing Guests
Table 3 shows that top three of the interviewed SMTEs always inform new guests about the
applications upon arrival. Additionally, they have visual aids at the reception supporting the
verbal promotion. Interestingly, the visual aids not only help by attracting visitors’ attention but
also increases concierges’ commitment with the application. The concierge from the Goodmorning Hostel interpreted the success of their acquisition as a result of direct engagement
with the customer. She concluded that the new and free character of the application scares of
visitors because they expect in-app advertising or other inconveniences. Her solution is a
personal endorsement of the application to reassure quality. Similarly, the manager of the
Sant’Alfama apartments introduces all new guests personally into the apartments and recommends the application during the process.
Unsuccessful post-arrival promotion methods
Another conclusion of the interviews is a surprisingly low relevance of in room advertising for
18
a personal recommendation is elementary. It also aligns with the assumption that the
applications are most interesting to visitors previous to or directly at arrival in a new location
and promotions in the rooms are likely to only be noticed at the end of the first day or the next
morning.
This conclusion is consequential because in room advertisements are less applicable for hotels
than for hostels and apartments. Visitors of hotels are more likely to consider promotion in the
rooms as disturbing. Encouraging in room advertisements would therefore be problematic for
GuestU as it would require diverse and modified presentations for the various customers. It is
favourable to use other less complex and more effective methods.
Successful pre-arrival promotion methods: Email notification
GuestU aims to position its applications not primarily as an orientation tool during the travel
but as a trip planning tool that accompanies travellers from before to after the trip. Table 3
shows that of the three online pre-arrival promotion methods, email notification is most
effective. The method is utilised by the SMTE managers of the top three applications21, image 23 shows the template for the Lisbon Old Town Hostel. Important for the email notifications is
not only quality but also timing. The new competition, Guestfolio, also advocates email
notifications22 and specifies the best timing as not directly after booking but rather three days before the beginning of the trip. This puts the trip within reach while still remaining time for
planning.
Unsuccessful post-arrival promotion methods: Facebook and Webpage
Facebook or social media in general and webpage representation fail to have the wanted impact
on downloads. For Facebook it is a problem of timing. Joao Ferreira, owner and manager of the
Lisbon Old Town Hostel, explains that Facebook does not succeed at reaching the right
audience or at least not the right audience at the right time because visitors generally like or
follow his hostel on Facebook after their visit rather than before.
This analysis could not ultimately determine the potential impact of webpage representation.
The quality of representation diverged to the point of non-comparability as shown in
screenshots 21 and 22. Only the Goodmorning Hostel and the Good Night Hostel gave any
21 It is also utilised by My Story Hotels but the quality of the notification is low, image 24 (The concierge forwarded only the last part of the template). Apart from the language difficulties, the notification also contains no information about the benefits of the application nor the keywords of how to find it in the application stores. In comparison a positive example is the email notification of the Lisbon Old Town Hostel, image 23.
19
explanation of the applications’ function and of those only the Goodmorning Hostel placed that
information well on the webpage. Further, the concierges had no feedback of guests whether
they actively use the webpage to research the accommodation. Finally, for GuestU the results
of webpage representation are interesting but not consequential as the B2B2C business model
strongly reduces the ability of GuestU to actively impact the customers’ behaviour for this method of promotion.
5.3. Conclusions and Recommendations: Acquisition
The primary finding of the acquisition analysis is a general lack of downloads among the
applications only overcome by a selected few of GuestU’s SMTE customers. The low downloads consequently lead to low economic value of the applications for SMTE customers
and create the risk of a high churn rate for the young start-up company, GuestU.
The secondary finding is that high concierge engagement with the application is most impactful
in increasing end-user acquisition rates. Engaged concierges endorse the application to new
guests and send out email notifications, thereby utilising the two most effective promotion tools.
The B2B2C business model hinders GuestU from directly encouraging concierges to higher
engagement and sending out email notification but it allows GuestU to create the necessary
incentives leaving the actual realisation to the SMTEs.
Manager and concierge engagement can be increased using monthly application analysis
feedbacks as in PDF 123. The report shows the key performance indicators of the application thereby getting managers involved with the success of the application. It can be automated and
therefore send to all customers with no cost once the implementation of the Google Analytics
SDK into GuestU applications is finished. It is therefore a perfect low cost solution encouraging
engagement while showing professionalism of GuestU.
Spreading and improving email notification can be done similarly by sending GuestU’s own informative white papers to their customers. These white papers can describe best practices of
email notifications or even webpage design and thereby incentivise GuestU’s customers to
improve without directly confronting them with the problem.
Both of these methods come with slight risks as GuestU is currently only sparsely interacting
with its customers and the first approach could raise uncomfortable questions about download
20
quantities. However, they are low cost solutions improving the performance of the application.
Additionally, they are applicable to all types of customers, hotels, hostels as well as apartments
equally, while showing expertise and thereby improving the image which will prevail in the
long-run.
6.
GuestU Performance Analysis: PART II - Activation and
Retention
The second part of this analysis identifies how satisfied end-users are by measuring their
retention rate to the application. This is particularly measured by analysing the return rates of
users to the applications during the first days since download. After the previous section
recognised significant difficulties in the acquisition of new users, this section studies the
behaviour after download. It compares primary data of GuestU applications with secondary
data from Quettra24 identifying low activation and retention rates. The data from Quettra is based on 125 million android devices worldwide and tracks all applications on these devices.
The particular data set in use is based on the first five months of 2015.
After guests are successfully encouraged to download the application, the next elementary step
to guarantee long-run retention is to assure a satisfying first use of the application. In the
AARRR model this is considered activation which results in a second and third return to the
application and builds the basis for a long-run loyal consumer. The long-run aspect remains
particularly challenging for GuestU applications, as the usefulness of the applications for the
guests is constrained by the duration of the trip. With the end of the trip, the information about
the destination contains no further value and the application is therefore no longer opened. The
users of the applications will consequently change constantly. But even with this in mind, the
best indicator for end-user satisfaction is the retention rate of the users meaning whether and
how much they re-use the application.
6.1.
Retention Rate Table
Table 9 is the most pertinent table to understanding return rates and thus customer satisfaction.
It shows the amount of new users aggregated among all GuestU applications for each day. The
following percentages then indicate what proportion of those new users re-open the application
21
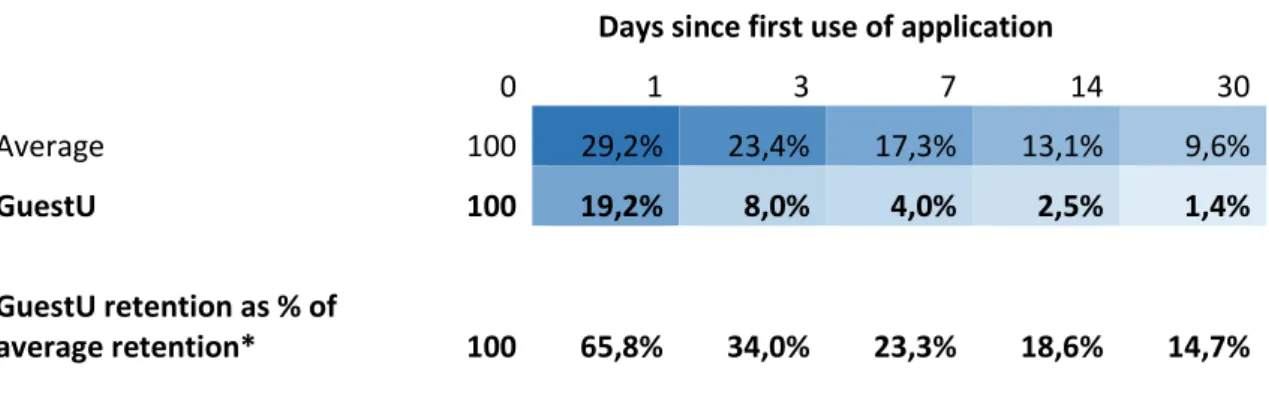
through the course of the following days. Table 4 below shows the average retention of the data
in table 9 and thereby the average daily retention rate among all GuestU applications.
The data from Liquid indicates low return rates of the users as is shown in table 4 below. The
average return rate for the first day after download is only at 19,2%. Through the course of the
next days this further reduces. On the second day only 11,1% re-access the application and on
day three only 8,0%. Afterwards the average retention rate among the applications stabilises
until the end of the full week since download, were it settles at 4,0%. A full week after the
original download of the application the usage significantly drops again to end up below 2,5%25. Table 4: Average retention rate for the first 10 days since first use
Days 0 1 2 3 4 5 6 7 8 9 10
Average 100,0% 19,2% 11,1% 8,0% 6,1% 5,2% 4,5% 4,0% 3,4% 3,0% 2,4%
6.2.
Comparison with other Applications
The comparison with other applications highlights the problematic situation. The proportion of
applications in the app stores only used once after download was steadily between 20% and
26% during the last five years26 ending at 25% in 2015 (Statista.com). This means that 75% of mobile application downloads in 2015 resulted in at least one return visit to the application.
Table 4 above indicates significantly lower return rates for GuestU applications even though
direct comparison is not possible27.
The next table 5 below, allows for better comparison. It uses the same data from Liquid for
daily retention rates for GuestU applications and directly compares it with big data collected by
Quettra. The comparison highlights the deficits GuestU applications have in keeping users
engaged. Already on the first day after installation they can only retain 19,2% of their users
compared to the 29,2% average of global applications studied by Quettra. That is only
two-thirds (65,8%) success in activation compared to the global average. This further decreases
drastically to only slightly above one third (34%) for day three. As expected due to the time
25 This information and more detailed and extensive data in the appendix table 10.
26 From 2011 to 2015 chronologically: 26%, 22%, 22%, 20%, 25%. Applications only accessed once throughout the first six months after download. http://www.statista.com/statistics/271628/percentage-of-apps-used-once-in-the-us/ last retrieved 05.01.2016
27 The Liquid data from table 4 cannot simply be aggregated and directly compared to the general statistic of 75% activation rate, for two reasons. First, return users on day two, three, four etc. can and are likely to be the same as on day one and would therefore be calculated multiple times. And users re-using the GuestU
22
constrained of each trip, the retention decreases continuously and faster than the global average
ending at only 14,7% a month after installation. At this point, 30 days after download the
retention rate itself is down to 1,4% and thereby nearly negligible.
Table 5: Average retention rates of GuestU compared to global average28
Days since first use of application
0 1 3 7 14 30
Average 100 29,2% 23,4% 17,3% 13,1% 9,6%
GuestU 100 19,2% 8,0% 4,0% 2,5% 1,4%
GuestU retention as % of
average retention* 100 65,8% 34,0% 23,3% 18,6% 14,7%
*Indicates the acquisition success of GuestU compared with global average. Particularly, it
considers the GuestU retention as percentage of average retention.
6.3.
Conclusions and Recommendations: Activation and Retention
The overall conclusion is lack of success in activation. GuestU applications already reach lower
than global average retention rates on the first day and as expected further decreases over time.
Considering the new character of GuestU and its applications this problem could be expected
and can be considered part of the development phase. To identify solutions for GuestU, the
retention rates can be segregated into three major time periods that need to be compared with
other global applications: 1. Activation – The return rate to the application on the first day after download. 2. Short-run – The period until a full week after download. 3. Long-run – The period from 30 days after download.
Activation - Return rate to the Application first day after Download
The low return rate of users on the first day since download indicates an unsatisfying first use
of the application or in terms of the AARRR model: problems in activation. With below 20%
activation rate on the first day, GuestU applications are significantly below world average and
far from the most successful apps. Table 10 shows that for the top 100 application nearly half
of the users return on the first day (48,7%). GuestU applications’ low return on the first day
indicates a failed end-user activation due to unsatisfying first engages with the applications.
23
While this could be due to disfavoured content, it is more likely to be due to a user-unfriendly
interface. Solutions require a change of interface or a guided first visit to the application with
instructions leading to first benefits for the user. The latter is already implemented in the new
Clarice application and is increasingly common among growing applications. Unfortunately,
user interface changes as well as a guided first visit require extensive changes of the
applications code which is time intense due to the great amount of applications.
Short-run– The period until a full week after download
The short-run retention after the download decreases as expected but it also indicates a
remainder of satisfied users. There is an immediate downfall of retention from the first to the
second day and again to the third day but afterwards the retention rate stays around five percent
until the end of the week. This can be interpreted as a remainder of satisfied users successfully
engaging with the application. This conclusion is of high value because, if verified, it proofs
that the application itself is useful once accustomed with it and that the problem actually is in
the activation.
Long-run– The period from 30 days after download
GuestU applications show no utility for users in the long-run. 30 days after download only 1,4%
of the original users open the application while other applications reach 9,55% in average. This
result is no surprise as the trip planed is generally over at this point and the application is no
longer of use. This is a problem inherent to the industry and makes these long-run comparison
with other industries difficult. GuestU’s competition is eagerly searching for solutions to this problem by keeping users engaged past the trip and encouraging them to share their experience
and connecting to social media.
7. Conclusion
GuestU is a young and growing start-up offering an ICT solution for the tourism industry that
fills a contemporary demand but the company suffers from realisations issues causing high
churn risks. The B2B2C business model with monthly fees requires satisfied SMTEs and
therefore satisfied end-users to assure contract renewal and a steady growth of GuestU.
The analysis revealed significant problems in acquisition as well as activation/retention of
end-users. Problems in acquisition are due to a lack of promotion and particularly concierge
24
different interaction methods of GuestU with the SMTE customers with the goal of
incentivising an internal improvement of promotion. The first recommendation is a monthly
feedback based on Google Analytics with the intent to increase concierge engagement with the
application. The second recommendation is the distribution of informative white papers to the
customers with the intent of guiding them in the promotion process. This should particularly
focus on effective email notifications. Both recommendations support the managers of the
SMTEs while not passing over their heads. They also align with the chronological character of
the AARRR model setting the current focus on improving acquisition.
Problems in the activation and retention have only been discovered in this analysis without
identifying their reasons. Further research in this direction is recommended particularly in two
ways. First, a cluster analysis of the end-user retention. Such an analysis among the applications
will potentially reveal similar results as Part I of this analysis allowing to identify which
applications are more successful and why. To make this possible the Liquid implementation
needs slight changes to allow for the retrieval of application names. With that a differentiation
between the applications and thereby a cluster analysis is possible. The second approach are
personal interviews with end-users/guests. The current low acquisition rates do not allow for
successful personal guest approach but rather suggest surveys through the applications
themselves. This allows for low cost questionnaires and direct feedback even though the
implementation is complex and time consuming.
An alternative solution to increase activation is the guided first use of the applications as already
implemented in the Clarice application. The problem here remains that integrating guided
introduction tours or changing user interfaces to increase activation and retention is time
consuming due to the high quantity of applications GuestU has and should therefore be
well-planned.
GuestU has a strong position in an open-minded market with huge growth potential but to assure
steady development a more detailed understanding of end-user behaviour is necessary. The
newly implemented analysis tools give the necessary foundation to identify bottlenecks on the
path to user satisfaction. Together with the AARRR model they have to be used to guarantee
constant improvement and consequently a reduction of the churn risks. With this GuestU will
improve its competitive position and continue on its path to revolutionising the common
25
References
Academic papers
Ashari, H. 2014. “Improving SMTEs’ Business Performance through Strategic Use of Information Communication Technology: ICT and Tourism Challenges and
Opportunities.” International Journal of Academic Research in Accounting, Finance and Management Science, 4(3): 1–20.
Buhalis, D. & Law R. (2008). “Progress in information technology and tourism
management: 20 years on and 10 years after the Internet—The state of eTourism research.” Tourism Management, 29(1): 609–623.
Buhalis, D. 1998. “Strategic use of information technologies in the tourism industry.” Tourism Management, 19(5): 409-421.
Buhalis, D., & Licata, M. C. (2002). “The future eTourism intermediaries.” Tourism Management, 23(3): 207–220.
Kim, W.G., & Lee, H.Y. 2004. “Comparison of web service quality between online travel agencies and online travel suppliers.” Journal of Travel & Tourism Marketing, 17(2/3): 105–116.
Law, R. & Jogaratnam, G. 2005. “A study of hotel information technology
applications.” International Journal of Contemporary Hospitality Management, 17(2): 170–180.
Morrison, A.M., Jing, S., O’Leary, J.T., & Lipping, A.C. 2001. “Predicting usage of the Internet for travel bookings: An exploratory study.” Information Technology & Tourism, 4(1): 15–30.
Sigala, M., Airey, D., Jones, P. & Lockwood, A. 2001. “Multimedia use in the UK tourism and hospitality sector: training on skills and competencies”, Information Technology and Tourism, 4(1): 31-39.
Wang, Y. & Fesenmaier, D., 2004b. “Towards understanding members’ general