AR
TICLE
1 Departamento de Nutrição, Universidade Federal de Sergipe. Av. Marechal Rondon s/n, Jardim Rosa Elze. 49100-100 São Cristóvão SE Brasil. [email protected] 2 Embrapa Tabuleiros Costeiros. Aracaju SE Brasil.
Factors associated with food insecurity risk
and nutrition in rural settlements of families
Abstract Food insecurity occurs when the right to food in adequate quality and quantity on a regular basis is disrespected. This study aimed to identify food and nutrition insecurity (FNI) and its possible association with socioeconomic and dietary variables in rural settlements of Sergipe. We verified food insecurity through the Brazilian of Food Insecurity Scale and associations via odds
ratio multivariate regression analysis. We
evalu-ated 179 families from four rural settlements in the state of Sergipe. An FNI prevalence of 88.8% was identified (48.6% light insecurity, 25.1% moderate and 15.1% severe). An adjusted statisti-cal association was found between FNI and vari-ables family income per capita (ORa = 3.11, p = 0.008) and food variety (ORa = 2.73, p = 0.004). Families showed high prevalence of food and nu-tritional insecurity, determined by low income and low variety of food in this population. It is essential to implement more effective and compre-hensive public policies that actually ensure food security, also aiming at nutrition education and greater food production opportunities.
Key words Rural settlements, Food security, So-cioeconomic factors
Jamylle Araújo Almeida 1
Amaury Silva Santos 2
Maria Adriana de Oliveira Nascimento 1
José Valter Costa Oliveira 1
Danielle Góes da Silva 1
A
lme
ida J
Introduction
According to Law 11.346/2006, Food and Nutri-tion Security (FNS) includes the realizaNutri-tion of the universal right to regular and permanent access to quality food in sufficient quantity, without com-promising access to other essential needs, based on health-promoting food practices that respect cultural diversity and are environmentally,
cultur-ally, economically and socially sustainable1.
Food insecurity measured according to the Brazilian Food Security Scale (EBIA) ranges from the lightest level, where there is concern about the uncertainty of access to food, to the most serious level, characterized by hunger. The UN estimated that, in 2013, 867 million people worldwide were chronically undernourished and 70% of people living in Food and Nutrition Insecurity (FNI)
were from rural areas2.
In Brazil, despite the reduction when com-pared to 2004, 22.6% of households are in some level of food insecurity, which represents 52 mil-lion people. The rural area shows prevalence of food insecurity higher than the urban area, and the Northeast has the highest percentages of food insecurity in Brazil, as well as the highest percent-age of families in moderate or severe food
insecu-rity in the Brazilian rural area3.
An important part of the rural population is in the settlements, since it represents almost 1 mil-lion of Brazilian families. In addition, it promotes an increased food supply and a decreased rural exodus. The Northeast accounts for about 30% of these families, but with only 11.2% of the hectares
allocated to settlements in Brazil4.
In Sergipe, most of the settlements are locat-ed in low-fertility soils, dry climate and low in-frastructure and are far from economically active
areas5. Although agrarian reform is a project of
national relevance with a high-level commitment in its implementation, land appropriation is no
guarantee of food security6-8.
Studies have shown the relationship of FNI with lower family income, low schooling, greater number of household residents, inadequate ba-sic sanitation, lack of employment relationship
and higher prevalence among rural families9. As
for food intake, besides the quantitative restric-tion identified by the Brazilian Food Insecurity Scale (EBIA), FNI has also been associated with a lower dietary quality, with lower consumption of protein-rich foods (belonging to the group of legumes, milk and derivatives, meat and eggs) and regulators (fruits and vegetables), as well as
great-er lack of meals and glycidic uptake9.
The importance of a healthy and adequate diet for the promotion of health and the prevention of diseases by both nutrients’ deficit and excess is
known10.
Considering the eradication of hunger as a
goal of the millennium2, the vulnerability of rural
settlements and the importance of the topic for the formulation of more effective public policies, this study aimed to evaluate the association between food insecurity and dietary and socioeconomic variables of families in rural settlements in Sergipe.
Methodology
This cross-sectional analytical study was part of the research project “Participatory Experimen-tation and Agroecology in Rural Settlements of Sergipe” under the coordination of EMBRAPA Coastal Tablelands in partnership with the Feder-al University of Sergipe. Socioeconomic, anthro-pometric, dietary and food insecurity data were collected between May 2011 and 2013.
The study population consisted of 179 fam-ilies, out of 184 famfam-ilies, belonging to four set-tlements located in Sergipe regions, such as the São Sebastião (ARSS, Pirambu, Eastern Ser-gipe), the José Gomes da Silva (ARJGS, Lagarto, Central-South Sergipe), the Novo Marimbon-do (ARNM, Tobias Barreto, Central-South Ser-gipe) and the José Felix de Sá (ARJFS, Aquidabã, Mid-hinterland of Sergipe). According to the National Institute for Colonization and Agrarian Reform (INCRA), 170 families benefited from agrarian plots in these four settlements, however, during collection, we noted that some children of the beneficiaries formed families and built resi-dences within the parents’ plot, which justifies a
larger number of participants in the survey11.
Properly trained personnel carried out data collection, thus, it was necessary for researchers to remain in the settlements for a few weeks due to the difficult access and distance of locations.
Families were visited in their homes and, af-ter signing the Informed Consent Form, the head of the family, he/she who contributed with the highest income, answered a previously structured socioeconomic questionnaire and the 24-hour re-minder. In addition, a method adapted and vali-dated for the Brazilian urban and rural population used by the Brazilian Institute of Geography and Statistics (IBGE) for National Household Sample Survey (PNAD) was also applied.
eco-aúd
e C
ole
tiv
a,
22(2):479-488,
2017
nomic constraints in the last three months. The following cutoff points according to affirmative answers were considered for families with mem-bers under 18 years of age: 1-5 light insecurity (LI), 6-10 moderate insecurity (MI) and 10-15 severe insecurity (SI). For families without chil-dren under 18 years of age, affirmative answers cutoff points were: 1-3 LI, 4-5 MI, 6-8 SI, and no affirmative response was considered as food
security for both cases12. Food security or
inse-curity situation was adopted as a dependent vari-able. Anthropometric measurements were also performed on all family members, totaling 706 people.
The socioeconomic variables investigated refer to schooling, profession, age, gender and monthly income of residents of each household, as well as participation in some type of Govern-ment Cash Transfer Program (CTP). The crite-rion adopted in this paper for the definition of poverty and extreme poverty lines uses cut-off points designated by the World Bank, where US$ 1.00 per day per person is the extreme poverty line and US$ 2.00 per day per person is the
pov-erty line13, calculated from the total family
in-come, including CTP amounts.
For greater reliability, the 24-hour reminder was applied with the help of a photo album with portions of various foods of varying size made
from several other albums14-17.
Nutrient intake and food groups were esti-mated using the Nutrition Data System for Re-search software (NDSR, Version 2011, Minneap-olis, University of Minnesota), a computerized diets analysis program. The nutrient content data of the software were compared to the Food Composition Table (TACO), and when less than 80% or in excess of 120% were corrected
accord-ing to the value found in the reference table18.
The evaluation was based on the Dietary
Refer-ence Intake19 and according to the Brazilian Food
Guide10.
A varied diet is one consisting of at least five food groups, excluding oils and fats and sweets and sugars groups.
As for anthropometric measures, BMI was calculated for adults and elderly and BMI/age for children and adolescents, identifying the nutri-tional status. Diagnosis was based on WHO
rec-ommendations20.
Tools used were Lider electronic scale, P-150M model, with capacity of 150 kg, with 100g scale; Alturexata portable stent with bilat-eral scale of 35 to 213 cm and 0.1cm resolution; Sanny Medical measuring tape in flat steel with
0.5cm width and 0.1cm precision and; Lange® adipometer developed by Cambridge Scientific Industries, USA.
Statistical analysis was performed with IBM SPSS Statistics 16.0 software. Descriptive analyzes were performed to characterize population, Pear-son’s chi-square test and gross and odds ratio-ad-justed prevalence ratios, which were applied to investigate the association between independent (socioeconomic, dietary and anthropometric) variables with prevalence of food insecurity. Associations with p < 0.20 were selected for the adjusted multivariate regression model, with a statistical significance of p < 0.05 and CI of 95%.
For better statistical adjustment, dependent variables were classified into two groups: 1) Food and Nutrition Security and Light Food Insecurity (FNS – LFI) and 2) Moderate and Severe Food Insecurity (MSFI). Research was approved by the Ethics Committee for Research with human be-ings, Federal University of Sergipe.
Results
In these settlements, lands are mainly geared to agriculture, while only a small part is destined to cattle raising. Its main common crops are maize, beans and manioc. These foods are gen-erally used for subsistence, but are also marketed at street markets when they exceed production. Regarding cultivation, vegetable gardens are set in some houses, aiming the local commerce. The use of agrochemicals is common practice, and these are bought by the farmers themselves in agricultural houses, not always with the correct technical recommendation.
They have incomplete infrastructure, with electric power, but not all have piped water, solid waste disposal and sewage treatment. Settlements lack operational schools or health centers, there-fore, it is necessary to move to neighboring com-munities. Settlements leisure activities are mainly to go to bars, football games, local festivities and religious mass.
A
lme
ida J
sample was reduced to 177 individuals. The most common family composition was a couple with children (62.6%). It is important to note that no head of household had access to higher educa-tion and 78.2% had incomplete elementary edu-cation. In addition, 19% of households were clas-sified below the poverty line (extreme poverty).
While none of the settlements studied have schools, when compared to schooling between heads and children of the family, children have higher schooling, with 1.9% of illiteracy, 11% of incomplete secondary education and 0.6 % at-tending higher education, corroborating results
from other studies21.
The prevalence of food insecure families was 88.8%, of which 48.6% with LFI, that is, with uncertainty regarding access to food in the fu-ture, 25.1% with MFI, indicating a qualitative and quantitative food restriction for adults, and 15.1% with SFI, meaning a quantitative restric-tion even for children, with possible hunger
epi-sodes22. Cronbach’s alpha reached 0.91, which is
excellent, showing that questions were answered
Table 1. Characterization of food, sociodemographic
and socioeconomic insecurity of settled families. Sergipe, 2014.
Characterization N Frequency (%)
Food (in)security
Food Security 20 11
Light Insecurity 87 49
Moderate Insecurity 45 25 Severe Insecurity 27 15 People in the household
≤ 4 121 68
5 – 6 35 19
≥ 7 23 13
Cash Transfer Beneficiaries
Yes 149 83
No 30 17
Family Composition
Couple without children 27 15 Couple with children 112 63 Single mother with children 13 7
Other relatives 27 15
Income per capita
Extreme poverty 34 19
Poverty 47 26
Above poverty line 98 55
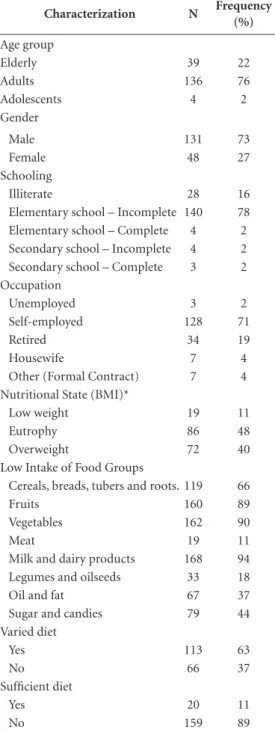
Table 2. Sociodemographic and nutritional
characterization of heads of settled families. Sergipe, 2014.
Characterization N Frequency
(%)
Age group
Elderly 39 22
Adults 136 76
Adolescents 4 2
Gender
Male 131 73
Female 48 27
Schooling
Illiterate 28 16
Elementary school – Incomplete 140 78 Elementary school – Complete 4 2 Secondary school – Incomplete 4 2 Secondary school – Complete 3 2 Occupation
Unemployed 3 2
Self-employed 128 71
Retired 34 19
Housewife 7 4
Other (Formal Contract) 7 4 Nutritional State (BMI)*
Low weight 19 11
Eutrophy 86 48
Overweight 72 40
Low Intake of Food Groups
Cereals, breads, tubers and roots. 119 66
Fruits 160 89
Vegetables 162 90
Meat 19 11
Milk and dairy products 168 94 Legumes and oilseeds 33 18
Oil and fat 67 37
Sugar and candies 79 44 Varied diet
Yes 113 63
No 66 37
Sufficient diet
Yes 20 11
No 159 89
* Considering a sample size of 177 heads of household.
aúd
e C
ole
tiv
a,
22(2):479-488,
2017
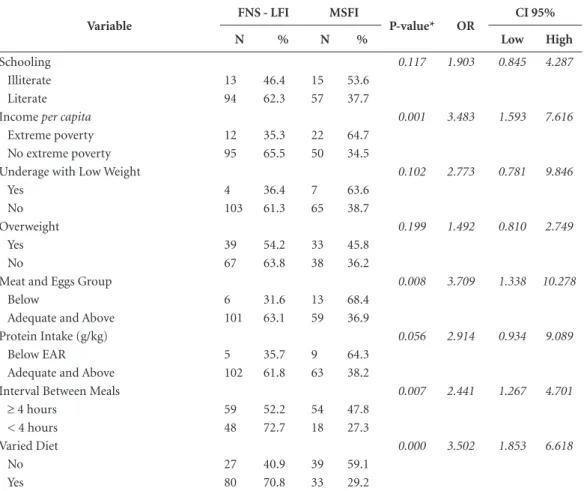
Associations between variables are described in Table 3. A statistical association was found be-tween Food and Nutrition Insecurity (FNI) and variables per capita family income, meat and eggs group intake, interval between meals and varied diet.
There were no associations with significant differences between food insecurity and energy intake, schooling, protein intake (g/kg) and with regard to the number of household residents. There were also no associations between being a beneficiary or not of a Cash Transfer Program (CTP) and gender of the head of the family and FNI.
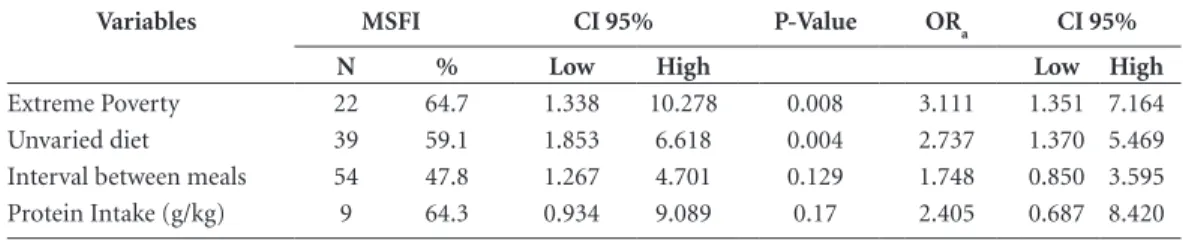
In Table 4, we can observe the odds ratio and the 95% confidence interval of FNI determinants
in the final model of the adjusted regression. Variables that remained related to food insecu-rity were unvaried diet and per capita income “extreme poverty” that were, respectively, 2.7 and 3.11 times more likely to be in MSFI. Cate-gories interval between meals and protein intake remained in the model for better adjustment of variables.
Discussion
The main findings of this study include the iden-tification of high FNI rates (88.8%) in rural set-tlements in Sergipe and the relationship of this situation associated with low income and low
Table 3. Gross Odds Ratio (OR) and Confidence Interval (CI) for food (in) security according to variables related
to family and data of the head of the household in rural settlements. Sergipe, 2014.
Variable
FNS - LFI MSFI
P-value* OR
CI 95%
N % N % Low High
Schooling 0.117 1.903 0.845 4.287
Illiterate 13 46.4 15 53.6
Literate 94 62.3 57 37.7
Income per capita 0.001 3.483 1.593 7.616
Extreme poverty 12 35.3 22 64.7
No extreme poverty 95 65.5 50 34.5
Underage with Low Weight 0.102 2.773 0.781 9.846
Yes 4 36.4 7 63.6
No 103 61.3 65 38.7
Overweight 0.199 1.492 0.810 2.749
Yes 39 54.2 33 45.8
No 67 63.8 38 36.2
Meat and Eggs Group 0.008 3.709 1.338 10.278
Below 6 31.6 13 68.4
Adequate and Above 101 63.1 59 36.9
Protein Intake (g/kg) 0.056 2.914 0.934 9.089
Below EAR 5 35.7 9 64.3
Adequate and Above 102 61.8 63 38.2
Interval Between Meals 0.007 2.441 1.267 4.701
≥ 4 hours 59 52.2 54 47.8
< 4 hours 48 72.7 18 27.3
Varied Diet 0.000 3.502 1.853 6.618
No 27 40.9 39 59.1
Yes 80 70.8 33 29.2
A
lme
ida J
food variety. When compared to data published by PNAD (2014), the prevalence of FNI found in this study was more than triple the average found in Brazil (22.6%) and considerably higher than the prevalence found in the Northeast (38.1%), . The moderate and severe food insecurity in this study is 40.2%, much higher than the rural
ar-eas of the Northar-east (20.1%) and Brazil (7.8%)3.
With regard to other settlements in different re-gions of the country, whose percentage of MSFI ranges from 0 to 22%, we note that the preva-lence presented in this study is a matter of much
greater concern6,7,8,21,23. The low food production
during the collection period may have probably exacerbated these percentages, especially due to water scarcity caused by frequent droughts in the studied region, considering that, in 2013, the worst drought in the last 30 years left 1,228 mu-nicipalities in the northeast region in a state of
emergency24.
The FAO Statistical Yearbook (2013) report-ed that, between 2010 and 2012, 19.1% of the world’s population suffered from deprived access to food, with a higher percentage in low-income countries and a higher concentration in Africa (28.9%) than in developing countries (22.5%). When viewed in more detail, it is possible to identify that North Africa has a much lower per-centage (5.8%) than sub-Saharan Africa (33.3%). Countries with the worst rates are Burundi (81.4%), Cameroon (77.8%), Eritrea (75.4%), Somalia (74.3%), which are close to the percent-age found in this study, and Zambia (56.3%), all of these Africans, in addition to Haiti (53.2%),
located in Central America2.
The lack of association between FNI, energy intake and body composition variables may re-flect the nutritional transition, demonstrating
that FNI is not necessarily characterized by mal-nutrition anymore. Some studies have already identified a relation between food insecurity and overweight, since it has increased in the econom-ically disadvantaged classes, probably due to the acquisition of foods with low nutritional value
and high caloric density at lower prices9,25,26.
In contrast to other studies9,27-30,
school-ing showed no association with FNI, probably because this population is very homogeneous regarding low schooling, a result also found in
other settled populations7,21,31. Low schooling
contributes to people generally not getting well paid work opportunities outside the settlements, not promoting increased income and decreased food insecurity. At the same time, there is hope for improvement, since an increasing number of children and adolescents are achieving higher levels of schooling, which may reflect improve-ments in relation to the current situation.
The lack of association between FNI and gender of the head of the family goes against other studies that found the greatest
vulnerabil-ity to FNI when family head was female27,30. In
this study, the prevalence of the same profession (farmers) with similar conditions to produce food and the low prevalence of female heads of house-hold with child and without spouse influenced this result. However, it should be noted that, in general, when women are recognized as the re-ceiving beneficiaries of funds from cash transfer programs, families are strengthened, as there is an acknowledgment that funds will be obtained for their benefit. In addition, they prioritize the diet of children and when food is insufficient, as in the case of this study, there is a need to support women even more so that they can feed them-selves and ensure family sustenance. However, it
Table 4. Gross odds ratio adjusted by multivariate logistic regression for moderate and severe food insecurity in
rural settlement families. Sergipe, 2014.
Variables MSFI CI 95% P-Value ORa CI 95%
N % Low High Low High
Extreme Poverty 22 64.7 1.338 10.278 0.008 3.111 1.351 7.164 Unvaried diet 39 59.1 1.853 6.618 0.004 2.737 1.370 5.469 Interval between meals 54 47.8 1.267 4.701 0.129 1.748 0.850 3.595 Protein Intake (g/kg) 9 64.3 0.934 9.089 0.17 2.405 0.687 8.420
aúd
e C
ole
tiv
a,
22(2):479-488,
2017
is perceived that, even with several public policies stimulating women empowerment, this is still far from the truth in many rural areas.
It is known that low family income is one of
the main determinants of FNI.9,27-30,32,33 In this
population, the average monthly income was R$ 651.00 (US$192,69) , a figure slightly lower than the minimum wage in force in 2013, which was R$ 678.00 (US$ 200,59). Some 83.2% of the fam-ilies received some type of government CTP. Of
these, 73.7% received the Bolsa Família (Family
Grant) Program (PBF). It is important to high-light the role of this program toward improving family income and its effectiveness in reducing
FNI34. Possibly, without the presence of CTPs,
the situation of food insecurity would have been even worse, since some families declared that this was the only source of fixed income.
Nevertheless, while increased income de-creases the possibilities of FNI due to increased purchasing power and that most of the income has been shown to be geared to the purchase of
food35, several studies indicate that improved
in-come does not necessarily imply better diet
qual-ity26,35-38 and nutritional status39. A study by the
Brazilian Institute of Social and Economic Anal-yses (IBASE) which identified the repercussions of the PBF on the food security of beneficiary families found an increased purchase of sugars, cookies and other industrialized products, as well as a preference for food purchases that children
enjoy most35. Another study carried out with the
PBF beneficiary population in the city of Curiti-ba found a monotonous diet and low consump-tion of fruits, vegetables and dairy products, a
result similar to this study36.
In this study, it was observed that, among the food groups with intake below the recom-mended minimum, fruits (89.4%), vegetables (90.5%) and milk and derivatives (93.9%) stand out. These data reflect a high percentage of inad-equacy for several nutrients such as fiber (90%), vitamin A (77.1%), C (73.7%) and E (96%), as well as minerals such as calcium (86%), magne-sium (90%) and potasmagne-sium (91.6%) (data not shown). It is important to note that adequate in-take of these nutrients can reduce the risk of car-diovascular disease, improve plasma cholesterol levels and increase the efficiency of the immune
system16.
The most consumed food groups were meat, legumes, oils and fats (considered by the high frequency of foods prepared by frying and con-sumption of margarine cited by 29.05% of the population), as well as the group of sweets
(rep-resented mainly by white sugar, 91.6%, frequent-ly used in the preparation of coffee) and the group of cereals, pasta, roots and tubers, where the most cited foods were couscous (67.03%), manioc flour (59.7%), white rice (79.3%) and white bread (56.98%).
It is important to mention that the food pro-duced in the agrarian lots was basically corn, beans and manioc, in addition to a small produc-tion of vegetables and fruits. However, prefer-ence is given to trade in free markets. Associating these factors, we can understand the low intake of fruits, vegetables and milk and dairy products in this population. Possibly, the inadequate con-sumption of nutrients by the head of the family is due to the unavailability of all the food groups at home, suggesting that a similar consumption by other members of the family.
These results are similar to those of the Family Budget Survey (POF) in the years 2002-03 and 2008-09, which identified a declining consumption of fruits and vegetables, becoming insufficient, and excess calories from sugar and saturated fat in the diet of Brazilians, as well as a greater consumption of rice, beans, legumes, roots and tubers in rural areas and manioc flour in the Northeast. The consumption of milk, fruits, vegetables and meats has been shown to increase with income, unlike beans, tubers and
roots40,41. A high inadequacy for vitamins A, C, E,
calcium and magnesium was also identified for age group from 19 to 59 years, regardless of the
household being urban or rural42.
In this study, we understand that having a var-ied diet implies the ingestion of five food groups of the six main ones (fruits, vegetables, legumes, cereals, meats and milk and derivatives). This invariably requires not only a satisfactory family income of individuals, but also the existence of good eating habits, valuing food diversity, issues that are not always directly correlated.
addi-A
lme
ida J
tion to the easy understanding by the respondent and low cost, it is more frequently used in stud-ies, including in national surveys, which allows greater reliability in the comparison of results. It should be noted, however, that this study reports a household survey conducted in four agrarian reform settlements located in three different re-gions of the state. It is possible that data shown represent the reality of other settlements in the region. In addition, it is unheard of to identify low dietary variety as a risk factor for food inse-curity in rural settlement populations.
This result raises the importance of strength-ening cash transfer public policies, such as the PBF, and that encourage the small farmer from more vulnerable families, such as the food pur-chase program (PAA). In addition, it is essential that they be associated with health education in the countryside, greater promotion of agroeco-logical production, valuing of regional foods and their local marketing. It is believed that, given the results found, these could be key strategies to im-prove the food insecurity landscape of this pop-ulation. Further studies with this population are also proposed to designate other possible food insecurity determinants and thus provide a bet-ter formulation of public policies.
Final considerations
aúd
e C
ole
tiv
a,
22(2):479-488,
2017
Collaborations
JA Almeida participated in the data collection, analysis and discussion of results and was in charge of writing. Student co-advisor AS Santos coordinated data collection and discussion of re-sults. MAO Nascimento participated in the data collection, analysis and discussion of results. JVC Oliveira participated in the data collection, anal-ysis and discussion of results. DG Silva partici-pated in the statistical Review and discussion of results. Student advisor RS Mendes-Netto partic-ipated in the whole process, from project design to data collection, analysis and discussion of re-sults and the writing process.
References
1. Brasil. Lei nº. 11.346 de 15 de setembro de 2006. Lei Orgânica de Segurança Alimentar e Nutricional. Diário Oficial da União 2006; 18 set.
2. Food and Agriculture Organization of the United Na-tions (FAO). Statistical Yearbook. Rome: FAO; 2013. 3. Instituto Brasileiro de Geografia e Estatística (IBGE).
Pesquisa Nacional por Amostra de Domicílios: segurança alimentar 2013. Rio de Janeiro: IBGE; 2014.
4. Instituo Nacional de Colonização e Reforma Agrária (INCRA). [online]. Brasília; 2014. [acessado 2014 dez 27]. Disponível em: http://painel.incra.gov.br/siste-mas/index.php
5. Lopes ESA. Da colonização dirigida na Amazônia à reforma agrária no nordeste: (origem, trajetórias e pers-pectivas de colonos e assentados). São Cristóvão: Editora UFS; 2013.
6. Cócaro, H, Cócaro ES, Reis RM, Calegario CLL. Condi-ções de (in)segurança alimentar em um assentamento rural do estado do Mato Grosso. Cadernos de Agroeco-logia 2011; Fortaleza. p. 1-6.
7. Busato MA, Gallina LS, Dreyer DC, de Quadros JC, La-vratti E, Teo CRPA. Segurança alimentar e nutricional e as condições do ambiente em assentamento rural de Santa Catarina. Alim. Nutr. 2011; 22(4):555-559 8. Obana K, Pereira APA, Cesário AC, Vieira VCR.
Pre-valência e gradientes da insegurança alimentar em um assentamento de reforma agrária localizado no sul do estado de Minas Gerais. Cadernos de Agroecologia 2010; Porto de Galinhas.
9. Morais DC, Dutra LV, Franceschini SDCC, Priore SE. Insegurança alimentar e indicadores antropométricos, dietéticos e sociais em estudos brasileiros: uma revisão sistemática. Cien Saude Colet 2014; 19(5):1475-1488. 10. Brasil. Ministério da Saúde (MS). Secretaria de
Aten-ção à Saúde. Guia alimentar para a população brasileira: promovendo a alimentação saudável. Brasília: MS; 2008. 11. Instituo Nacional de Colonização e Reforma Agrária
(INCRA). [online]. Brasília, Distrito Federal; 2015. [acessado 2015 jan 12]. Disponível em: http://www. incra.gov.br/images/reforma_agraria/projetos_e_pro-gramas/relacao_beneficiarios/sr23_se.pdf
12. Santos LPD, Costa MGD, Santos JVD, Lindemann IL, Gigante DP. Comparação entre duas escalas de segu-rança alimentar. Cien Saude Colet 2014; 19(1):279-286. 13. The World Bank. World Development Report. Oxford:
Oxford University Press; 1990.
14. Lopez RPS, Botelho RBA. Álbum fotográfico de porções alimentares. São Paulo: Metha; 2008.
15. Sales RL, Costa NMB, Silva MMS. Avaliando o consumo alimentar por fotos. [CD-ROM]. Viçosa: UFV; 2004. 16. Vitolo MR. Nutrição: da gestação ao envelhecimento.
Rio de Janeiro: Ed Rúbio; 2008.
17. Zabotto CB, Vianna RPT. Registro fotográfico para in-quéritos dietéticos: Utensílios e Porções. Goiânia: UFG; 1996.
18. Núcleo de Estudos e Pesquisas em Alimentação – NEPA. Tabela Brasileira de Composição de Alimentos. 2° ed. Campinas: Unicamp; 2006.
19. Padovani RA, Amaya-Fárfan J, Colugnati FAB, Dome-ne SMA. Dietary reference intakes: aplicabilidade das tabelas em estudos nutricionais. Revista de Nutrição
A
lme
ida J
20. World Health Organization (WHO). Obesity: Pre-venting and managing the global epidemic. Report of a WHO consultationonobesity. Geneve: WHO; 1998. 21. Souza-Esquerdo VF, Bergamasco SMPP, de Oliveira,
JTA, Oliveira ES. Segurança alimentar e nutricional e qualidade de vida em assentamentos rurais. Segurança Alimentar e Nutricional 2013; 20(1):13-23.
22. Segall-Corrêa AM, Pérez-Escamilla R, Maranha LK, Sampaio MFA, Yuyama L, Alencar F, Vianna RPT, Viei-ra ACF, Coitinho D, Schmitz BS, Leão MM, Gubert M.
Acompanhamento e avaliação da segurança alimentar de famílias brasileiras: validação de metodologia e de instru-mento de coleta de informação. Campinas: Universidade Estadual de Campinas, Organização Pan-Americana da Saúde, Ministério de Saúde; 2003. (Relatório Técnico). 23. Veiga LS, Cócaro H, Cócaro ES, Costa RN, Jesus EL,
Oliveira MLS. Relações entre (in)segurança alimentar e as condições sociais em um assentamento rural do estado de Minas Gerais. In: VIII Congresso Brasileiro de Agroecologia; 2013; Porto Alegre. p. 1-5.
24. Brasil. Instituo Nacional de Pesquisas Espaciais. INPE [online]. São José dos Campos, São Paulo; 2015. [aces-sado 2015 maio 31]. Disponível em: http://www.inpe. br/noticias/namidia/img/clip20032013_08.pdf 25. Souza BFDNJ, Marín-León L. Food insecurity among
the elderly: cross-sectional study with soup kitchen us-ers. Revista de Nutrição 2013; 26(6):679-691.
26. Monteiro F, Schmidt ST, da Costa IB, Almeida CCB, Silva Matuda N. Bolsa Família: insegurança alimentar e nutricional de crianças menores de cinco anos. Cien Saude Colet 2014; 19(5):1347-1357.
27. Bittencourt LS, Santos SMCD, Pinto EDJ, Aliaga MA, Ribeiro-Silva RC. Factors Associated with Food In-security in Households of Public School Students of Salvador City, Bahia, Brazil. J Health Popul Nutr 2013; 31(4):471-479.
28. Godoy KC, Sávio KEO, Akutsu RDC, Gubert MB, Bo-telho RBA. Perfil e situação de insegurança alimentar dos usuários dos Restaurantes Populares no Brasil. Cad Saude Publica 2014; 30(6):1239-1249.
29. Aquino, JDS, Sequeira-de-Andrade LAS, Silva PEBAD, Silva APD, Vieira CRDS, Lira PICD. Food insecuri-ty and socioeconomic, food and nutrition profile of schoolchildren living in urban and rural areas of Picos, Piauí. Revista de Nutrição 2014; 27(4):395-404. 30. Lopes TS, Sichieri R, Salles-Costa R, Veiga GV,
Perei-ra RA. Family Food Insecurity and Nutritional Risk in Adolescents from a Low-Income Area of Rio De Janei-ro, Brazil. J Biosoc Sci 2013; 45(05):661-674.
31. Fietz VR, Salay E, Watanabe EAMT. Condições so-cioeconômicas, demográficas e estado nutricional de adultos e idosos moradores em assentamento rural em Mato Grosso do Sul, MS. Rev Segurança Alimentar e Nutricional 2010; 17(1):73-82.
32. Anschau FR, Matsuo T, Segall-Corrêa AM. Insegurança alimentar entre beneficiários de programas de transfe-rência de renda. Rev. Nutr 2012; 25(2):177-189. 33. Figuero A, Pedraza D. Segurança alimentar em
famí-lias com crianças matriculadas em creches públicas do estado da Paraíba, Brasil. Revista de Nutrição 2013; 26(5):517-527.
34. Instituto de pesquisa econômica aplicada(IPEA). Pro-grama bolsa família: uma década de inclusão e cidada-nia. Brasília: IPEA; 2013.
35. Instituto Brasileiro de Análises Sociais e econômi-cas (IBASE). Repercussões do Programa Bolsa Família na Segurança Alimentar e Nutricional das famílias bene-ficiadas. Rio de Janeiro: IBASE; 2008.
36. Lima FEL, Fisberg RM, Uchimura, KY, Pitcheth T. Pro-grama Bolsa-Família: qualidade da dieta de população adulta do município de Curitiba, PR. Rev Bras Epide-miol 2013; 16(1):58-67.
37. Cabral MJ, Vieira KA, Sawaya AL, Florêncio TMMT. Perfil socioeconômico, nutricional e de ingestão ali-mentar de beneficiários do Programa Bolsa Famí-lia. Estudos avançados 2013; 27(78):71-87.
38. Cotta RMM, Machado JC. Programa Bolsa Família e segurança alimentar e nutricional no Brasil: revi-são crítica da literatura. Rev Panam Salud Publica
2013; 33(1):54-60.
39. Wolf MR, Barros Filho ADA. Estado nutricional dos beneficiários do Programa Bolsa Família no Bra-sil – uma revisão sistemática. Cien Saude Colet 2014; 19(5):1331-1338.
40. Levy-Costa RB, Sichieri R, Pontes NDS, Monteiro CA. Disponibilidade domiciliar de alimentos no Brasil: dis-tribuição e evolução (1974-2003). Rev Saude Publica
2005; 39(4):530-540.
41. Levy RB, Claro RM, Mondini L, Sichieri R, Monteiro CA. Distribuição regional e socioeconômica da dispo-nibilidade domiciliar de alimentos no Brasil em 2008-2009. Rev Saude Publica 2012; 46(1):6-15.
42. Instituto Brasileiro de Geografia e Estatística (IBGE).
Pesquisa de Orçamentos Familiares 2008-09. Rio de Ja-neiro: IBGE; 2010.
Article submitted 18/06/2015 Approved 26/04/2016