E-mail: [email protected]
Rev. Ambient. Água vol. 8 n. 3 Taubaté - Sep. / Dec. 2013
Proposal for a remote sensing trophic state index based upon
Thematic Mapper/Landsat images
doi: 10.4136/ambi-agua.1229
Received: 23 Oct. 2013; Accepted: 10 Dec. 2013
Evlyn Márcia Leão de Moraes Novo1; Luciana de Resende Londe2*; Claudio Barbosa1; Carlos A. S. de Araujo1; Camilo Daleles Rennó1
1Instituto Nacional de Pesquisas Espaciais - São José dos Campos, SP, Brazil Divisão de Sensoriamento Remoto – DSR
2Centro Nacional de Monitoramento e Alertas de Desastres Naturais – CEMADEN Cachoeira Paulista, SP, Brazil
*Corresponding author: e-mail: [email protected],
[email protected], [email protected], [email protected], [email protected]
ABSTRACT
This work proposes a trophic state index based on the remote sensing retrieval of chlorophyll-α concentration. For that, in situ Bidirectional Reflectance Factor (BRF) data acquired in the Ibitinga reservoir were resampled to match Landsat/TM spectral simulated bands (TM_sim bands) and used to run linear correlation with concurrent measurements of chlorophyll-α concentration. Monte Carlo simulation was then applied to select the most suitable model relating chlorophyll-α concentration and simulated TM/Landsat reflectance. TM4_sim/TM3_sim ratio provided the best model with a R2 value of 0.78. The model was then inverted to create a look-up-table (LUT) relating TM4_sim/TM3_sim ratio intervals to chlorophyll-α concentration trophic state classes covering the entire range measured in the reservoir. Atmospheric corrected Landsat TM images converted to surface reflectance were then used to generate a TM4/TM3 ratio image. The ratio image frequency distribution encompassed the range of TM4_sim/TM3_sim ratio indicating agreement between in situ and satellite data and supporting the use of satellite data to map chlorophyll- concentration trophic state distribution in the reservoir. Based on that, the LUT was applied to a Landsat/TM ratio image to map the spatial distribution of chlorophyll- trophic state classes in Ibitinga reservoir. Despite the stochastic selection of TM4_sim/TM3_sim ratio as the best input variable for modeling the chlorophyll-α concentration, it has a physical basis: high concentration of phytoplankton increases the reflectance in the near-infrared (TM4) and decreases the reflectance in the red (TM3). The band ratio, therefore, enhances the relationship between chlorophyll- concentration and remotely sensed reflectance.
Keywords: water quality, phytoplankton, monitoring.
Proposta de um indicador de estado trófico a partir de imagens do
sensor TM/Landsat
RESUMO
reamostradas para serem combinadas com bandas espectrais simuladas do Landsat/TM (TM_sim) e foram usadas para o cálculo da correlação linear com medidas de concentração de clorofila-a. A simulação de Monte Carlo foi aplicada para selecionar o modelo mais adequado para relacionar concentração de clorofila e reflectância simulada do TM/Landsat. A razão TM4_sim/TM3_sim forneceu o melhor modelo, com um valor de 0.78 para R2. O modelo foi então invertido para criar uma tabela (LUT) com as relações entre os intervalos das razões TM4_sim/TM3_sim e as classes de estado trófico, abrangendo todo o intervalo de valores medidos no reservatório. Imagens do Landsat TM, corrigidas atmosfericamente e convertidas para reflectância de superfície, foram usadas para gerar uma imagem para a razão TM4/TM3. A distribuição de frequência da imagem da razão englobou todo o intervalo da razão TM4_sim/TM3_sim, indicando concordância entre os dados orbitais e os dados medidos in situ e corrobora o uso de dados de satélite para mapear a distribuição do estado trófico no reservatório. Com base nestas observações, a LUT foi aplicada à imagem razão Landsat/TM para mapear a distribuição espacial das classes de estado trófico no Reservatório de Ibitinga. Apesar da seleção estocástica da razão TM4_sim/TM3_sim como melhor variável de entrada para modelagem da concentração de clorofila-a, esta escolha foi baseada em fatores físicos: altas concentrações de fitoplâncton aumentam a reflectância na região do infra-vermelho próximo (TM4) e diminuem a reflectância na região espectral do vermelho (TM3). A razão entre bandas, portanto, realça a relação entre a concentração de clorofila-a e a reflectância medida por sensoriamento remoto.
Palavras-chave: qualidade da água, sensoriamento remoto, monitoramento.
1. INTRODUCTION
During the second half of the twentieth century, standardized methods for quantifying the degradation of water resources (USEPA, 1978; OECD, 1982) were developed as a tool to lessen the growing cost of water treatment. One of the main insights of those studies was to connect the excessive load of phosphorus and nitrogen to the degradation of water resources (Vollenweider, 1968). Those studies also pointed out the importance of geographical, geological and ecological features of the drainage basin as controlling factors in the eutrophication process (OECD, 1982). Studies (Dillon, 1974; 1975) highlighted the importance of hydraulic retention time as a key aspect in the relationship between nutrient load and the primary productivity of aquatic systems.
These studies were focused on aquatic systems from the northern hemisphere; therefore, several studies were developed in Brazil during the 1970´s to assess to what extent those concepts could be applied to tropical environments (CETESB, 1978; Toledo Jr. et al., 1983; Toledo Jr., 1990) where radiation and temperature are not limiting factors to primary production.
The trophic state indexes represent an objective measurement which can be used to compare the trophic state of different aquatic systems. Until the 1980´s, aquatic systems were classified either as eutrophic or oligotrophic based on the knowledge of the observer (USEPA, 1978). Between 1970 and 1980, the literature shows several proposals (USEPA, 1978) to provide a unique Trophic State Index (TSI), but most of them were hard to apply for monitoring purposes.
Rev. Ambient. Água vol. 8 n. 3 Taubaté - Sep. / Dec. 2013
Table 1. Variables and classes of Trophic State Index used to classify inland water in São Paulo State.
Trophic State Classification –TSI
Classes Intervals Secchi S (m) Phosphorus Total (mg.m-3)
Chlorophyll – a (µg.L-1)
Ultraoligotrophic TSI ≤ 47 S ≥ 2.4 P ≤ 8 CL ≤ 1.17
Oligotrophic 47 <TSI ≤ 52 2.4 > S ≥ 1.7 8 < P ≤ 19 1.17< CL ≤ 3.24
Mesotrophic 52 <TSI≤ 59 1.7 > S ≥ 1.1 19 < P ≤ 52 3.24 < CL ≤ 11.03
Eutrophic 59 <TSI≤ 63 1,1 > S ≥ 0.8 52 < P ≤ 120 11.03 < CL≤ 30.55
Super-eutrophic 63 <TSI≤ 67 0.8 > S ≥ 0.6 120 < P ≤ 233 30.55 < CL≤ 69.05
Hypereutrophic TSI> 67 S > 0.6 233 < P 69.05 < CL
Source: CETESB (1978).
CETESB´s trophic state index is based on three different trophy indicators: chemical indicator (total Phosphorus and/or orthophosphate concentration), biological indicator
(chlorophyll- concentration) and physical indicator (water transparency – Secchi Depth).
Except for the chemical indicator, the others may be estimated by remote sensing methods.
Chlorophyll - α is an optically active component of aquatic systems: its presence in
varying concentrations affects water absorption and scattering coefficients (Kirk, 2011) and, consequently, the depth of the euphotic zone. This effect varies along the electromagnetic spectrum and can be seen as changes in water spectral reflectance properties.
Different authors, however, applied different methods to retrieve Chlorophyll-a concentration out of the spectral reflectance data. For Lake District (England) (George, 1997), different information extraction methods were necessary to assess water according to
Chlorophyll concentration. For chlorophyll - α concentrations smaller than 10 µg L-1, the most
efficient spectral band ratios involved the intervals 520-600 nm and 450-520 nm (George,
1997). For concentrations larger than 10 µg L-1, an algorithm with band centered in 520-600
nm showed the best performance. According to George and Malthus (2001), the 685 nm/745 nm ratio, suggested for Dutch aquatic systems (Malthus and Dekker, 1995), was also suitable for Whales aquatic systems (Great Britain). Other studies (Gitelson and Kondratyev, 1991) pointed out that band ratios from 670 to 710 nm were useful for estimations of chlorophyll concentration in continental environments, which are rich in colored dissolved organic
matter – CDOM.
More recently, following increasing interest on water quality, there has been an increase in the number of studies aiming to use remote sensing for trophic state evaluation in
continental aquatic systems. Chlorophyll - α concentration in Chagan Lake (China´s Northeast
region) was estimated from TM sensor (Landsat satellite) images (Duan et al., 2007). The band ratio TM4/TM3, which includes the Chlorophyll absorption peak in 670 nm and a spectral reflectance peak (fluorescence and phytoplankton cell backscattering) in 700 nm, provided the best performance. According to the authors, band ratios mitigate atmospheric and water surface reflectivity effects on measurements from satellite sensors. In Table 2 there
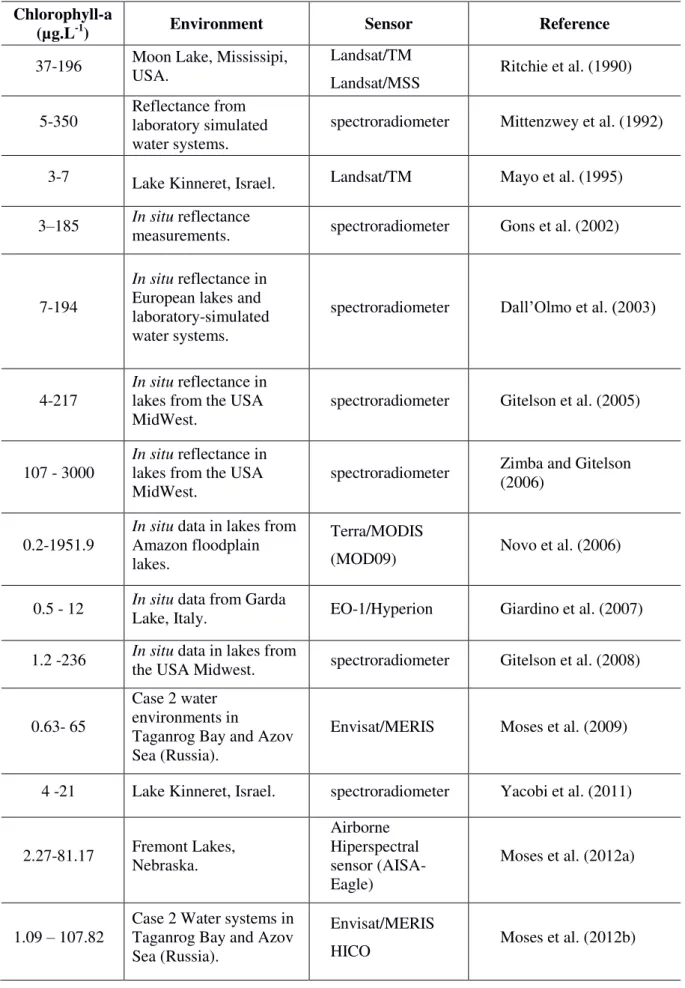
is a summary of studies regarding the methods for estimation of chlorophyll-α concentration
Table 2. Summary of studies regarding chlorophyll-α estimation from remote-sensing measurements in optically complex water environments.
Chlorophyll-a
(µg.L-1) Environment Sensor Reference
37-196 Moon Lake, Mississipi, USA. Landsat/TM
Landsat/MSS Ritchie et al. (1990)
5-350 Reflectance from laboratory simulated water systems.
spectroradiometer Mittenzwey et al. (1992)
3-7 Lake Kinneret, Israel. Landsat/TM Mayo et al. (1995)
3–185 In situ reflectance
measurements. spectroradiometer Gons et al. (2002)
7-194
In situ reflectance in European lakes and laboratory-simulated water systems.
spectroradiometer Dall’Olmo et al. (2003)
4-217
In situ reflectance in lakes from the USA MidWest.
spectroradiometer Gitelson et al. (2005)
107 - 3000
In situ reflectance in lakes from the USA MidWest.
spectroradiometer Zimba and Gitelson (2006)
0.2-1951.9
In situ data in lakes from Amazon floodplain lakes.
Terra/MODIS
(MOD09) Novo et al. (2006)
0.5 - 12 In situLake, Italy. data from Garda EO-1/Hyperion Giardino et al. (2007)
1.2 -236 In situ data in lakes from
the USA Midwest. spectroradiometer Gitelson et al. (2008)
0.63- 65
Case 2 water environments in
Taganrog Bay and Azov Sea (Russia).
Envisat/MERIS Moses et al. (2009)
4 -21 Lake Kinneret, Israel. spectroradiometer Yacobi et al. (2011)
2.27-81.17 Fremont Lakes, Nebraska.
Airborne Hiperspectral sensor (AISA-Eagle)
Moses et al. (2012a)
1.09 – 107.82
Case 2 Water systems in Taganrog Bay and Azov Sea (Russia).
Envisat/MERIS
Rev. Ambient. Água vol. 8 n. 3 Taubaté - Sep. / Dec. 2013
Londe (2008) measured the bidirectional reflectance factor (BRF) from the hypertrophic Ibitinga Reservoir concurrently to 51 surface water samples to characterize the phytoplankton spectral behavior. This work intended to support the use of satellite remote-sensing methods to monitor eutrophication processes in continental aquatic systems. In situ collection was made during 5 days in 2005, when the reservoir was covered by large extensions of
CYANOPHYCEAE blooms. Chlorophyll - α concentrations measured by Londe (2008)
varied widely from upstream (from 6 to 15 µg L-1) to downstream (from 1,500 to
76,809 µg L-1).
For the same dataset, Londe et al. (2011) pointed out the following changes in the water
reflectance spectrum for increasing Chlorophyll-α concentration: (1) decreasing BRF in blue
spectral region; (2) increasing BRF in near-infrared (NIR) spectral region; (3) shift of the maximum BRF region from green to NIR. Testing different predictive models for
Chlorophyll- α concentration, Londe et al. (2011) found the best results using NIR values in
band ratios and indexes.
Based on previous study results, this study aimed to propose a remote sensing trophic index. Two separated but integrated tasks were carried out to achieve this goal: the first task dealt with the analyses of in situ reflectance spectra in order to identify candidate bands and
band ratios to be used in algorithms for retrieving chlorophyll- concentrations in surface
waters; the second task was to create a look-up table based on the analyses of in situ data which allows mapping chlorophyll-a concentration using TM Landsat images. The look-up table could be then used as a surrogate for a trophic state index. UHE Ibitinga reservoir was selected to carry out the study because of in situ data availability (Londe, 2008).
2. MATERIAL AND METHODS
2.1. Study area
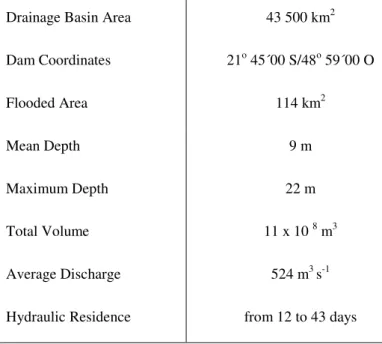
Ibitinga Reservoir is part of Tietê River dam complex, formed by the following Reservoirs (from upstream to downstream): Barra Bonita, Bariri, Ibitinga, Promissão, Nova Avanhandava and Três Irmãos. It extends 70 km along Tietê River and has two branches almost 26 km long following its main tributaries: Jacaré-Guaçu River and Jacaré-Pepira River. It main characteristics are summarized in Table 3.
Table 3. Ibitinga Reservoir main characteristics.
Drainage Basin Area 43 500 km2
Dam Coordinates 21o 45´00 S/48o 59´00 O
Flooded Area 114 km2
Mean Depth 9 m
Maximum Depth 22 m
Total Volume 11 x 10 8 m3
Average Discharge 524 m3 s-1
Hydraulic Residence from 12 to 43 days
Several authors (Vieira et al., 2002, Guimarães Jr. et al., 1998) have pointed out that the land use in the reservoir drainage basin contributed to the long-term rising of the reservoir´s trophic level due to inputs of urban sewage and agriculture. Carvalho et al. (2005) reported that in 2001 more than 70 % of the UHE Ibitinga reservoir underwent macrophyte infestation, a typical symptom of eutrophication. Galo et al. (2002) pointed that the total reservoir´s area covered by macrophytes in 2001 varied from 874 ha in summer to 1645 ha in the dry season, suggesting seasonal changes in trophic level. Tundisi et al. (2008) identified many problems concerning Ibitinga´s drainage basin, such as increasing sources of Phosphorus and Nitrogen related to sugarcane expansion and degradation of urban rivers associated to population growth.
Studies carried out by Luzia (2009) in lotic and lentic aquatic systems in the reservoir´s drainage basin during wintertime (June 2005) and summertime (January 2006) concluded that most of the samples from lotic systems were either eutrophic or hypertrophic, according to theCarlson Index (Carlson, 1977), regardless the time of the year. UHE Ibitinga Reservoir was classified as hypertrophic during the rainy season and eutrophic during the dry season. Data collected by Londe (2008) in October/2005, in 51 different sampling stations, showed a wide range of Chlorophyll concentration: from 6.14 µg L-1 to 76,809.84 µg L-1. Although these numbers may seem too high, some reservoirs’ areas were covered by phytoplankton scum in the ultimate state of eutrophication. According to Londe’s dataset (Londe, 2008), the reservoir should be classified as mesotrophic for some regions and hypertrophic for other regions (Table 1), depending on the sampling station location. Results obtained by Londe (2008) and Londe et al. (2011) point to a huge spatial variability in Ibitinga Reservoir’s trophic state.
2.2. Data approach
The following data were used in this research: outflow data from the Brazilian Electric System National Operator (ONS) webpage (www.ons.org.br), precipitation data from the National Water Agency (ANA) webpage (http://hidroweb.ana.gov.br), Thematic Mapper images (TM-Landsat) from the National Institute for Space research (INPE) website (www.dgi.inpe.br/CDSR) and chlorophyll - α concentration data from Londe’s dataset
(Londe, 2008).
During five days in October, 2005, fifty-one stations were sampled in Ibitinga Reservoir. They were distributed along the entire reservoir surface (Londe, 2008) and intended to cover a wide range of Chlorophyll-a concentration. At every sampling station, the upward radiance, Lu, above the water surface and the downward radiance of a Lambertian Spectralon reference
plate, Ld , was measured with a ASD Fieldspec HandHeld (Analytical Spectral Devices, Inc.)
hyper-spectral radiometer (350-1100 nm, 1 nm bandwidth) with 25o field-of-view. These data were used to derive the Bidirectional Reflectance Factor (Deering, 1989; Duggin and Philipson, 1982; Milton et al., 1987). The measurements were carried out using a sensor-viewing geometry of 45o zenith angles and an 180o azimuth with respect to the Sun direction to minimize water surface reflectance, instrument and platform shading and sky and sun glint (Mobley, 1999). In this study, water surface reflectance was assumed negligible due to the selected sun-sensor geometry. More details about the measurement setup and the derivation of the BRF measurements can be found in Londe (2008).
Concurrently to radiometry, water samples integrated up to the Secchi depth were also acquired for determination of Chlorophyll-a concentration in laboratory. Chlorophyll-a from algae concentrated on Whatman GF/F filters was extracted in hot ethanol, and its concentration was quantified according to Nush e Palme (1975) e Nush (1980).
Rev. Ambient. Água vol. 8 n. 3 Taubaté - Sep. / Dec. 2013 of simulated bands were calculated by using as weights the spectral TM band responses (http://landsat.usgs.gov/band_designations_landsat_satellites.php.) resulting in the following data set: TM1_sim, TM2_sim, TM3_sim, TM4_sim.
Discharge data from Ibitinga Dam and Bariri Dam were used to identify sample stations showing similar hydraulic residence time in order to minimize environmental effects on the relationship between chlorophyll concentration and water surface reflectance (Barbosa and Novo, 2009). After sample selection, the reflectance of simulated bands and band ratios were correlated to Chlrophyll- concentration to identify the best set of input variables for regression analyses.
Due to the small number of samples remaining from sample selection, Monte Carlo simulation was applied to identify the best model among the two band ratios with the highest correlation with chlorophyll-a concentration. Monte Carlo simulation is a technique that assumes that an event´s frequency tends to be similar to its occurrence probability when the experiment is repeated many times in a random mode (Mooney, 1997). For the simulation, we run the following experiment: i) the sampling stations were split into two subsets, being 9 samples for model calibration (calibration set) and 8 for model validation (validation set); ii) the stations were randomly allocated to calibration and validation sets 10,000 times, generating 10,000 different models for each input ratio; iii) the r squared for each output model was used to test the frequency in which R2 TM2_sim/TM1_sim > R2 Log(TM4_sim/TM3_sim); iv) the 95% credibility range of R2 for the selected model based was computed.
The selected model was then used to generate a look-up table which associates chlorophyll - α concentration intervals to band ratio intervals. These band ratio intervals were then applied to the atmospheric-corrected TM/Landsat image from October 11, 2005 to map chlorophyll - α concentration distribution at Ibitinga Reservoir.
The atmospheric correction of TM Landsat data performed a key aspect in the study due to the need to make the reflectance extracted from image compatible with the reflectance measured in situ as described in Londe (2008). The first step in the atmospheric correction was the radiometric calibration based on Chander et al. (2009) parameters and image heading information (solar elevation angle and acquisition date). After calibration, the Fast Line-of-sight Atmospheric Analysis of Spectral Hypercubes (FLAASH) algorithm was used to calculate atmosphere radiance for each band using MODTRAN (Moderate Spectral Resolution Atmospheric Transmittance Algorithm). Central coordinates, acquisition time (from image heading) and average scene elevation, as well as sensor information (altitude and pixel size) are inputs for MODTRAN. The scene average elevation data (km) were calculated through Ground Digital Model (MDT) from SRTM (Valeriano, 2008), available at INPE´s webpage (http://www.dsr.inpe.br/topodata).
Due to sensor limitations and poor data for atmosphere correction, different input model datasets were tested to define those more suitable for the study area. The assessment of atmospheric correction quality was carried out by trial looking at the spectra of reference targets resulting from the different input datasets. As UHE Ibitinga is near Latitude 20o S, both the Tropical (T) and Mid Latitude Summer (MLS) atmospheric models fit the specification. The Rural Model was used for the reservoir´s image because, in spite of being a highly urbanized region, this area is not severely affected by industrial particles. The atmospheric correction application also estimates the atmosphere visibility through automatic identification of dark pixels (Kaufman, 1997). This method standardizes the image visibility.
Landsat TM band 5 was selected to create a water mask to isolate the reservoir from land. As previously documented in many studies (Schowengerdt, 2007) Landsat Thematic Mapper (TM) is subjected to noise, mainly over uniform dark objects, due to differences in gain and offset among the 16 detectors within a band. Due to its periodic nature, it causes regular linear patterns of dark and light stripes which are known as image striping. The amount of striping is, however, scene dependent. In places of low water reflectance the striping impact on the image was much higher. A series of tests was carried out to choose the best combination of striping and filtering according to image quality. The application of a striping removal algorithm and a low-pass median filter to the TM bands was the best combination for most of the dates. The choice of the filter window size was based on visual inspection of the images to avoid boundary blurring. The striping removal was carried out before computing the selected band ratio. The image ratio was then submitted to a density slicing according to the look-up table relating ratio intervals to chlorophyll-a trophic index classes.
3. RESULTS AND DISCUSSION
3.1. Selection of sampling stations
The hydraulic residence time is crucial in the reservoir stratification processes and nutrients availability, affecting the phytoplankton development (Straškraba, 1999). A reduction in the hydraulic residence time is often related to losses in phytoplankton biomass through hydraulic washing and mechanical shock, while an increase in hydraulic residence time promotes phytoplankton growth through concentration of nutrients and water column stability.
Figure 1 shows the daily flow (m3.s-1) both in Ibitinga Reservoir and in Bariri Reservoir, located upstream from it. From October 1st, 2005 to October, 24th, 2005, Ibitinga Reservoir hydraulic residence time varied from 41 to 25 days, showing a progressive reduction from the beginning to the end of the month. On October 24th, the outflow in Bariri Reservoir increased 75 % compared to October 23th, causing a 25 % increase in Ibitinga´s flow on October 25th. This caused a reduction in Ibitinga Reservoir hydraulic residence time, which varied from 15 to 21 days during the in situ data collection by Londe (2008).
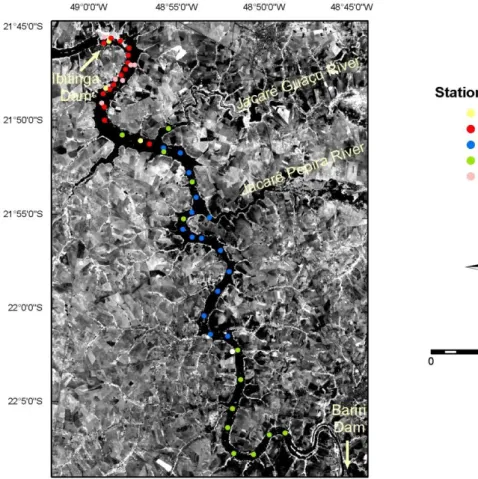
Rev. Ambient. Água vol. 8 n. 3 Taubaté - Sep. / Dec. 2013 From Figure 1, we concluded that it is not possible to use data collected by Londe (2008) to calibrate a predictive model for chlorophyll-α, because the hydrodynamic conditions changed. It is likely that samples from October 24th (Figure 2) are not severely affected by the abrupt increase in Bariri Reservoir outflow, because the sampling stations were 50 km away from Bariri dam. Sampling stations from October 25th, however, included regions where phytoplankton would suffer from two stress factors: excessive flow from Bariri during two following days and increasing flow in Ibitinga, as they were near its dam. Also, the effect would be intense in the reservoir’s axis, due to the increased speed of Bariri´s water propagation.
As Bariri´s flow decreased to 400 m3.s-1 on October 26th, we assumed that the reservoir’s central region had recovered its balance state. However, samples from October 27-28 were not used because they were collected throughout the whole reservoir, from upstream to the reservoir’s central region, encompassing different optical properties (Kirk, 2011).
Figure 2. Sample station distribution (Londe, 2008) coded according to acquisition date.
3.2. TM/Landsat bands spectral reflectance simulation
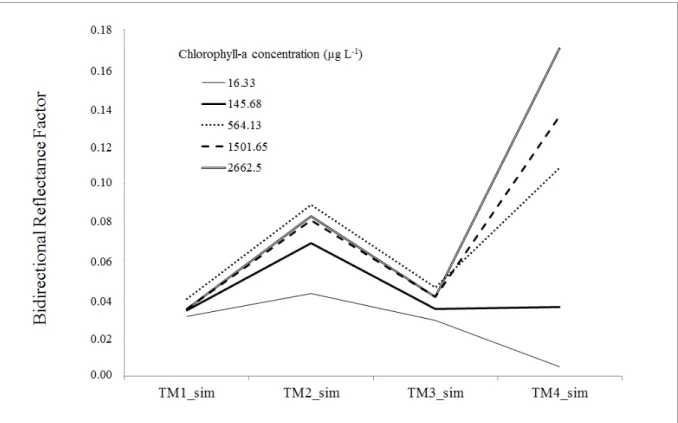
poor sensitivity to concentrations higher than 145 µg L-1. Green spectral region remains sensitive until 564.13 µg L-1 but does not show good matches to 1,501.65 µg L-1 and 2,662.50 µg L-1 concentrations. In dense phytoplankton blooms, which correspond to high chlorophyll concentrations, the colony growth may act as a stress factor, inhibiting photosynthesis. In order to maximize light availability, phytoplankton migrates towards the water surface creating a thick blooming layer which presents spectral behavior similar to crops or forest cover, with an intense scattering on NIR spectral region (Londe et al., 2011). For lower chlorophyll-α concentrations, phytoplankton occupies the entire euphotic zone decreasing the sensitivity NIR due to the high water absorption coefficient in this spectral region (Kirk, 2011).
Figure 3. Bidirectional Reflectance Factor resampled to simulate Landsat/TM bands at sample stations characterized by increasing chlorophyll-a concentration.
Source: Londe (2008).
3.3. Monte Carlo simulation
There are two outstanding band ratios to discriminate chlorophyll-α concentrations, according to Figure 3. Correlation analyses between chlorophyll- α concentration and simulated TM bands and band ratios corroborated this fact: the ratio TM2_sim/TM1_sim, that captures green scattering variation in relation to blue absorption by phytoplankton pigments and TM4_sim/TM3_sim, which captures surface bloom scattering in relation to red band absorption by chlorophyll-α presented the highest correlations with chlorophyll- concentration. Analysis of the spectra shows that green spectral region is not suitable to evaluate extreme conditions while NIR spectral region is less sensitive to low concentrations.
Rev. Ambient. Água vol. 8 n. 3 Taubaté - Sep. / Dec. 2013 TM4_sim/TM3_sim ratio as the most appropriate for modeling chlorophyll-α concentration, with 95 % of confidence and R2 values from 0,44 to 0.97.
Considering the varying R2 values from the simulation (0.44 to 0.97), we chose the model with an R2 value (0.79) below the distribution median (R2=0.84):
Log10 Chl= 2,1171 + 1,68 Log10 (TM4_sim/TM3_sim)
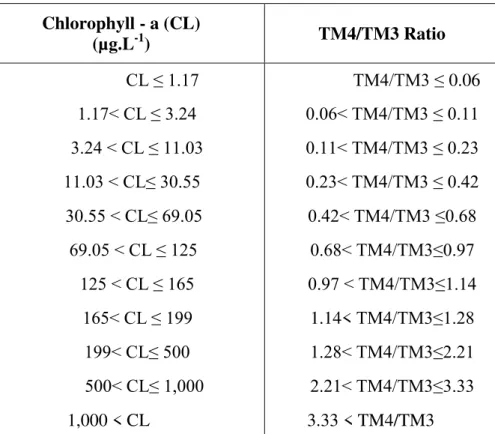
This model was then used in reverse mode to identify chlorophyll-α concentration groups corresponding to TM4_sim/TM3_sim ratio values. Chlorophyll-α concentration groups were set considering Table 1 criteria and were enlarged to include groups encompassing Londe (2008) observations (Table 3).
It is important to point out that the Monte Carlo simulation results are in accordance with most of the literature listed in Table 2, suggesting that this ratio can be used as a proxy of trophic state index mainly in regions characterized by eutrophic waters. This remote sensing trophic state index would be useful to map areas subject to recurrent phytoplankton blooming to support mitigation actions.
Table 3. Intervals for Chlorophyll- α concentration and values for TM4_sim/TM3_sim ratio, based on the model defined by the Monte Carlo simulation.
Chlorophyll - a (CL)
(µg.L-1) TM4/TM3 Ratio
CL ≤ 1.17 TM4/TM3 ≤ 0.06
1.17< CL ≤ 3.24 0.06< TM4/TM3 ≤ 0.11 3.24 < CL ≤ 11.03 0.11< TM4/TM3 ≤ 0.23 11.03 < CL≤ 30.55 0.23< TM4/TM3 ≤ 0.42 30.55 < CL≤ 69.05 0.42< TM4/TM3 ≤0.68
69.05 < CL ≤ 125 0.68< TM4/TM3≤0.97 125 < CL ≤ 165 0.97 < TM4/TM3≤1.14 165< CL ≤ 199 1.14< TM4/TM3≤1.28 199< CL≤ 500 1.28< TM4/TM3≤2.21 500< CL≤ 1,000 2.21< TM4/TM3≤3.33
1,000 < CL 3.33 < TM4/TM3
3.4. Application of the look up table to 2005 TM landsat image
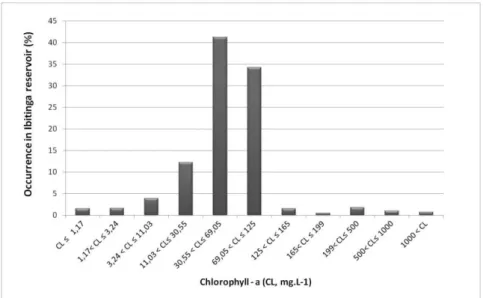
Despite the uncertainties related to atmospheric correction, Figure 4 shows that the frequency distribution of TM4/TM3 ratio values in October-11-2005 in Ibitinga Reservoir is within the range of the simulated TM4_sim/TM3_sim ratios. This fact suggests that the ratio represents a sound approximation to the chlorophyll-α concentration.
The look up table connecting intervals of band ratios to intervals of chlorophyll-α
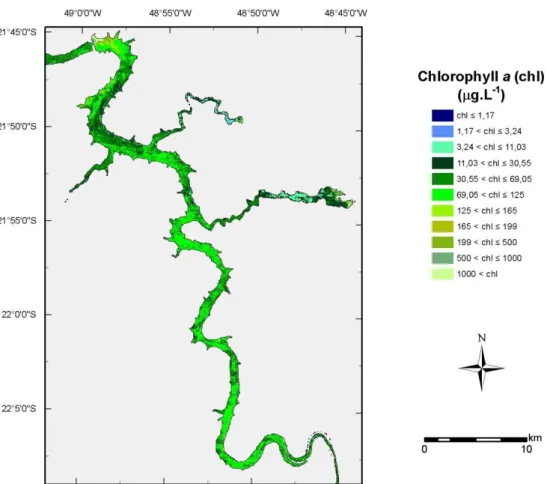
reflectance. Figure 5 shows the spatial distribution of chlorophyll-α concentration in Ibitinga Reservoir, as a result of Table 3´s application.
Figure 4. Frequency distribution of the TM4/TM3 ratio in the Ibitinga reservoir.
Figure 5. Spatial distribution of chlorophyll-a concentration classes based on TM4/TM3 ratio from an image acquired on October 11, 2005.
Rev. Ambient. Água vol. 8 n. 3 Taubaté - Sep. / Dec. 2013 with concentrations higher than 30 µg L-1. There are small oligotrophic and mesotrophic areas fed by tributaries: River Jarcaré-Pepira (southwards) and River Jacaré-Guaçu (northwards). Figure 6 shows the impact of good quality water input in the reservoir: immediately after the confluence of the reservoir´s tributaries, chlorophyll-α concentration is lower.
Figure 6. Reservoir inlets fed by Jacaré-Pepira River and Jacaré-Guaçu River. Chlorophyll-α classification is overlying Landsat TM3 band.
At the reservoir inlets there are ultra-oligotrophic and oligotrophic waters, readily shifted to eutrophic due to contact with hypertrophic waters (69 - 125 µg L-1). This fact highlights the importance of preserving springs and reservoir margins.
Around 75 % of Ibitinga Reservoir area presented supereutrophic and hypereutrophic characteristics in October-11-2005 (Figure 7). According to Londe (2008), from October 24 to 28, those high chlorophyll-α concentrations were associated with CYANOPHYCEAE dominance.
The fact that the TM4/TM3 ratio was appropriate to cover the large range of concentration groups, from 1 µg L-1 to more than 1,000 µg L-1 of chlorophyll-α, suggests that CYANOPHYCEAE was also dominant on October11, 2005. The high reflectance values on TM4 band (Figure 3) suggest the occurrence of surface blooms, possibly from some CYANOPHYCEAE species, considering general water characteristics during that period, such as high turbidity and high nutrient load. Phytoplankton blooms have great impact on water reuse, such as a decrease in leisure opportunities, not only because of aesthetic values (unpleasant smell and color from scum), but also because of toxins that some cyanobacteria produce.
4. CONCLUSIONS
The results suggest that the ratio TM4/TM3 can be applied to assess broad classes of water trophic states. The simulated TM band ratios provided a reliable method to relate band ratios intervals to chlorophyll- concentration intervals, indicating that this ratio can be used as a trophic index surrogate.
In spite of the stochastic selection of the TM4/TM3 band ratio as the best input variable to estimate chlorophyll-concentration, the results are in agreement with the literature. This ratio is linked to the physical interaction between the light field and the phytoplankton because it associates an increase in TM4/TM3 ratio with an increase in chlorophyll-α
concentration in water. In eutrophic environments, where there is surface blooming, an increase in chlorophyll-α concentration is associated with an increase both in NIR reflectance and in the absorption in the red band. A ratio using these bands, therefore, is particularly favorable to the identification of eutrophic areas in continental water systems with low inorganic particles turbidity, such as Ibitinga Reservoir.
Application of the classification system developed for Londe’s data (2008) showed consistent results for an October 11, 2005 image.
5. ACKNOWLEDGEMENTS
To Dr. Maria do Carmo Calijuri, CAPES (Processo 1773/05-4) and FAPESP (Processos 04/15901-4 e 08/56252-0).
6. REFERENCES
BARBOSA, C. C. F.; NOVO, E. M. L. M. Remote sensing of the water properties of the Amazon floodplain lakes: the time delay effects between in-situ and satellite data acquisition on model accuracy. In: INTERNATIONAL SYMPOSIUM ON REMOTE
SENSING OF ENVIRONMENT: SUSTAINING THE MILLENNIUM
DEVELOPMENT GOALS, 33., Stresa, 2009. Proceedings… Stresa: European Commission; Joint Research Centre, 2009.
CARLSON, R. E. A trophic state index for lakes. Minneapolis: Limnological Research Center, University of Minnesota, 1974. 17 p. (Contribution No. 141).
CARLSON, R. E. A trophic state index for lakes. Limnology and Oceanography, v. 22, n. 2, p. 361- 369, 1977.
CARVALHO, F. T.; VELINI, E. D.; CAVENAGHI, A. L.; NEGRISOLI, E.; CASTRO, R. M. Influência da turbidez na água do Rio Tietê e a ocorrência de plantas aquáticas.
Rev. Ambient. Água vol. 8 n. 3 Taubaté - Sep. / Dec. 2013 COMPANHIA DE TECNOLOGIA DE SANEAMENTO AMBIENTAL - CETESB.
CETESB estende controle de poluição a 106 municípios. São Paulo, 1978. 6p. CHANDER, G.; MARKHAM, B. L.; HELDER, D. L. Summary of current radiometric
calibration for Landsat MSS, TM, ETM+ and EO-1 ALI sensors. Remote Sensing of Environment, v. 113, p. 893-903, 2009. http://dx.doi.org/10.1016/j.rse.2009.01.007 DALL'OLMO, G.; GITELSON, A.; RUNDQUIST, D. C. Towards a unified approach for
remote estimation of chlorophyll-a in both terrestrial vegetation and turbid productive waters. Geophysical Research Letters, v. 30, n. 18, 2003. http://dx.doi. org/10.1029/2003GL018065
DALL'OLMO, G.; DILLON, P. J. A critical review of vollenweider's nutrient budget model and other related models. Water Resources Bulletin, v. 10, p. 969-989, 1974. http://dx.doi.org/10.1111/j.1752-1688.1974.tb00617.x
DEERING, D. W. 1989. Field measurements of bidirectional reflectance. G. Asrar (Ed.),
Theory and Applications of Optical Remote Sensing, Wiley, New York (1989), pp. 14–65.
DILLON, P. J. A critical review of vollenweider's nutrient budget model and other related models. Water Resources Bulletin, v. 10, p. 969-989, 1974.
DILLON, P. J. The phosphorus budget of Cameron Lake: the importance of flushing rate to the degree of eutrophy in lakes. Limnology and Oceonography, Ontario, v. 19, p. 28-39, 1975.
DILLON, P. J.; KIRCHNER, W. B. The effects of geology and land use on the export of Phosphorus from Watersheds. Water Research, v. 9, p. 135-148, 1975. http://dx.doi.org/10.1016/0043-1354(75)90002-0
DUAN, H.; ZHANG, Y.; ZHANG, B.; SONG, K.; WANG, Z. Assessment of chlorophyll-a concentration and trophic state for Lake Chagan using Landsat TM and field spectral data. Environmental Monitoring Assessment, v. 129, p. 295–308, 2007. http://dx.doi.org/10.1007/s10661-006-9362-y
DUGGIN, M. J.; PHILIPSON, W. R. 1982. Field measurement of reflectance: some major considerations. Applied Optics, 21: 2833-2840.
GALO, M. L. B. T.; VELINI, E. D.; TRINDADE, M. L. B.; SANTOS, S. C. A. Uso do sensoriamento remoto orbital no monitoramento da dispersão de macrófitas nos reservatórios do complexo Tietê. Planta Daninha, v. 20, p. 7-20, 2002.
GEORGE, D. G. The airborne remote sensing of phytoplankton chlorophyll in the lakes and tarns of the English Lake District. International Journal of Remote Sensing, v. 18, n. 9, p. 1961-1975, 1997. http://dx.doi.org/10.1080/014311697217972
GITELSON, A.; DALL'OLMO, G.; MOSESA, W.; RUNDQUISTA, D. C.; BARROWB, T.; FISHERD, T. R.; et al. Effect of bio-optical parameter variability on the remote estimation of chlorophyll-a concentration in turbid productive waters: experimental results. Applied Optics, v. 44, n. 3, p. 412-422, 2005. http://dx.doi.org/10.1016/ j.rse.2008.04.015
GITELSON, A. A.; KONDRATYEV, K. Y. Optical models of mesotrophic and eutrophic water bodies. International Journal of Remote Sensing, v. 12, n. 3, p. 373-385, 1991. http://dx.doi.org/10.1080/01431169108929659
GITELSON, A. A.; DALL'OLMO, G.; MOSES, W.; RUNDQUIST, D. C.; BARROW, T. FISHER, T. R. et al. A simple semi-analytical model for remote estimation of chlorophyll-a in turbid waters: validation. Remote Sensing of Environment, v. 112, n. 9, p. 3582-3593, 2008. http://dx.doi.org/10.1016/j.rse.2008.04.015
GIARDINO, C.; BRANDO, V. E.; DEKKER, A. G.; STRÖMBECK, N.; CANDIANI, G. Assessment of water quality in lake Garda (Italy) using hyperion. Remote Sensing of Environment, v. 109, n.2, p. 183-195, 2007.
GONS, H. J.; RIJKEBOER, M.; RUDDICK, K. G. A chlorophyll-retrieval algorithm for satellite imagery (medium resolution imaging spectrometer) of inland and coastal waters. Jounal of Plankton Research, v. 24, n. 9, p. 947-951, 2002. http://dx.doi.org/10.1093/plankt/24.9.947
GUIMARÃES JR., C.; LEOPOLDO, R. R.; CURZ, J. A.; FONTANA, S. C. Aspectos limnológicos do reservatório de Ibitinga-SP. Revista Brasileira de Recursos Hídricos, v. 3, n. 1, p. 89-103. 1998.
KAUFMAN, Y. J.; WALD, A. E.; REMER, L. A.; GAO, B.C.; LI, R. R.; FLYNN, L. The MODIS 2.1-µm Channel-Correlation with Visible Reflectance for Use in Remote Sensing of Aerosol. IEEE Transactions on Geoscience and Remote Sensing, v. 35, p. 1286-1298, 1997.
KIRK, J. T. O. Light and photosynthesis in aquatic ecosystems. 3. ed. Cambridge: Cambridge University, 2011.
LONDE, L. R. Comportamento espectral do fitoplâncton de um reservatório brasileiro eutrofizado – Ibitinga (SP). 2008. 223f. Tese (Doutorado em Sensoriamento Remoto) - Instituto Nacional de Pesquisas Espaciais, São José dos Campos, 2008. Disponível em: <http://urlib.net/sid.inpe.br/mtc-m18@80/2008/08.18.12.14>. Acesso em: 10 de maio 2012.
LONDE, L. R.; NOVO, E. M. L. M.; CALIJURI, M. C. Aplicação de técnicas de sensoriamento remoto ao estudo do fitoplâncton de águas interiores. In: ALCÂNTARA, E.; NOVO, E. M. L. M.; STECH, J. L. (orgs.). Novas tecnologias para o monitoramento e estudo de reservatórios hidrelétricos e grandes lagos. Rio de Janeiro: Parêntese, 2011. p. 219-254.
LUZIA, A. P. Estrutura organizacional do phytoplankton nos sistemas lóticos e lênticos da bacia do Tietê- Jacaté (UGRHI-Tietê-Jacaré) em relação à qualidade da água e trophic state. 2009. Tese (Ph.D.) - Universidade Federal de São Carlos, São Carlos, 2009. MALTHUS, T. J.; DEKKER, A. G. First derivative indices for the remote sensing of inland
Rev. Ambient. Água vol. 8 n. 3 Taubaté - Sep. / Dec. 2013 MAYO, M.; GITELSON, A.; YACOBI, Y. Z.; BEN-AVRAHAM, Z. Chlorophyll
distribution in Lake Kinneret determined from Landsat Thematic Mapper data.
International Journal of Remote Sensing, v. 16, n. 1, p. 175-182, 1995. http://dx.doi.org/10.1080/01431169508954386
MILTON, E. J. Principles of field spectroscopy. International Journal of Remote Sensing, v. 8, n. 12, p. 1807-1927, 1987. http://dx.doi.org/10.1080/01431168708954818
MITTENZWEY, K.H.; ULLRICH, S.; GITELSON, A. A.; KONDRATIEV, K. Y. Determination of chlorophyll a of Inland Waters on the basis of spectral reflectance.
Limnology and Oceanography, v. 37, n. 1, p. 147-149, 1992.
MOBLEY, C. D. Estimation of the remote-sensing reflectance from above-surface measurements. Applied Optics, v. 38, p. 7442-7455, 1999. http://dx.doi.org/10.1364/ AO.38.007442
MOONEY, C. Z. Monte Carlo simulation. Newbury Park: Sage, 1997. (Sage University Paper series on Quantitative Applications in the Social Science).
MOSES, W. J.; GITELSON, A. A.; BERDNIKOV, S.; POVAZHNYY, V. Satellite estimation of Chlorophyll-a concentration using the red and NIR Bands of MERIS-The Azov Sea Case Study. IEEE Geoscience and Remote Sensing Letters, v. 6, v. 4, p. 845-849, 2009. http://dx.doi.org/10.1088/1748-9326/4/4/045005
MOSES, W. J.; GITELSON, A. A.; PERK, R. L.; GURLIN, D.; RUNDQUIST, D. C.; LEAVITT, B. C. et al. Estimation of chlorophyll-a concentration in turbid productive waters using airborne hyperspectral data. Water Research, v. 46, n.4, p. 993-1004, 2012a. http://dx.doi.org/10.1016/j.watres.2011.11.068
MOSES, W. J.; GITELSON, A. A.; BERDNIKOV, S.; SAPRYGIN, V.; POVAZHNYI, V. Operational MERIS-based NIR-red algorithms for estimating chlorophyll-a concentrations in coastal waters — The Azov Sea case study. Remote Sensing of Environment, v. 121, n. 6, p. 118-124, 2012b. http://dx.doi.org/10.1016/ j.rse.2012.01.024
NOVO, E. M. L. M.; BARBOSA, C. C.; FREITAS, R. M.; SHIMABUKURO, Y. E.; MELACK, J. M.; PEREIRA FILHO, W. Seasonal changes in chlorophyll distributions in Amazon floodplain lakes derived from MODIS images. Limnology, v. 7, p. 153-161, 2006. http://dx.doi.org/10.1007/s10201-006-0179-8
NOVO, E. M. L. M.; STECH, J. L. (orgs.). Novas tecnologias para o monitoramento e estudo de reservatórios hidrelétricos e grandes lagos. Rio de Janeiro: Parêntese, 2011. p. 219-254.
NUSH, E.A. Comparison of different methods for chlorophyll and phaeopigment determination. Arch. Hydrobiol. Beach. Stuttgart, v. 14 p.14-36. 1980.
NUSH, E.A.; PALME, G. Biologishe methoden fur die praxis der gewasseruntersuchung.
GwfWasser/Abwasser., v. 116 p.562-565. 1975.
ORGANIZATION FOR ECONOMIC COOPERATION AND DEVELOPMENT - OECD.
RITCHIE, J. C.; COOPER, C. M.; SCHIEBE, F. R. The relationship of MSS and TM digital data with suspended sediments, chlorophyll, and temperature in Moon Lake, Mississippi. Remote Sensing of Environment, v. 33, n. 2, p. 137-148, 1990. http://dx.doi.org/10.1016/0034-4257(90)90039-O
STRAŠKRABA, M. Retention time as a key variable of reservoir limnology, In: TUNDISI, J.G.; STRAŠKRABA, M. (Ed.). Theoretical reservoir ecology and its applications. São Carlos: International Institute of Ecology; Brazilian Academy of Sciences and Backhuys Publishers, 1999. p. 385-410.
SCHOWENGERDT, R. A. Remote sensing: models and methods for image processing. San Diego: Academic Press, 2007. 515p.
TOLEDO JR., A. P.; TALARICO, M. C.; AGUDO, S. J.; GARCIA, E. A aplicação de modelos simplificados para a avaliação do processo da eutrofização em lagos e reservatórios tropicais. Sao Paulo: CETESB, 34p. 1983.
TOLEDO JR., A. P. Informe preliminar sobre os estudos para a obtenção de um índice para a avaliação simplificada do estado trófico de reservatórios de regiões quentes tropicais. São Paulo: CETESB, 1990. 43p. Relatório Técnico.
TUCKER, J.; GRANT, D. M.; DYKSTRA, J. D. NASA’s global orthorectified Landsat data
set. Photogrammetric Engineering and Remote Sensing, v. 70, p. 313-322, 2004. TUNDISI, J. G.; MATSUMURA-TUNDISI, T.; PARESCHI, D. C.; LUZIA, A. P.; VON
HAELING, P. H.; FROLLINI, E. H. A bacia hidrográfica do Tietê/Jacaré: estudo de caso em pesquisa e gerenciamento. Estudos Avançados, v. 22, n. 63, p. 159-172, 2008. UNITED STATES. Environmental Protection Agency - USEPA. Summary analysis of the
North American (U.S. Portiona) OECD eutrophication project: nutrient loading –
lake response relationships and trophic state indices. Corvallis, 1978. (EPA-600/3-78-008, Ecological Research Series).
VALERIANO, M. M. Topodata: guia de utilização de dados geomorfométricos locais. São
José dos Campos: INPE, 2008.
VIEIRA, M. S.; FERREIRA , J. R. P.; CASTRO, M. G.; ROCHA, A. A. Aspectos da química da água e do sedimento do reservatório de Ibitinga (São Paulo- Brasil - 21° 45’ S e 48° 50’ W). Boletim do Instituto de Pesca, São Paulo, v. 28, n. 1, p. 77-91, 2002.
VOLLENWEIDER, R. A. Scientific fundamentals of the eutrophication of lakes and flowing waters, with particular reference to nitrogen and phosphorus as factors in eutophication. Paris: UNESCO, 1968. (OECD Technical Report, DAS/CSI/68)
YACOBI, Y. Z.; MOSES, W. J.; KAGANOVSKY, S.; SULIMANI, B.; LEAVITT, B. C. and GITELSON, A. A. NIR-red reflectance-based algorithms for chlorophyll-a estimation in mesotrophic inland and coastal waters: Lake Kinneret case study. Water Research, v. 45, n. 7, p. 2428-2436, 2011. http://dx.doi.org/10.1016/j.watres.2011.02.002