Abstract— Operational study of a biogas upgrading plant with cleaning and methane (CH4) enrichment has been presented in this study. Parametric study was conducted to investigate the effect of variation of process conditions for single stage without recycle (SSWR) and double stage with permeate recycle (DSPR) on product purity, CH4 recovery and compression power requirement. In the study, achieving high CH4 recovery and product purity simultaneously could not be attained in SSWR configuration. The performance of DSPR yielded a better result but with higher membrane area and compression power. DSPR configuration achieved high CH4 recovery and purity at increasing feed pressure, selectivity and feed flow. The CH4 losses increased in both configurations as %CO2 increased in the feed. DSPR configuration is considered the best configuration due to the end use of the product, as vehicular fuel, which requires high product purity.
Keywords—Biogas, methane enrichment, parametric study, membrane configuration
I. INTRODUCTION
Oreduce greenhouse gas emission and secure long-term energy supply globally, our exploitation of the earth’s finite resources such as fossil fuel must be reduced, while renewable energy must be developed as alternatives. The proportion of energy generated from renewable resources is expected to increase to >20% by 2020 [1]. During the same period, the greenhouse gas should decrease by 14% in 2020 compared with 2005 [1]. The use of biogas is considered as one of the most efficient means of utilizing the renewable energy and reducing greenhouse gas emission. Biogas generated from the anaerobic decomposition of organic matter comprises mainly methane (CH4), carbon dioxide (CO2), smaller traces of acidic gases and impurities such as hydrogen sulphide (H2S), nitrogen (N2), water vapour (H2O) and traces of other volatile organic gases (VOCs) [2]. The precise concentration of these gases in any particular biogas sample depends on the source of substrate and operating process conditions, however, the reported range is typically 40-70% vol. of CH4 while CO2 and other trace gases takes
Manuscriptreceived July 23, 2014; revised August 09, 2014. This work is fully funded by South African National Energy Development Institute (SANEDI) and supported by NOVO as Industrial partners.
S. O. Masebinu is with the department of Chemical Engineering, University of Johannesburg, Doornfontein, South Africa ([email protected])
A. O. Aboyade is an Energy and Sustainability specialist with Process Energy and Environmental Technology Station (PEETS), Faculty of Engineering and the Built Environment, University of Johannesburg, Doornfontein Campus, South Africa ([email protected]).
E. Muzenda is a Professor of Chemical Engineering. He is the head of Environmental and Process Systems Engineering Research Unit, Faculty of Engineering and the Built Environment, University of Johannesburg, Doornfontein, P O Box 17011, 2028, South Africa (Email:
up the remaining percentage volume [2]. Upgrading biogas to fuel grade biomethane involves two major processes; cleaning and CH4 enrichment. The cleaning of the biogas consists of removal of acidic gases and impurities, while the enrichment process is for separation of CO2 from biogas. The removal of trace impurities and the elimination of CO2 from the biogas, which leads to a corresponding increase in CH4 concentration will not only increase the calorific value of the biogas, but will also reduce corrosion of internal combustion engine parts caused by acid gas components. After upgrading, the final product is referred to as biomethane, typically containing 95-99% CH4 and 1-3% CO2 which makes it suitable as vehicular fuel. Current technologies for cleaning of biogas and its subsequent CH4 enrichment are physiochemical processes which can be grouped as follows [3].
Absorption process (physical and chemical absorption) Hybrid solution (mixed physical and chemical solvent) Physical separation (adsorption on solid surface;
membrane; cryogenic)
Each of the cleaning and enrichment technologies, except for cryogenic separation processes, are in operation on large scale and can deliver biomethane that meets vehicular fuel standard [4]. The use of membranes, which is the main technology of interest in this study, exhibit many advantages in comparison to other conventional method of biogas upgrading, including lower operation cost, easier maintenance and greater process flexibility, no need for chemicals, the absence of phase and temperature changes, which results in low energy requirement [2], [5], [6]. Despite these advantages, it is difficult for membrane permeation systems to compete with the more common absorption based processes such as amine scrubbing, especially when processing high volume of biogas [7]. Higher CH4 losses generated by membrane systems increases gas processing cost [7]. However, the CH4 lost during the upgrading process of biogas obtained from anaerobic digesters, can be used as fuel for heat generation since anaerobic digestion typically requires higher than ambient temperature for optimal operation [7].
A membrane separation process is used to split a feed mixture containing two or more species through a semi-permeable barrier where the species that moves through the barrier is called permeate and the other that does not move through is called retentate [8]. Gases can be separated on two types of membrane; dense membrane (non-porous) and porous membrane [9]. The transportation of gases through dense membrane occurs via solution diffusion while porous membrane occurs via Knudsen flow, selective adsorption/diffusion and molecular sieving [9], [10]. The
Parametric Study of Single and Double Stage
Membrane Configuration in Methane
Enrichment Process
S. O. Masebinu, A. O. Aboyade Member, IAENG, and E. Muzenda, Member, IAENG
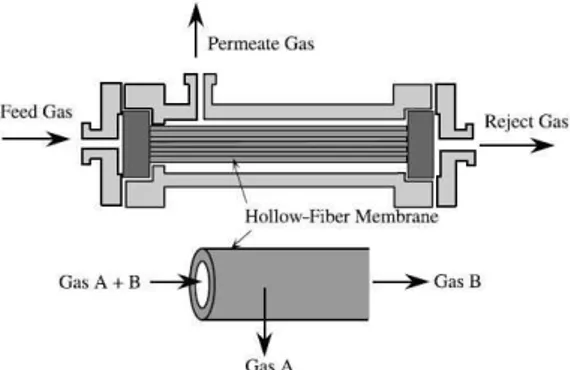
transportation of gases through membrane takes place when a driving force is applied to the gaseous species. This driving force is mostly due to pressure difference or concentration difference across the membrane [9]. Various membrane materials are able to separate CO2 & CH4 and both polymeric as well as inorganic materials can be used. However, in industrial scale gas separation, only polymeric membrane materials are applied due to their low manufacturing cost when compared to inorganic materials [11]. The efficiency of a given membrane is determined by two parameters; its selectivity and the flow through the membrane [9]. The latter often denoted as the flux or permeation rate, is defined as the volume flowing through the membrane per unit area and time [9]. In other literature, the flow through the membrane has been further divided into pressure ratio, which is the ratio of feed pressure to permeate pressure across the membrane, and stage cut, which is the fraction of the feed gas that permeates the membrane [12]. The selectivity of two gases ‘a’ and ‘b’ in a membrane is defined as the permeability of gas ‘a’ divided by permeability of gas ‘b’ which coefficient, sorption or diffusion depends on the type of material that is used in the membrane [13]. In order to apply membranes on an industrial scale, large membrane area are normally required [14]. Membranes are grouped together to form a bundle, since the permeability of a single membrane is not so high [14]. The bundle of membrane is installed into a pipe called module which is the smallest practical unit of membrane area [9]. Three types of module exist; hollow fiber modules; spiral wound modules & envelope type module [11]. Hollow fiber is commonly used in industry due its high packing density, low investment and operating cost [9], [11]. However, pre-treatment process is always required when hollow fiber is used because it is very susceptible to fouling and difficult to clean [9]. Fig. 1 shows a schematic diagram of a hollow fiber membrane [14].
Fig. 1 Schematic diagram of a hollow fiber membrane
The arrangement of modules for separation to achieve a desired product purity and recovery of feed specie is called stage(s) [9]. This arrangement is based on economic consideration and end use of the product [9]. On economic consideration, three important elements are considered; the cost of membrane plant (membrane element and pressure housing); the capital and operating cost; and product losses [15]. The quality of the product depends on the end use. Critical operating parameters that affects the quality of upgraded biogas and CH4 recovery in using membrane are the operating pressure, the raw biogas feed flow rate which is a function of the plant capacity, and composition of the
feed [1]. Membrane configuration has been reported to be of single stage without recycle, multistep single stage and multistage configurations [3], [9], [12]. A single membrane module or a number of such modules arranged in parallel or in series without recycle with a single pass flow constitute a single stage membrane separation process [16]. The extent to which a feed mixture can be separated in the single stage is limited. Thus, in order to achieve a higher degree of separation, cascades of membrane modules with recycle are often used. Multistage configuration of two stages or more has been reported to yield higher CH4 recovery and product purity though with higher investment cost due to additional membrane area and compression cost [15].
The usual target of an enrichment process using membrane is to produce a retentate stream essentially stripped of CO2 and with a low flowrate but highly CO2 rich permeate stream. These two requirements cannot be met simultaneously; a trade-off must be made between CH4 recovery and purity. Therefore, this work presents a simulation of two possible membrane configurations of an existing operational biogas upgrading plant that uses hollow fiber membrane module for CH4 enrichment with descriptive detail of the cleaning process. The simulation was conducted to investigate the performance of the configurations on product purity, product recovery and compressor power requirement. A parametric study investigating the effects of variations of feed composition, operating pressure and feed flow rate was conducted, with a view to investigate the performance of the configurations from an operation point of view.
II. DESCRIPTION OF PROCESS PLANT A. Biogas Cleaning Process
The raw biogas used in the upgrading process was generated from a closed landfill at Sebenza in the Ekurhuleni Municipality of South Africa. Pipes were bored into the landfill for extraction of the biogas generated by the natural decomposition of the organic fraction of waste. The biogas composition is as follows; CO2 38.9%; CH4 55%; O2 0.4%; N2 5%; H2S 0.002% and H2O 0.66%. The biogas stream was made to go through a vessel packed with high efficient iron-III-oxide (Fe2O3) adsorbent for preliminary desulphurization according to the following reaction:
based for lubrication. A pressure swing adsorption (PSA) with activated alumina (Al2O3) was used for completed dehydration of the biogas. The N2, siloxane, possible H2S and other traces of volatile organic gases (VOCs) were adsorbed using an activated carbon filter. All unit operations up to this point were considered part of the cleaning process. The resulting biogas has about <5% vol. N2, 1ppm H2S and ppb levels for VOCs and siloxanes which is deemed not harmful to the membranes in the subsequent enrichment process.
B. Methane Enrichment
The most important task required to achieve fuel grade biomethane is the separation of CO2 from the product gas stream. The plant studied used hollow fiber membrane for the separation of CO2 from the biogas to achieve the desired fuel grade biomethane. The first membrane module was fed from the bore side at 10.311bar & 36°C. The permeate stream of the first membrane module which leaves at about 1.082bar was used to purge the PSA unit. The retentate stream leaves the membrane at 8.82bar and a slight temperature drop, with a high concentration of methane. This serves as the feed stream for the second stage separation. A sampling point is available for each membrane module. Gas species of the product stream can be randomly evaluated and the composition of gases through the membrane can be known. The permeate stream of the second membrane module, which contains significantly higher amounts of CH4 as compared to permeate of the first stage, was recycled back for recompression through the suction of the compressor. Biomethane produce during the second stage separation is the desired product which is stored into a vessel after which it was odourised with mercaptan as a safety procedure and for leak detection. The last stage is compression of the biomethane to 220bar into high pressure cylinders.
III. METHODOLOGY A. Process Simulation
The simulation of the upgrading process was done using ChemCAD, a steady state process simulator, from Chemstation. The PSA unit, a dynamic and unsteady state process, was represented with a component separator unit operation and was constrained to plant result for H2O and H2S removal. The cleaning process according plant data effectively eliminated vapour and H2S content in the biogas while N2 was reduced to acceptable limit; hence in the enrichment process simulated, CO2 and CH4 were only considered.
B. Data Collection
The process operating conditions were data collected from the plant. The membrane intrinsic properties (selectivity and permeability), configurations and module design data were not shared due to intellectual property infringement and confidentiality concerns. Intrinsic properties were obtained from literature while the module design data was provided by Almeesoft Engineering, USA. The module design data were verified by the plant manager
and was accepted to be inconformity with industrial standard.
C. Membrane Module Design and Simulation Validation A built-in membrane model for gas permeation available in ChemCAD 6.5.5 was used for the CH4 enrichment. Almeesoft Engineering gas permeation software was also interface with ChemCAD during sensitivity analysis to study the effect of varying the process conditions on CH4 recovery and product purity. The important process parameter specified for the simulation of the membrane is given in TABLE I and represents base condition for the simulation.
TABLE I
PROCESS PARAMETER FOR MEMBRANE SIMULATION Parameter
Feed pressure 9.9bar
Permeate pressure 1.08bar
Feed flow rate 80m3/h
Flow mode Counter-current
Feed side bore
Temperature 30°C
Compressor stages 2
Cooling medium water
CO2 permeability1 440 Barrer CH4 permeability1 28.2 Barrer N2 permeability1 35.6 Barrer O2 permeability1 111 Barrer CO2/CH4 selectivity 15.6 CO2/N2 selectivity 12.4 CH4/N2 selectivity 0.79 CO2/O2 selectivity 3.96 Account for shell pressure drop yes
1Harasimowicz, et al. [18]
Two membrane configurations was considered for this study; single stage without recycle (SSWR) and double stage with permeate recycle (DSPR) as shown in Fig. 2. The configurations were simulated to investigate the performance of each configuration to varying operation parameters. The following assumptions were considered for the hollow fiber membrane module for the study. (1) Transport properties of the membrane are independent of variation in gas composition throughout the separation. (2) No flux coupling between gas components. (3) Deformation of the hollow fiber under pressure is negligible. Based on these assumptions, sensitivity analysis was carried out on both configurations and the results were discussed.
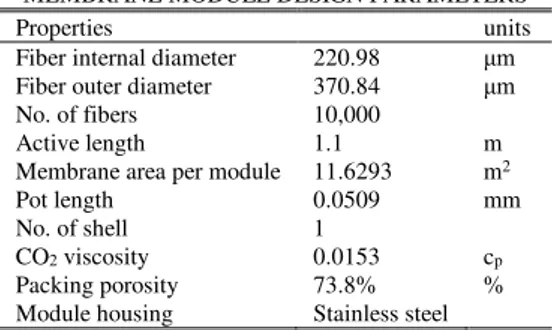
The membrane data for each module was computed based on the module specification provided by the end user into the simulator. Parameters considered in the membrane module design are as listed in the TABLE II. The process simulation for the cleaning and CH4 enrichment process was validated by the plant upgrading process result.
TABLE II
MEMBRANE MODULE DESIGN PARAMETERS
Properties units
Fiber internal diameter 220.98 μm Fiber outer diameter 370.84 μm
No. of fibers 10,000
Active length 1.1 m
Membrane area per module 11.6293 m2
Pot length 0.0509 mm
No. of shell 1
CO2 viscosity 0.0153 cp
Packing porosity 73.8% %
Fig. 2. Schematic diagram of the membrane configuration having (A) Single stage without recycle (SSWR), (B) Double stage with permeate recycle (DSPR).
IV. RESULT AND DISCUSSION A. Process Simulation Validation
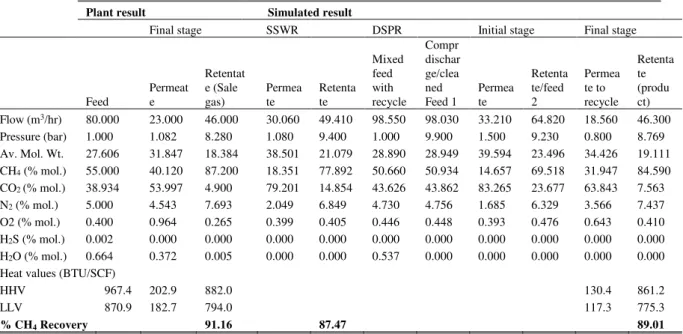
TABLE III shows the results of the simulation against those of plant upgrading. The plant had 91.16% CH4 recovery with 87.2% CH4 purity. The two proposed configuration for this analysis was simulated to determine their performance against plant result. SSWR yielded 87.47% CH4 recovery with 77.89% CH4 purity while DSPR
yielded 89.01% CH4 recovery with 84.59% CH4 purity. The simulated DSPR process suggests a good approximation to the plant data with a percentage error of 2.64%. The error in the comparison could be attributed to higher CO2/CH4 selectivity of the plant membrane and feed pressure drop within the membrane module. Sensitivity study was carried out on both configurations to study the effect of varying process operating condition on CH4 recovery, purity and compressor power requirement.
TABLE III
VALIDATION OF THE PROCESS SIMULATION WITH PLANT DATA
Plant result Simulated result
Final stage SSWR DSPR Initial stage Final stage
Feed
Permeat e
Retentat e (Sale gas)
Permea te
Retenta te
Mixed feed with recycle
Compr dischar ge/clea ned Feed 1
Permea te
Retenta te/feed 2
Permea te to recycle
Retenta te (produ ct) Flow (m3/hr) 80.000 23.000 46.000 30.060 49.410 98.550 98.030 33.210 64.820 18.560 46.300 Pressure (bar) 1.000 1.082 8.280 1.080 9.400 1.000 9.900 1.500 9.230 0.800 8.769 Av. Mol. Wt. 27.606 31.847 18.384 38.501 21.079 28.890 28.949 39.594 23.496 34.426 19.111 CH4 (% mol.) 55.000 40.120 87.200 18.351 77.892 50.660 50.934 14.657 69.518 31.947 84.590 CO2 (% mol.) 38.934 53.997 4.900 79.201 14.854 43.626 43.862 83.265 23.677 63.843 7.563 N2 (% mol.) 5.000 4.543 7.693 2.049 6.849 4.730 4.756 1.685 6.329 3.566 7.437 O2 (% mol.) 0.400 0.964 0.265 0.399 0.405 0.446 0.448 0.393 0.476 0.643 0.410 H2S (% mol.) 0.002 0.000 0.000 0.000 0.000 0.000 0.000 0.000 0.000 0.000 0.000 H2O (% mol.) 0.664 0.372 0.005 0.000 0.000 0.537 0.000 0.000 0.000 0.000 0.000
Heat values (BTU/SCF)
HHV 967.4 202.9 882.0 130.4 861.2
LLV 870.9 182.7 794.0 117.3 775.3
B. Methane Recovery and Product Purity 1) Effect of %CO2 in Feed
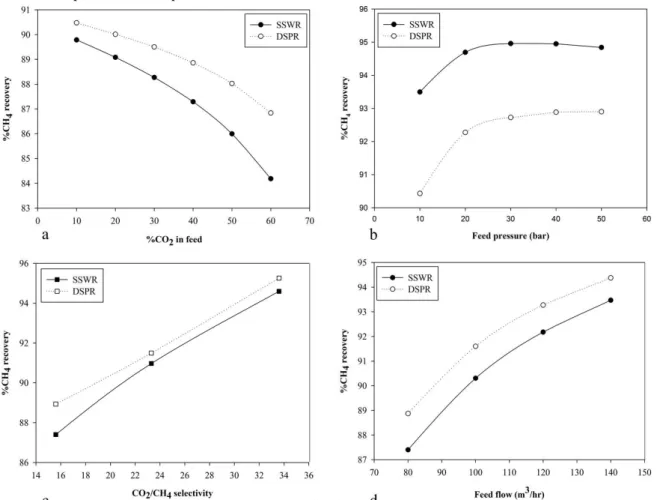
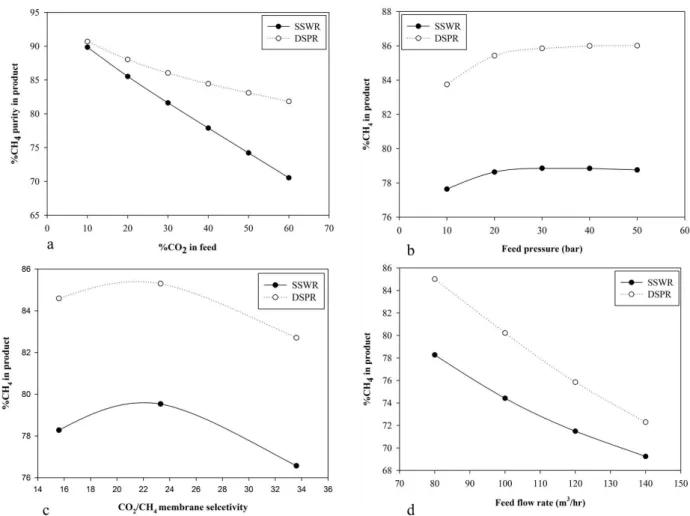
Figs. 3a, 4a and 5a show the effect of increased CO2 content in feed on CH4 recovery, purity of product and membrane area required for separation on both configurations respectively. 89.8% CH4 recovery was achieved with about 10% CO2 in the feed stream in the SSWR configuration requiring 25.7m2 of membrane area to achieve 89.85% CH4 in the product. In DSPR configuration, CH4 recovery was 90.48% with a product purity of 90.69% requiring 51.75m2 membrane area for 10% CO
2 in the feed. As the CO2 concentration increased, CH4 recovery reduces as well as purity of product but with an increase in membrane area. With 60% CO2 in the feed, CH4 recovery has reduced to 84.19% with a 70.54% CH4 in the product while for DSPR, 86.8% CH4 recovery was achieved with 82% CH4 in the product. Membrane area increased to 27m2 for SSWR while DSPR required 53.58m2. DSPR achieved higher CH4 recovery and purity over SSWR because more membrane area was available for separation. Also the recycling of permeate of the second stage membrane separation ensures that less CH4 is lost in DSPR configuration.
2) Effect of Feed Pressure
Figs. 3b, 4b and 5b show the effect of feed pressure on CH4 recovery for both configurations, product purity and membrane area required respectively. The process condition and membrane shell data remains the same as earlier described except for the feed pressure been varied. It was
observed as shown in Fig. 3b that increasing the feed pressure increased CH4 recovery until a limit is reached where further increase in the pressure does not improve the CH4 recovery rate. As the feed pressure increases from 10bar to 30bar, the CH4 recovery increases rapidly from 93.5% to 94.96% for SSWR and thereafter the increase in pressure causes a gradual reduction in CH4 recovery to 94.84% at 50bar. DSPR also achieved an increase in CH4 recovery from 90.4% to 92.7% as feed pressure increased from 10-30bar. Further increase in pressure only increased the CH4 recovery by 0.2%. CH4 recovery was higher for SSWR when compared to DSPR because after the first stage separation, the feed pressure to the second stage which is the driving force reduces and causes a reduction in separation efficiency of the second stage as compared to the first stage. But despite a lower CH4 recovery, the product purity achieved in the DSPR, 83.75% to 86.01%, when compared to SSWR, 77.6% to 78.8%, as shown in Fig. 3b, was much higher. At lower pressure, the high packing density advantage of hollow fiber membrane becomes increasingly important due to the high membrane area available hence higher purity can still be achieved. The increase in CH4 recovery and purity of product can also be attributed to the fact that the increased pressure creates a greater driving force across the membrane surface area while the almost constant CH4 recovery after its peak, in this case 30bar is
due to the membrane module design.
Fig. 3. (a) Effect of %CO2 in feed, (b) Effect of feed pressure, (c) Effect of membrane selectivity, (d) Effect of feed flow rate Improving the overall structural design will increase the
membrane performance with variation in process condition [7]. This suggests that achieving high CH4 recovery does not only depend on improving the process condition but also ensuring that an appropriate equipment design is implemented to accommodate changes in process condition. Also a higher CH4 recovery was achieved and the required membrane area decreased as the feed pressure increases as shown in Fig. 5b. As the feed pressure increases from 10-30bar, the membrane area for SSWR decreases from 26m2 to 9m2 after which increasing feed pressure to 50bar only causes a reduction to 6.7m2. DSPR uses higher membrane area for separation which ensures high product purity is achieved as feed pressure increases until it reaches its peak. The behaviour of DSPR is also similar to SSWR, as feed pressure increase to 30bar, there as a significant reduction in membrane area required from 57.6m2 to 19.6m2, after which an increase in pressure resulted in fluctuation in membrane area. This fluctuation suggests that the module has reached its pressure limit with respect to module design. It may be economically justified in some circumstances to increase the compression pressure of the feed stream to reduce membrane area cost and improve recovery but the structural design of the membrane casing to safely accommodate such pressure must be considered. Hence a feed pressure of 18bar will be considered as an optimal and safe operating pressure for the DSPR based on the module design data provided.
3) Effect of Membrane Selectivity
Membrane intrinsic properties have high influence on CH4 recovery which increases with an increase in the selectivity of the membrane [3]. Figs. 3c, 4c and 5c shows the effect of selectivity on CH4 recovery, product purity and membrane area required respectively. An increase in the membrane selectivity from 15.8 to 33.3, while other process conditions were held constant, resulted in a spontaneous increase in the CH4 recovery from 87.4% to 94.6% for SSWR while DSPR increased from 88.9% to 95.3% as shown in Fig. 3c. The product purity for both configuration increased as selectivity increased from 15.6 to 23.3, SSWR increased from 78.3% to 79.5% while DSPR increased from 84.6% to 85.3%. A reduction was observed as the selectivity increases to 33.6 with SSWR CH4 purity in product reducing to 76.6% and DSPR to 82.7 as shown in Fig. 4c. The reduction could be attributed to selectivity properties of the membrane towards CO2. If less CO2 permeate through the membrane, the CO2 concentration in the product stream increases hence the product purity decreases. Also it has been reported in literature that highly permeable polymers have low selectivity and vice versa [19]. Hence a general trade off relationship between gas permeability and selectivity is required.
Aside increase in CH4 recovery, increasing the selectivity reduces the required membrane area for separation as shown in Fig. 5c. With 15.6 CO2/CH4 selectivity, membrane area required to achieve 87.4% CH4 recovery was 26.38m2 for SSWR and at 33.3 selectivity, 12.63m2 was required to achieve 94.6%CH4 recovery. For DSPR, 52.40m2 was required to achieve 88.9% CH4 recovery with 84.6% product purity and at 33.6 selectivity, 27.69m2 was required to
achieve 95.3% CH4 recovery. The decrease in membrane area is due to the intrinsic property of the membrane to permeate more CO2 over the initial contact area of the membrane and the feed gas.
4) Feed Flow Rate
Figs. 3d and 4d shows the effect of increasing feed flow rate on CH4 recovery and product purity. The plant been studied has the capacity to produce between 20-100m3/hr biomethane. The base feed flow rate been used for this study was 80m3/hr. Increasing the feed flow rate, CH
4 recovery increased from 87.4% and 88.9% at 80m3/hr to 93.5% and 94.4% at 140m3/hr feed flow for both SSWR and DSPR respectively as shown in Fig. 3d. The product flow rate peaked at 103m3/hr for SSWR and 100.5m3/hr for DSPR. This shows that if the plant is operating at full capacity, more CH4 will be recovered in the process and CH4 lost will be reduced. The product purity reduces as the feed flow rate increases as shown in Fig. 4d. CH4 in product reduces from 78.27% to 69.24% for SSWR while DSPR had a reduction from 85.02% to 72.29%. It was also observed that as the feed flow rate increases from 80m3/hr to 140m3/hr, there was a slight increase in the membrane area. The membrane area increased from 26.38m2 to 28.4m2 for SSWR and from 53.2m2 to 54.6m2 for DSPR. The reduction in product purity as feed flow increases was due to insufficient membrane area for separation hence more CO2 is not permeated and its presence in the retentate reduces the purity of the product.
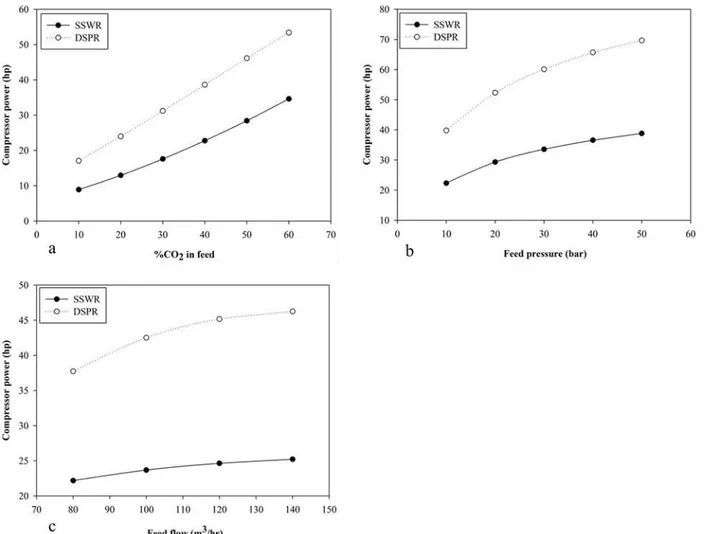
C. Compressor Power Requirement
Fig. 4. Effect of varying process parameters on product purity (a) Effect of %CO2 in feed; (b) Effect of feed pressure (c) Effect of
membrane selectivity (d) Effect of feed flow
Fig. 5. Effect of variation of process variables on membrane area (a) Effect of %CO2 in feed (b) Effect of feed pressure (c) Effect of
Fig. 6. Effect of variation of process parameters on compressor power (a) Effect of %CO2 in feed (b) Effect of feed pressure (c) Effect of
feed flow
The result of the parametric sensitivity analysis is consistent with previously published simulated work of Deng andHagg [1], Ahmad, et al. [3] and Chmielewski, et al. [2] on membrane performance in methane enrichment process.
V. CONCLUSION
Parametric study of a biogas upgrading plant that considered cleaning of impurities in biogas and subsequent CH4 enrichment using membrane has been presented. The simulated process was validated with an existing biogas upgrading plant result. The parametric study investigated the effect of varying feed composition, pressure and flow rate in enrichment process on CH4 recovery on two configurations. Increasing CO2 in feed reduces the CH4 recovery by 6.23% for SSWR and 4% for DSPR. Product purity for SSWR reduced by 21.5% while DSPR product purity reduced by 9.7% as CO2 increases in the feed. An increase in membrane selectivity from 5.68 to 33.33 increased CH4 recovery by 8.2% for SSWR and a reduction in membrane area by 52.1%. Also, the increase in selectivity increased CH4 recovery by 7.11% in DSPR and a reduction in membrane area by 47.73%. The product purity in DSPR was 8% higher than SSWR. Pressure increase also increased CH4 recovery up to the module design configuration limit. Increasing feed flow rate from 80-140m3/hr increased CH
4 recovery by 6.98% for SSWR. Similarly, 6.2% increase in CH4 recovery was achieved in DSPR with a product purity that is 4.4%
higher than SSWR. SSWR configuration requires less compression power and membrane area but CH4 recovery and purity of the product stream was low. DSPR achieved higher CH4 recovery and product purity at the expense of compressor power and membrane area. If the desired end use of the product requires high product purity and recovery like the plant under study, a DSPR is recommended though the investment cost may be high due to increased membrane area and compression cost. SSWR configuration will be suitable if product purity required is not high.
ACKNOWLEDGMENT
The authors wish to acknowledge South African National Energy Development Institute (SANEDI) for providing funding for this project, the industrial partners, NOVO, for granting access to their plant and Dr. Alexander Narinsky of Almeesoft Engineering for providing the software for the gas permeation calculation.
REFERENCE
[1] L. Y. Deng and M. B. Hagg, "Techno-economic evaluation of biogas upgrading process using CO2 facilitated transport membrane,"
International Journal of Greenhouse Gas Control, vol. 4, pp. 638-646, Jul 2010.
[2] A. G. Chmielewski, A. Urbaniak, and K. Wawryniuk, "Membrane enrichment of biogas from two-stage pilot plant using agricultural waste as a substrate," Biomass & Bioenergy, vol. 58, pp. 219-228, Nov 2013.
CO2 capture from natural gas," Computers & Chemical
Engineering, vol. 36, pp. 119-128, Oct, 1 2012.
[4] E. Ryckebosch, M. Drouillon, and H. Veruaeren, "Techniques for transformation of biogas to biomethane," Biomass & Bioenergy, vol. 35, pp. 1633-1645, May 2011.
[5] M. H. M. Chowdhury, "Simulation, design and optimization of membrane gas separation, chemical absorption and hybrid processes for CO2 capture," PhD, Chemical Engineering, University of Waterloo, Waterloo, Ontario, 2011.
[6] S. O. Masebinu, A. O. Aboyade, and E. Muzenda, "Enrichment of biogas for use as vehicular fuel: A review of the upgrading techniques," International Journal of Research in Chemical, Metallurgical and Civil Engineering, vol. 1, pp. 89-98, Jun 2013. [7] A. Makaruk, M. Miltner, and M. Harasek, "Membrane biogas
upgrading processes for the production of natural gas substitute,"
Separation and Purification Technology, vol. 74, pp. 83-92, Jul 30 2010.
[8] M. Bagajewicz, C. Ryden, and H. Baumgarner, "Use of membrane in gas conditioning," 2009.
[9] M. Mulder, Basic principle of membrane technology, 2 ed. Twente, Netherlands: Kluwer Academic Publisher, 1996.
[10] J. P. Williams and W. J. Koros, "Gas separation by carbon membranes," in Advanced membrane technology & applications, N. L. Norman, G. F. Anthony, Winston Ho, W. S., and T. Matsuura, Eds., ed Canada: Wiley, 2008, pp. 599-632.
[11] M. Scholz, T. Melin, and M. Wessling, "Transforming biogas into biomethane using membrane technology," Renewable and Sustainable Energy Reviews, vol. 17, pp. 199-212, Oct. 23 2012. [12] R. W. Baker, Membrane technology and applications, 2 ed.
Carlifornia, USA: John Wiley & Sons Ltd, 2012.
[13] F. Bauer, C. Hulteberg, T. Persson, and D. Tamm, "Biogas upgrading - Review of commercial technologies," Svenskt Gastekniskt Center (SGC) AB, Malmö, Sweden2013.
[14] Y. Kase, "Gas separation by polymide membranes," in Advanced membrane technology & applications, N. L. Norman, G. F. Anthony, Winston Ho, W. S., and T. Matsuura, Eds., ed Canada: Wiley, 2008, pp. 581-598.
[15] R. Spillman, "Economics of gas separation membrane processes," in
Membrane separation technology: Principles & application, R. D. Noble and S. A. Stern, Eds., ed Beverly, USA: Elsevier, 2003, pp. 589-668.
[16] K. Scott, Handbook of industrial membranes. Oxford, UK: Elsevier Advanced technology, 1995.
[17] D. M. Wang, "Breakthrough behavior of H2S removal with an iron oxide based CG-4 adsorbent in a fixed-bed reactor," Master of Science, Chemical Engineering, University of Saskatchewan, Saskatoon, 2008.
[18] M. Harasimowicz, P. Orluk, G. Zakrzewska-Trznadel, and A. G. Chmielewski, "Application of polyimide membranes for biogas purification and enrichment," Journal of Hazardous Material, vol. 144, pp. 698-702, Jun 18 2007.