Space Use Variation in Co-Occurring Sister
Species: Response to Environmental Variation
or Competition?
Claire M. S. Dufour1,2*, Christine Meynard3¤, Johan Watson4, Camille Rioux1,
Simon Benhamou5, Julie Perez1, Jurie J. du Plessis6, Nico Avenant6, Neville Pillay2, Guila Ganem1,2*
1Institut des Sciences de l’Evolution de Montpellier UMR5554 (UM2, CNRS, IRD, EPHE), Université Montpellier 2, CC065, 34095 Montpellier, France,2School of Animal, Plant and Environmental Science, University of the Witwatersrand, P/Bag 3, 2050 Wits, South Africa,3INRA UMR CBGP, (INRA/IRD/Cirad/ Montpellier SupAgro), Campus international de Baillarguet, CS 30016, F-34988 Montferrier-sur-Lez cedex, France,4Department of Economic Development, Tourism and Environmental Affairs, Biodiversity Research, P/Bag X20801 9300 Bloemfontein, South Africa,5Centre d’Ecologie Fonctionnelle et Evolutive, UMR 5175 (CNRS, UM2), Montpellier, France,6Department of Mammalogy, National Museum, and Centre for Environmental Management, University of the Free State, Bloemfontein, South Africa
¤ Current address: Virginia Institute of Marine Science, College of William & Mary, P.O. Box 1346, Gloucester Point, VA 23062, United States of America
*[email protected](CMSD);[email protected](GG)
Abstract
Coexistence often involves niche differentiation either as the result of environmental diver-gence, or in response to competition. Disentangling the causes of such divergence requires that environmental variation across space is taken into account, which is rarely done in empir-ical studies. We address the role of environmental variation versus competition in coexis-tence between two rodent species:Rhabdomys bechuanae(bechuanae) andRhabdomys dilectus dilectus(dilectus) comparing their habitat preference and home range (HR) size in areas with similar climates, where their distributions abut (allopatry) or overlap (sympatry). Using Outlying Mean Index analyses, we test whether habitat characteristics of the species deviate significantly from a random sample of available habitats. In allopatry, results suggest habitat selection:dilectuspreferring grasslands with little bare soil whilebechuanaeoccurring in open shrublands. In sympatry, shrubland type habitats dominate and differences are less marked, yetdilectusselects habitats with more cover thanbechuanae. Interestingly, bechua-naeshows larger HRs thandilectus, and both species display larger HRs in sympatry. Fur-ther, HR overlaps between species are lower than expected. We discuss our results in light of data on the phylogeography of the genus and propose that evolution in allopatry resulted in adaptation leading to different habitat preferences, even at their distribution margins, a di-vergence expected to facilitate coexistence. However, since sympatry occurs in sites where environmental characteristics do not allow complete species separation, competition may ex-plain reduced inter-species overlap and character displacement in HR size. This study re-veals that both environmental variation and competition may shape species coexistence.
a11111
OPEN ACCESS
Citation:Dufour CMS, Meynard C, Watson J, Rioux C, Benhamou S, Perez J, et al. (2015) Space Use Variation in Co-Occurring Sister Species: Response to Environmental Variation or Competition?. PLoS ONE 10(2): e0117750. doi:10.1371/journal. pone.0117750
Academic Editor:Danilo Russo, Università degli Studi di Napoli Federico II, ITALY
Received:August 29, 2014
Accepted:December 18, 2014
Published:February 18, 2015
Copyright:© 2015 Dufour et al. This is an open access article distributed under the terms of the Creative Commons Attribution License, which permits unrestricted use, distribution, and reproduction in any medium, provided the original author and source are credited.
Data Availability Statement:The data are available in FigShare (http://dx.doi.org/10.6084/m9.figshare. 1281368).
Funding:This work was supported by Free State DTEEA, SIBAGHE, the French CNRS/SA NRF agreements through PICS (n°4841 and n°81859) and GDRI (n°191) programs. The funders had no role in study design, data collection and analysis, decision to publish, or preparation of the manuscript.
Introduction
The concept of character displacement is the subject of regular debate in ecology [1–4]. Eco-logical character displacement is defined as a process where populations respond to competi-tion by modifying their resource-use traits through phenotypic plasticity or genetic adaptacompeti-tion [5]. This response to competition plays an important role in generating and maintaining biodi-versity as well as shaping the mechanisms of coexistence [1,6,7], particularly between species sharing similar niches [8]. However, solid empirical evidence demonstrating the process of character displacement is rare (shown in only 9 out of 144 studies reviewed in [4]), partly due to confusion between character variation and character displacement [4,9]. Character variation due to ecological heterogeneity could occur when species adapt to distinct environments in al-lopatry, and may not be interpreted as character displacement when the same species are found to be divergent in sympatry [9]. Moreover, when species occur along a gradient of envi-ronmental conditions, their traits may converge in sympatry despite competition [10]. In such conditions, ecological heterogeneity across space has been argued to be a more convincing cause of character variation than competition [4].
Our study aims to test the role of adaptation to distinct environments versus competition leading to character displacement in shaping coexistence between two sister species of the Afri-can four striped mouse:Rhabdomys bechuanae(sensu [11], hereafterbechuanae) and Rhabd-omys dilectus dilectus(sensu [12], hereafterdilectus). We focus here on space use, an important dimension of the niche [13] because it determines access to resources, and hence could directly influence reproductive success and survival [14]. Further, the evolution of this complex trait could be shaped both by environmental conditions [15,16] and competitive interference in areas of coexistence [17,18].
Space use, or the spatial dimension of a species niche, can be described at beta and alpha scales [19]. The beta scale considers the climate and environmental conditions over the entire range of the species defining its environmental niche. The alpha scale considers niche variation between individuals and populations (i.e.“the niche variation hypothesis”, [20]) and allows for a more detailed assessment of niche characteristics.
We studied the spatial niche of the two striped mouse species at an alpha scale by analyzing their habitat use and home range (HR) characteristics. The striped mouse shows marked differ-entiation across climate and vegetation along an east-to-west gradient in southern Africa [11,21]. Large scale studies, modelling the two species’niches over South Africa and Namibia suggested environmental divergence,dilectusbeing found in the wetter areas of the north-east-ern parts of South Africa where grassland vegetation dominates, whilebechuanaeoccupies warmer and drier regions and penetrates into the more mesic central part of South Africa with-in areas where open shrubland vegetation domwith-inates [11,21]. Such a divergence could either be the result of adaptation in distinct environmental conditions, or reflect a large range of plastic responses to the environmental gradient occupied by the two species. Here, we test the role of adaptation versus plasticity in this divergence and disentangle the role of ecological heteroge-neity versus competition in shaping species coexistence in the field.
would expect little competition, if any, on the spatial dimension of the species niche. Alterna-tively, if environmental heterogeneity does not allow complete habitat separation, competition is expected to induce character displacement, even if sympatry is only temporary, because the trait studied here, HR size, is expected to respond rapidly to interference competition [23].
Material and Methods
Ethics statement
Permits to work and handle animals in the field were obtained from the Free State and North West Province reserve ethics authorities (n°01/15700, 01/11262). Animals handling was per-formed under permissions from the French agriculture ministry to GG (C34–265), and Wits university ethics committee for CMSD (AESC n°: 2012/13/2A).
Study species
Rhabdomys sp. individuals forage alone during the day and rest at night in a nest either alone or in groups [24]. AllRhabdomysspecies are morphologically very similar, requiring genotyp-ing for their identification. In our study, species identity was assessed by genotypgenotyp-ing their Cytochrome Oxydase I mitochondrial gene (described in [22]).
Study area
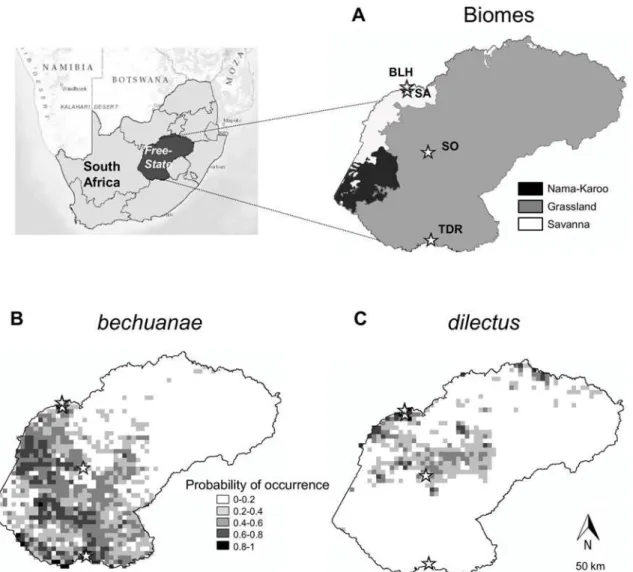
Mice were studied in four nature reserves located within the savanna and grassland biomes (sensu [25]) of central South Africa: three reserves in the Free State Province and one at its boundary with the North West Province (Fig. 1). The reserves occur along a north-south axis, from Bloemhof Dam (BLH; S27° 38’E25° 40’) and Sandveld (SA; S27° 43’E25° 45’), to Soetdor-ing (SO; S28° 50’E26° 03’) and Tussen die Riviere (TDR; S30° 28’E26° 09’). In these reserves,
dilectusandbechuanaeoccur in different geographic settings, either as monospecific popula-tions (hereafter: allpatric sites) or as regular but temporary mixed species populapopula-tions (hereaf-ter: sympatric sites,S1 Fig.). In sympatric sites mice of the two species could be trapped in the same traps (although not together).
We sampled a total of 22 sites across the four reserves, among which 11 were sampled at 2 to 3 occasions (Table 1). The HRs of the mice studied never overlapped between sites during the study period (which lasted roughly two weeks per site).
Although we did not monitor predation and competition with other species, we observed the presence of snakes, birds of prey and carnivore small mammals in all sites. Other rodent species were present in the trapping sites: the most frequent ones wereGerbiliscus sp. and Nan-nomys minutoides.
Trapping procedure
also collected a piece of tail (1cm) for species identification. Overall, we trapped and geno-typed 599 mice. Following [26], we estimated relative density within each site by computing the total number of striped mice captured during the first five trapping days divided by the total length of trap lines accounting for a 60 m buffer around the trap lines (roughly the average diameter of a mouse HR,Table 1).
Habitat characterization
Earlier studies addressing beta scale niche analysis [21,22] suggested that the two species could have different requirements in terms of vegetation cover and structure (i.e. grass versus woody vegetation). Here we aimed to test this hypothesis at an alpha scale, and characterized the vegeta-tion structure of mouse habitats by measuring the percentage of trees, bushes, grass and bare soil over 60x60m quadrats, centred on a trap line (the first and last traps were at the centre of, respec-tively, the first and last quadrats on a given trap line). Furthermore, vegetation cover was deter-mined within 1x1m metal square thrown to the right and left of a trap line at every second trap. Within these 1x1m quadrats, we evaluated the percentage of grass versus woody plants (small
Fig 1. Study area and species occurrence probability.Details on biomes (A) and probabilities of occurrence ofdilectusandbechuanae(B, C) (modified from Ganemet al. 2012). Star symbols indicate position of Bloemhof (BLH), Sandveld (SA), Soetdoring (SO) and Tussen die Riviere (TDR) Nature reserves.
shrubs), the percentage of bare soil and an estimate of mouse visibility (an index ranging from 1, i.e. completely visible, to 5, i.e. completely hidden, a value determined by averaging the visibility of a dummy mouse that we placed in four different locations inside the metal square). Altogether we used 136 60x60m quadrats (5.9±6.31 per site) and 229 1x1m quadrats (10.4±15.37 per site).
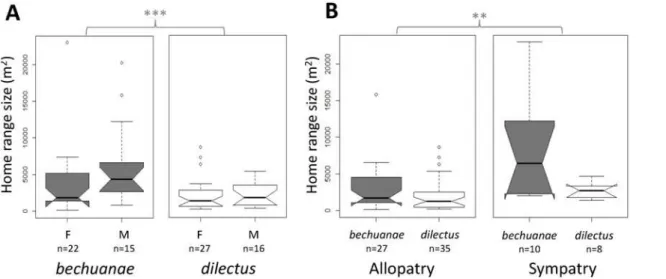
Table 1. Characteristics of studied sites across the four nature reserves.
Reserve Year Season Site Geography Radio-tracking
Total number of Area (m2)
Percentage of area characterized with the 60x60 quadrats
Density index Bechuanae dilectus
BLH 2012 spring BLH1 allopatry yes 0 8 30113 75 0.03
BLH 2012 spring BLH2 allopatry yes 0 17 50319 31 0.04
BLH 2012 spring BLH3 allopatry yes 0 13 85622 20 0.01
SA 2012 spring SA1 allopatry yes 18 0 193027 49 0.01
SA 2011 spring SA1 sympatry yes 96 43 193027 49 0.06
SA 2011 spring SA2 sympatry yes 7 10 45531 19 0.05
SA 2012 spring SA3 allopatry yes 4 0 44151 31 0.01
SO 2012 spring SO1 allopatry yes 14 0 28150 52 0.02
SO 2012 spring SO2 allopatry yes 4 0 17907 53 0.01
SO 2012 spring SO3 allopatry yes 0 51 88514 64 0.05
SO 2012 spring SO4 sympatry yes 1 10 107895 42 0.01
TDR 2012 spring TDR1 allopatry yes 68 0 119527 48 0.07
BLH 2013 autumn BLH3 allopatry no 0 3 85622 20
BLH 2012 spring BLH4 allopatry no 0 3 16763 52
SA 2012 autumn SA1 sympatry no 25 8 193027 49
SA 2012 autumn SA3 allopatry no 12 0 44151 31
SA 2013 autumn SA3 allopatry no 8 0 44151 31
SA 2013 autumn SA4 allopatry no 0 1 37110 48
SA 2012 autumn SA4 sympatry no 4 7 37110 48
SA 2012 spring SA4 sympatry no 1 2 37110 48
SA 2012 autumn SA5 allopatry no 17 0 19462 45
SA 2012 spring SA5 allopatry no 1 0 19462 45
SA 2013 autumn SA5 allopatry no 1 0 19462 45
SA 2012 autumn SA6 allopatry no 8 0 12751 71
SA 2012 autumn SA7 sympatry no 7 6 124315 29
SA 2012 spring SA7 sympatry no 5 1 124315 29
SA 2012 autumn SA8 allopatry no 4 0 7659 70
SA 2012 autumn SA9 allopatry no 18 0 43011 34
SA 2013 autumn SA9 allopatry no 5 0 43011 34
SO 2012 autumn SO1 allopatry no 4 0 28150 52
SO 2012 autumn SO3 allopatry no 0 52 88514 64
SO 2012 autumn SO4 allopatry no 0 11 107895 42
SO 2012 autumn SO5 allopatry no 7 0 18942 33
SO 2012 autumn SO6 allopatry no 0 1 6537 47
SO 2012 autumn SO7 sympatry no 1 1 9503 64
TDR 2013 autumn TDR1 allopatry no 4 0 119527 48
TDR 2012 spring TDR2 allopatry no 3 0 17701 57
BLH: Bloemof, SA: Sandveld, SO: Soetdoring and TDR: Tussen Die Riviere nature reserves.
Radiotracking
A total of 101 adult mice (body mass23 grams), were equipped with VHF collars (MD 2C Holohil, Carp, Ontario, Canada) in October-November 2011 and 2012 in 11 distinct sites on the four reserves. Radiotracking was performed on foot with a wide-range receiver (AOR 8000) and a hand-held Telonics R4–14K antenna. Localization of a collared mouse followed the stan-dard triangulation technique and its precise location was confirmed with the receiver cable used without the antenna. The receiver volume was set to 0 during the triangulation to reduce mice disturbance. The GPS coordinates of radio-collared individuals were recorded five times during the day (at about 7, 9, 11am and 2 and 4pm) and once at sunset (roughly 7pm).
Home range size and overlap estimations
HRs were defined as the areas encompassed within the 0.95 cumulative isopleth of the Utilization Distributions (UDs), estimated using the fixed kernel method with the reference smoothing pa-rameter [27]. Our sampling regime was chosen after a calibration session where we followed 30 individuals for more than seven days (from 40 to 69 relocations). The estimated HR size of our controls stabilized after 27 relocations and a paired comparison of the HR size at 27 and 41 regu-lar relocations did not show a significant difference (Wilcoxon test, V = 306, p = 0.14). Following [28], we chose a strategy maximizing the number of mice radiotracked with a sampling regime standardized to a minimum of 27 independent relocations, collected over five consecutive days.
We compared HR overlaps in a sympatric site between pairs of mice of the same species ver-sus different species. We computed the overlap between each pair of HRs using their UD-based volume of intersection [29]. Because UDs are truncated at the 0.95 cumulative isopleth (excluding the poorly estimated UD tails), overlap values were normalized to 1 by dividing them by 0.95 (see [30] for details).
Statistical analyses
Statistical analysis was conducted with R-v2.15 [31]. Normality and heteroscedasticity of distri-butions were checked with a Shapiro test and visualized with the plot of the model’s residuals. When these conditions were not met even after data transformation, non-parametric tests were used. Significance level was set to 0.05, and adjusted for multiple comparisons with the se-quential Bonferroni procedure when necessary. UD, overlap computations, and permutation tests (see below) were performed using home-made programs in Pascal.
Mice-habitat relationship assessed with trapping data
A total of 599 trapped mice were used in these analyses. A mouse was considered as potentially using a 60x60m quadrat when it was trapped within it, and a 1x1m quadrat when it was trapped less than 10m from it. Each quadrat was then assigned to one or the other species, to both species, or to none. A total of 89 60x60m quadrats and 227 1x1m quadrats were assigned to one or the two species.
assessed marginality (i.e. deviation from a random sample of available conditions) of niche po-sition and breadth of a given category on an OMI axis through comparisons with distributions obtained performing 1000 random permutations followed by bootstrap two-tailed tests.
The niche positions of the four population categories (two species in allopatry versus in sympatry) on the first OMI axis (OMI1) were compared with linear mixed ANOVAs (package nlme), with the category as a fixed effect and site as a random effect, followed by Tukey post-hoc tests when relevant (package mulcomp, glht function). The same procedure was applied on a subsample of the data comprised of only sympatric sites, to test whether excluding allopatric habitats from the analyses would detect species divergence in sympatry.
Mice-habitat relationships assessed with home range data
Habitat at the HR scale was characterized with the 60x60m quadrats that covered an area cor-responding to at least 70% of the HR. Such a coverage was reached for 80 of the estimated HRs (S1 Table). The four vegetation structure variables measured within a quadrat were weighted by the relative proportions of the HR UD covered. These data were then analyzed following the same procedure as described above.
Determinants of home range size variation
For the purpose of this analysis, we reduced the four variables describing vegetation structure into one corresponding to the first axis of a Principal Component Analysis (PCA). This axis represented 76% of total variance. We tested the influence of body size, sex, population density, habitat (i.e. PCA1), geography (i.e. allopatry vs sympatry) and species on log-transformed HR size. Our data showed spatial autocorrelation (Moran test, p<0.001, library“spdep”), hence we applied the spatial simultaneous autoregressive error model estimation (sarlm model) in subse-quent ANCOVA analyses. Our initial ANCOVA model comprised all factors as main effects and second and third order interactions with“species”, except for density which was included as a co-variable in the model. Preliminary analyses showed that density did not vary between species (KW, DF = 2,χ2= 1.72, p = 0.42) or with the habitat parameter of the model
(Spear-man,ρ= 0.06, p = 0.58), and that body size did not differ between our sample of males and
fe-males (Anova, DF = 1,97, F = 0.61 p = 0.44). The most parsimonious model was obtained after sequential elimination of factors with non-significant effects (following [33]), and post-hoc checking that its AICc was significantly smaller to that of the initial model.
HR overlaps in a sympatric site
Because we did not know the species identity of mice during our field study, our selection of radiotracked mice could not be balanced. The between-species HR overlap analysis could even-tually be performed for only one sympatric site (SA1), in which 6dilectus(3 females and 3 males) and 14bechuanae(9 females and 5 males) were radiotracked. Other sympatric sites contained too few radiotracked individuals of one species or the other to enable us to perform statistical tests. We computed three observed values: the mean overlap between any twodilectus
theoretical distributions expected under the null hypothesis, to which we compared the three observed values mentioned above. As in any permutation test, the probability to reject the null hypothesis, i.e. obtaining a value equal to or more extreme than the observed value in each of the three tests, was computed asP = 2(ne+1)/n(bilateral test), whereneis the number of these
most extreme values andnis the total number of values (n= 12320).
Results
Variation of habitat preference within and between species
We compared the habitat characteristics of allopatric and sympatric mice of the two species at the population (site) and individual (HR) levels with three distinct OMI analyses. The first axes (i.e OMI1) always captured a significant proportion of the habitat variation (>94%,Fig. 2), and results were consistent across analyses. These three axes had positive values for presence of grass and mouse visibility, and negative values for the presence of woody type vegetation and bare soil (Fig. 2). The habitat niche positions of the two species in allopatric sites were significantly differ-ent from a random sample of available habitats (p<0.05), and from each other (respectively, at the site level, vegetation structure and cover, and at the HR level vegetation structure: z = -4.41, z = -7.69 and z = 5.28, p<0.001). The niche position of allopatricbechuanaeshowed significant negative values (i.e. habitat characterized by more woody vegetation and presence of bare soil than that in a random sample of available habitats), while those ofdilectuswere significantly positive (i.e. habitats characterized by the presence of more grass and cover than in a random sample). Unlike allopatric sites, the niche position of individuals of the two species in sympatry did not differ from random expectations (p>0.05). However, their positions differed from that of their allopatric counterparts. Indeed, in sympatry,bechuanaeoccurred in a habitat with higher mouse visibility and cover values (vegetation cover, z = 3.39, p = 0.003), but with similar values of vegetation structure (at the site and HR levels,Fig. 2) compared to its habitat in allopa-try. In contrast, habitat characteristics ofdilectusin allopatry and sympatry differed in the three analyses, as its habitat in sympatry was characterized by lower values of mouse visibility, cover and presence of grass than in allopatry (respectively, at the site level the vegetation structure and cover, at the HR level the vegetation structure: z = -3.88 z = -3.84 z = -4.29 p<0.001,Fig. 2).
Considering only sympatric sites, the first OMI axes captured most of the data variation (>88%), and described a habitat gradient ranging from high values of bare soil and presence of trees (negative values of OMI1) to high values of grass, mouse visibility and presence of bushes (positive values of OMI1,Fig. 3). Despite the reduced power due to a smaller sample size (par-ticularly for the HR level analysis), the results indicate thatbechuanaeoccurs in micro-habitats characterized by more bare soil, woody vegetation and less mouse visibility than that ofdilectus, although these differences (respectively at the site level, the vegetation structure and cover: p = 0.03 p = 0.05) were not strong (significance level adjusted for multiple testingα’= 0.025;Fig. 3).
Variation of HR size within and between species
Patterns of overlap in a sympatric site
Overlaps of HRs between the two species were significantly lower than random expectations (observed value: 0.011±0.048; permutation test p<0.01), while they were higher than expected withinbechuanae(observed value: 0.057±1.265; p<0.01), and not different from random with-indilectus(observed value: 0.023±0.052; p>0.5,S2 Fig.).
Discussion
Our study is among very few that attempted to disentangle the complex interaction between environment and competition in shaping character variation [23]. We focused on the spatial niche (i.e. habitat selection and HR size) of two sister species of striped mice whose distribu-tions are mostly allopatric and characterized by distinct environmental condidistribu-tions [11,12]. We assessed the influence of environmental variation and competition on habitat selection and HR size variation in an area where the distributions of the two species abut and where allopatric and sympatric populations can be compared under similar climatic conditions [22].
Earlier large scale investigations indicated that the environmental niche of the two studied species diverged: the habitats ofbechuanaeare dominated by warmer climates and drier open shrubland vegetation, while those ofdilectusare characterized by wetter climates and grassland
Fig 2. Habitat niche divergence in sympatry and allopatry.Habitat divergence between allopatric (allo) and sympatric (symp) populations of the two species as assessed with Outlying Mean Index (OMI) analyses. The upper row (A) shows the relative contribution of the different habitat variables: vegetation structure (tree, grass, bush and bare soil (BS)) and cover (bare soil (BS), grass and mouse visibility (MV)) to the first two OMI axes. The lower row (B) indicates the position (dot) and breadth (line) of each species niche along the first OMI axis (*when significantly different from random expectation). The p-values of Tukey tests are given for every pair comparison (black: inter-specific, grey: intra-specific).
Fig 3. Details on habitat niche divergence in sympatry.Habitat divergence of the two species in sympatric sites assessed with Outlying Mean Index (OMI) analyses. See legend inFig. 2. The p-values follow Wilcoxon tests.
doi:10.1371/journal.pone.0117750.g003
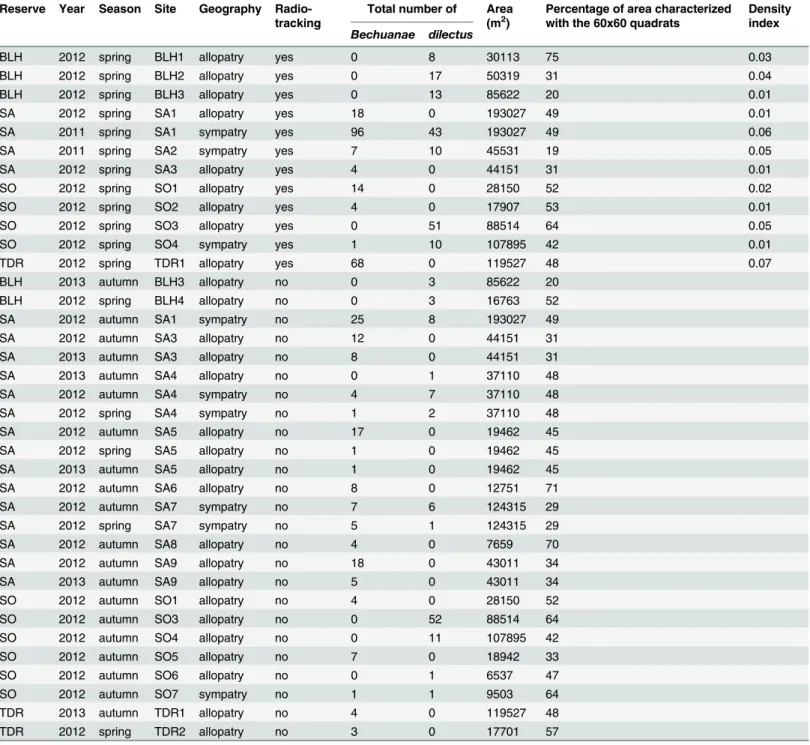
Fig 4. Home range size estimates.Home range size estimates (isopleth 0.95) across species (grey:bechuanae, white:dilectus), A: sex (F females and M males) and B:“geography”(**p<0.01,***p<0.001 refers to Ancova results inS2 Table). Box-plots show the median (thick line), first and third quartiles.
Non-overlapping notches are roughly equivalent to 95% confidence intervals.
type vegetation, providing more cover [11,21,22]. Such beta scale studies are particularly rele-vant to address species niche characteristics over their entire range; however, they could suffer from confounding effects due to spatial autocorrelation of large scale environmental variables and are not expected to reveal micro-environmental heterogeneity [34], but see [35]. Neverthe-less, using an alpha approach, the present study confirms habitat niche divergence at a fine scale and highlights a role for both environmental variation and competition in shaping the spatial niche ofbechuanaeanddilectusin sympatry.
Niche divergence
Habitat
Sister species are expected to have similar niches if they retain ancestral characteristics (niche con-servatism, [36]), or when they evolve under similar conditions [37]. In all cases, contact or second-ary sympatry between species sharing similar niches are expected to trigger character
displacement [8,35]. Earlier studies of the striped mouse environmental niche indicated that evo-lution in allopatry took place under different environmental conditions [11,21], and that divergent adaptation may facilitate coexistence. The present study confirms divergence in habitat selection by the two species at the margins of their distributions but also indicates that the available habitat in sympatry is more similar to that ofbechuanaein allopatry (i.e. less cover and more woody vege-tation) than that ofdilectus. Nevertheless, the latter still selects micro-habitats with more cover and less woody vegetation thanbechuanae, confirming micro-habitat partitioning in sympatry as suggested by preliminary observations [22]. Such differences in habitat preference, consistent over the entire species range including its margins and sympatric zones, together with the largely allo-patric distribution of the species, support evolution under different selective pressures in allopatry (i.e. adaptation), and a more recent secondary contact where these preferences are still expressed. Partition of the habitat niche could thus result in lower interspecific competition pressures facili-tating co-existence [38,39]. Nevertheless our study indicates that habitat divergence in sympatry is tenuous compared to that in allopatry. Further, the habitat available in sympatry differed signifi-cantly from that in allopatry fordilectus, suggesting that the latter invaded the range ofbechuanae
and that coexistence occurs in areas to whichdilectusmight be less adapted.
Home Range
Lesser habitat partition in sympatry is expected to induce competition which we assessed com-paring HR size variation, a trait known to be influenced by habitat features [16] and interspe-cific interference [40]. We found differences in HR size between the species:dilectushaving smaller HRs thanbechuanae. These differences exist despite sexual dimorphism in HR size (i.e larger in males than females), in both species, that could relate to behavioural [41,42] and phys-iological [16,43] sex differences.
structure on HR size variation. Possible explanations might be that, either this variable only has an indirect effect on HR size (see above), or to lower resolution due to small sample size.
Character displacement
Differences in habitat preferences may facilitate coexistence betweenbechuanaeanddilectus. However, as indicated above, sympatry occurs in habitats that are less favorable fordilectus
and our study suggests that species segregation in sympatry may not be complete. Patterns of HR size variation in allopatry versus sympatry also suggest that competition may occur. In-deed, both species had a significant increase in their HR size in sympatry as compared to allop-atry. Although we cannot exclude that such variation could be consistent with habitat variation as far asdilectusis concerned, this argument may not hold forbechuanaewhose preferred habi-tat in allopatry and sympatry is similar.
A larger HR size in sympatry may reveal inter-species intolerance and competition [17,23,40]. In our study, larger HRs in sympatry compared to allopatry, at least inbechuanae, could be a re-sponse to competition and a strategy aimed at limiting costly interactions with the other species through character displacement [40]. Alternatively, it could be a strategy to occupy most of the available resources (e.g. nest sites). Patterns of HR overlap in our study suggest that our first hy-pothesis may be true, asbechuanaeshowed more HR overlaps than expected with members of the same species, while between species overlaps were lower than expected under random predictions. Micro-habitat selection and space partition are expected to be adaptive responses to reduce competition [17,18,50]. Here, despite different habitat preferences, habitat segregation is tenu-ous in sympatry, resulting inbechuanaeenlarging its HR possibly to avoiddilectus, making de-tours, or to control a larger number of shelters to outcompetedilectus.
Conclusion
It was argued that ecological complexity was not considered often enough in assessments of mechanisms of coexistence [9], and that evidence for character displacement resulting from species interference is rare [4]. Our study provides valuable field data in an interesting study model allowing to compare the spatial niche characteristics of two species in a relatively homo-geneous sympatric and allopatric environment (a common garden setting). Furthermore, the alpha scale investigation, together with an earlier beta scale one [11,21,22], provides a compre-hensive picture of how environmental heterogeneity and interference competition could shape the spatial niche of two sister species and influence patterns of coexistence. Future studies should include mechanistic experimental approach to address competition between the two species and determine the proximal mechanisms (e.g. the impact of competition on the species fitness) shaping the species range limits and patterns of co-existence.
Supporting Information
S1 Fig. Experimental design.A: An example of distribution of allopatric and sympatric sites (SO1-SO6) within Soetdoring Nature Reserve. B: Distribution of the quadrats used for habitat assessment (vegetation structure and cover) around the trap lines.
(TIF)
S2 Fig. Three theoretical distributions of the mean volumes of interaction within HR over-laps.From left to right: distributions of intra-species overlap values withindilectus(A) and
bechuanae(B) and between the species (C). The red lines indicate position of observed mean values.
S1 Table. HR estimates sample size.Number of HR estimates per species and sex in allopatric and sympatric sites, and size of the subsample for which the habitat was characterized.
(XLSX)
S2 Table. Factors influencing HR size variation.Results of the initial and minimal ANCOVA models. The models (sarlm residual, see text), testing factors that may influence HR size varia-tion: habitat (PCA 1), sex, geography (allopatry vs sympatry), body size and population densi-ty. Bold p-values indicate significant effects.
(XLSX)
Acknowledgments
We are grateful for discussion with or help from: P. Caminade, M. Perriat-Sanguinet, the Suc-culent Karoo Research Station team, Y. Latour, O. Gimenez, L.-M. Chevin, S. Chamaille, J. Brit-ton-Davidian, the reserve personnel, and FreePascal compiler (www.freepascal.org). This study was performed with permits from the Free State and North West Province reserve authorities (n°01/15700, 01/11262). ISEM 2014/216.
Author Contributions
Conceived and designed the experiments: CMSD GG. Performed the experiments: CMSD GG JW CR JP JJP NA. Analyzed the data: CMSD GG CM SB. Contributed reagents/materials/anal-ysis tools: CMSD GG NP JW NA. Wrote the paper: CMSD GG CM NP. Conceived and wrote the general project and raised funding: NP GG.
References
1. Dayan T, Simberloff D (2005) Ecological and community-wide character displacement: the next gener-ation. Ecology Letters 8: 875–894. Available:http://doi.wiley.com/10.1111/j.1461-0248.2005.00791.x. Accessed 2013 August 6.
2. Brown W, Wilson E (1956) Character displacement. Systematic Zoology 5: 49–64.
3. Grant PR (1972) Convergent and divergent character displacement. Biological Journal of the Linnean Society 4: 39–68.
4. Stuart YE, Losos JB (2013) Ecological character displacement: glass half full or half empty? Trends in Ecology & Evolution 28: 402–408. Available:http://www.ncbi.nlm.nih.gov/pubmed/23537690. Ac-cessed 7 August 2013. doi:10.1111/1365-2656.12336PMID:25637388
5. Pfennig DW, Pfennig KS (2012) Evolution’s wedge competition and the origins of diversity Berley, Cali-fornia. doi:10.1016/S2214-109X(15)70024-0PMID:25638812
6. Grant PR, Grant BR (2006) Evolution of character displacement in Darwin’s finches. Science 313: 224–226. Available:http://www.ncbi.nlm.nih.gov/pubmed/16840700. Accessed 2012 November 6. PMID:16840700
7. Chesson P (2000) Mechanisms of maintenance of species diversity. Annual review of Ecology and Systematics 31: 343–358. Available:http://www.jstor.org/stable/10.2307/221736. Accessed 2013 Au-gust 23.
8. Violle C, Nemergut DR, Pu Z, Jiang L (2011) Phylogenetic limiting similarity and competitive exclusion. Ecology Letters 14: 782–787. Available:http://www.ncbi.nlm.nih.gov/pubmed/21672121. Accessed 2013 December 14. doi:10.1111/j.1461-0248.2011.01644.xPMID:21672121
9. Goldberg EE, Lande R (2006) Ecological and reproductive character displacement on an environmen-tal gradient. Evolution 60: 1344–1357. Available:http://www.ncbi.nlm.nih.gov/pubmed/16929652. PMID:16929652
10. Case TJ, Taper ML (2000) Interspecific competition, environmental gradients, gene flow, and the co-evolution of species’borders. The American Naturalist 155: 583–605. PMID:10777432
nlm.nih.gov/pubmed/22728170. Accessed 2012 November 7. doi:10.1016/j.ympev.2012.05.036 PMID:22728170
12. Rambau RV, Robinson TJ, Stanyon R (2003) Molecular genetics of Rhabdomys pumilio subspecies boundaries: mtDNA phylogeography and karyotypic analysis by fluorescence in situ hybridization. Mo-lecular Phylogenetics and Evolution 28: 564–575. Available:http://linkinghub.elsevier.com/retrieve/pii/ S1055790303000587. Accessed 2012 November 16. PMID:12927139
13. Lopez-Darias M, Schoener TW, Spiller DA, Losos JB (2012) Predators determine how weather affects the spatial niche of lizard prey: exploring niche dynamics at a fine scale. Ecology 93: 2512–2518. Avail-able:http://www.ncbi.nlm.nih.gov/pubmed/23431582. PMID:23431582
14. Powell RA, Mitchell MS (2012) What is a home range? Journal of Mammalogy 93: 948–958. Available: http://www.bioone.org/doi/abs/10.1644/11-MAMM-S-177.1. Accessed 2012 November 4.
15. Schoener T (1974) Resource partitioning in ecological communities. Science 185: 27–39. PMID: 17779277
16. Godsall B, Coulson T, Malo AF (2013) From physiology to space use: energy reserves and androgen-ization explain home-range size variation in a woodland rodent. Journal of Animal Ecology 83: 126–135. Available:http://www.ncbi.nlm.nih.gov/pubmed/23931095. Accessed 2013 December 16. doi:10.1111/1365-2656.12116PMID:23931095
17. Arakaki S, Tokeshi M (2011) Analysis of spatial niche structure in coexisting tidepool fishes: null models based on multi-scale experiments. Journal of Animal Ecology 80: 137–147. doi:doi:10.1111/j.1365– 2656.2010.01749.xPMID:20796205
18. MacArthur R, Recher H, Cody M (1966) On the relation between habitat selection and species diversity. The American naturalist 100: 319–332.
19. Ackerly D, Schwilk D., Webb C. (2006) Niche evolution and adaptive radiation: testing the order of trait divergence. Ecology 87: 50–61. Available:http://www.ncbi.nlm.nih.gov/pubmed/16922302.
20. Van Valen L (1965) Morphological variation and width of ecological niche. The American Naturalist 99: 377–390.
21. Meynard CN, Pillay N, Perrigault M, Caminade P, Ganem G (2012) Evidence of environmental niche differentiation in the striped mouse (Rhabdomys sp.): inference from its current distribution in southern Africa. Ecology and Evolution 2: 1008–1023. Available:http://www.pubmedcentral.nih.gov/
articlerender.fcgi?artid=3399166&tool = pmcentrez&rendertype = abstract. Accessed 2012 November 26. doi:10.1002/ece3.219PMID:22837845
22. Ganem G, Meynard CN, Perrigault M, Lancaster J, Edwards S, et al. (2012) Environmental correlates and co-occurrence of three mitochondrial lineages of striped mice (Rhabdomys) in the Free State Prov-ince (South Africa). Acta Oecologica 42: 30–40. Available:http://linkinghub.elsevier.com/retrieve/pii/ S1146609X12000045. Accessed 2012 December 19.
23. Mikami OK, Kawata M (2002) The effects of individual interactions and habitat preferences on spatial structure in a grassland bird community. Ecography 25: 200–214. Available: http://www.blackwell-synergy.com/links/doi/10.1034/j.1600-0587.2002.250208.x.
24. Schradin C (2004) Territorial defense in a group-living solitary forager: who, where, against whom? Be-havioral Ecology and Sociobiology 55: 439–446. Available:http://www.springerlink.com/openurl.asp? genre = article&id = doi:10.1007/s00265-003-0733-x. Accessed 2012 November 2.
25. Mucina L, Rutherford M (2006) The Vegetation of South Africa, Lesotho and Swaziland. South African National Biodiversity Institute, Pretoria, South Africa.
26. Stapp P, Van Horne B (1997) Response of Deer Mice (Peromyscus maniculatus) to shrubs in short-grass prairie: linking small-scale movements and the spatial distribution of individuals. Functional Ecol-ogy 11: 644–651.
27. Worton BJ (1989) Kernel methods for estimating the utilization distribution in home-range studies. Ecol-ogy 70: 164–168.
28. Börger L, Franconi N, De Michele G, Gantz A, Meschi F, et al. (2006) Effects of sampling regime on the mean and variance of home range size estimates. Journal of Animal Ecology 75: 1393–1405. Avail-able:http://www.ncbi.nlm.nih.gov/pubmed/17032372. Accessed 2013 August 8. PMID:17032372 29. Seidel K (1992) Statistical properties and applications of a new measure of joint space use for wildlife.
University of Washington, Seattle, USA.
30. Benhamou S, Valeix M, Chamaillé-Jammes S, Macdonald DW, Loveridge AJ (2014) Movement-based analysis of interactions in African lions. Animal Behaviour 90: 171–180. Available:http://linkinghub. elsevier.com/retrieve/pii/S0003347214000645. Accessed 2014 March 21.
32. Doledec S, Chessel D, Gimaret-Carpentier C (2000) Niche separation in community analysis: a new method. Ecology 81: 2914–2927.
33. Zar J (1999) Biostatistical Analysis. 4th ed. Ryu T, Snavely S, editors Prentice-Hall. Upper Saddle River, USA.
34. Soberón J (2007) Grinnellian and Eltonian niches and geographic distributions of species. Ecology Let-ters 10: 1115–1123. Available:http://www.ncbi.nlm.nih.gov/pubmed/17850335. Accessed 2014 May 23. PMID:17850335
35. McCormack JE, Zellmer AJ, Knowles LL (2010) Does niche divergence accompany allopatric diver-gence in Aphelocoma jays as predicted under ecological speciation? Insights from tests with niche models. Evolution 64: 1231–1244. Available:http://www.ncbi.nlm.nih.gov/pubmed/19922442. Ac-cessed 2014 May 23. doi:10.1111/j.1558-5646.2009.00900.xPMID:19922442
36. Peterson AT, Soberon J, Sanchez-Cordero V (1999) Conservatism of ecological niches in evolutionary time. Science 285: 1265–1267. Available:http://www.sciencemag.org/cgi/doi/10.1126/science.285. 5431.1265. Accessed 2014 May 26. PMID:10455053
37. Losos JB (2011) Convergence, adaptation, and constraint. Evolution 65: 1827–1840. Available:http:// www.ncbi.nlm.nih.gov/pubmed/21729041. Accessed 2014 June 3. doi:10.1111/j.1558-5646.2011. 01289.xPMID:21729041
38. Schluter D, Mcphail JD (1992) Ecological character displacement and speciation in sticklebacks. The American naturalist 140: 85–108. doi:10.1086/285404PMID:19426066
39. Lira A, Souza A, Silva Filho A, Albuquerque C (2013) Spatio-temporal microhabitat use by two co-oc-curring species of scorpions in Atlantic rainforest in Brazil. Zoology 116: 182–185. Available:http:// www.ncbi.nlm.nih.gov/pubmed/23664851. Accessed 2013 November 1. doi:10.1016/j.zool.2013.01. 002PMID:23664851
40. Trombulak SC (1985) The influence of interspecific competition on home range size in chipmunks (Eutamias). Journal of Mammalogy 66: 329–337.
41. Clutton-Brock TH (1989) Mammalian mating systems. Proceedings of the Royal Society of London 236: 339–372. Available:http://www.ncbi.nlm.nih.gov/pubmed/2567517. PMID:2567517 42. Schradin C (2006) Whole-day follows of striped mice (Rhabdomys pumilio), a diurnal murid rodent.
Journal of Ethology 24: 37–43. Available: http://www.springerlink.com/index/10.1007/s10164-005-0158-2. Accessed 2012 December 19.
43. Schradin C, Scantlebury M, Pillay N, König B (2009) Testosterone levels in dominant sociable males are lower than in solitary roamers: physiological differences between three male reproductive tactics in a sociably flexible mammal. The American Naturalist 173: 376–388. Available:http://www.ncbi.nlm. nih.gov/pubmed/19199528. Accessed 2012 November 12. doi:10.1086/596535PMID:19199528 44. Tufto J, Andersen R, Linnell J (1996) Habitat use and ecological correlates of home range size in a
small cervid: the roe deer. Journal of Animal Ecology 65: 715–724.
45. Holmes W (1991) Predator risk affects foraging behaviour of pikas: observational and experimental evi-dence. Animal Behaviour 42: 111–119.
46. Schradin C, Pillay N (2005) Intraspecific variation in the spatial and social organization of the african striped mouse. Journal of Mammalogy 86: 99–107.
47. Schradin C, Schmohl G, Rödel HG, Schoepf I, Treffler SM, et al. (2010) Female home range size is reg-ulated by resource distribution and intraspecific competition: a long-term field study. Animal Behaviour 79: 195–203. Available:http://linkinghub.elsevier.com/retrieve/pii/S0003347209004965. Accessed 2012 November 4.
48. Stradiotto A, Cagnacci F, Delahay R, Tioli S, Nieder L, et al. (2009) Spatial organization of the yellow-necked mouse: effects of density and resource availability. Journal of Mammalogy 90: 704–714. 49. Jonsson P, Hartikainen T, Koskela ESA (2002) Determinants of reproductive success in voles: space
use in relation to food and litter size manipulation. Evolutionary Ecology 16: 455–467.