Characterising Upper Limb Movements in
Huntington's Disease and the Impact of
Restricted Visual Cues
Jessica Despard1‡, Anne-Marie Ternes1‡, Bleydy Dimech-Betancourt1, Govinda Poudel1,2,3, Andrew Churchyard4, Nellie Georgiou-Karistianis1*
1School of Psychological Sciences, Faculty of Medicine, Nursing and Health Sciences, Monash University, Clayton, Victoria, Australia,2Monash Biomedical Imaging, Monash University, Melbourne, Victoria, Australia,3Victorian Life Sciences Computation Initiative, Life Sciences Computation Centre, Melbourne, Victoria, Australia,4Department of Neurology, Monash Medical Centre, Clayton, Victoria, Australia
‡These authors are joint first authors on this work. *[email protected]
Abstract
Background
Voluntary motor deficits are a common feature in Huntington's disease (HD), characterised by movement slowing and performance inaccuracies. This deficit may be exacerbated when visual cues are restricted.
Objective
To characterize the upper limb motor profile in HD with various levels of difficulty, with and without visual targets.
Methods
Nine premanifest HD (pre-HD), nine early symptomatic HD (symp-HD) and nine matched controls completed a motor task incorporating Fitts' law, a model of human movement enabling the quantification of movement timing, via the manipulation of task difficulty (i.e., target size, and distance between targets). The task required participants to make recipro-cal movements under cued and blind conditions. Dwell times (time stationary between movements), speed, accuracy and variability of movements were compared between groups.
Results
Symp-HD showed significantly prolonged and less consistent movement times, compared with controls and pre-HD. Furthermore, movement planning and online control were signifi-cantly impaired in symp-HD, compared with controls and pre-HD, evidenced by prolonged dwell times and deceleration times. Speed and accuracy were comparable across groups, suggesting that group differences observed in movement time, variability, dwell time and deceleration time were evident over and above simple performance measures. The
OPEN ACCESS
Citation:Despard J, Ternes A-M, Dimech-Betancourt B, Poudel G, Churchyard A, Georgiou-Karistianis N (2015) Characterising Upper Limb Movements in Huntington's Disease and the Impact of Restricted Visual Cues. PLoS ONE 10(8): e0133709. doi:10.1371/journal.pone.0133709
Editor:Alfonso Fasano, University of Toronto, CANADA
Received:October 26, 2014
Accepted:July 1, 2015
Published:August 6, 2015
Copyright:© 2015 Despard et al. This is an open access article distributed under the terms of the Creative Commons Attribution License, which permits unrestricted use, distribution, and reproduction in any medium, provided the original author and source are credited.
Data Availability Statement:All relevant data are within the paper and its Supporting Information files.
Funding:This research was supported by funds from the School of Psychological Sciences, Monash University.
presence of cues resulted in greater movement time variability in symp-HD, compared with pre-HD and controls, suggesting that the deficit in movement consistency manifested only in response to targeted movements.
Conclusions
Collectively, these findings provide evidence of a deficiency in both motor planning, particu-larly in relation to movement timing and online control, which became exacerbated as a function of task difficulty during symp-HD stages. These variables may provide a more sen-sitive measure of motor dysfunction than speed and/or accuracy alone in symp-HD.
Introduction
Huntington’s disease (HD) is an autosomal-dominant neurodegenerative disorder caused by the pathological expansion of a CAG trinucleotide repeat, disrupting cognitive, affective and motor functions [1–3]. A major focus of current research is to identify specific deficits early in the disease, in order to develop targeted treatment protocols that may delay disease progression [4]. The premanifest stage of HD (pre-HD) [5] provides an unprecedented opportunity to characterize deficits and ultimately encapsulate sensitive markers of disease progression from premanifest to symptomatic stages for potential use in clinical interventions [4,6,7]. While the focus of recent research has predominantly entailed the use of advanced neuroimaging technol-ogies to track neuronal activity [7–9], their functional relevance has been less well understood [4]. Importantly, it is the behavioural impact at a functional level that renders an individual incapable of living independently Although many studies have characterised motor deficits in HD [10–29], most notably focus on rudimentary measures, such as speed and accuracy, and often comprise of simple finger tapping tasks [11,30]. As such, there is paucity in the literature as to how this translates into more complex motor behaviours.
The basal ganglia are the main site of neurodegeneration in HD and have previously been implicated in motor preparation and planning, thereby regulating the phasic timing of move-ments [16,31–36]. This considered, underlying dysfunction in the organisation of movement may persist, over and above the observed deficit of speed and accuracy. For this reason, we aimed to characterize the kinematic profile of more complex movement at different stages of disease, to gain a more comprehensive understanding of how motor dysfunction may translate into functional incapacity.
the sensorimotor cortex, cerebellum and superior parietal regions during the latter corrective phase, referred to as the online control network [42,43]. Taking these regions into account, HD neuropathology may portray a signature motor profile in terms of movement planning and error processing that could provide insight into the failings of their respective underlying neu-ronal networks.
Despite extensive research characterising the motor disturbance in symp-HD, few studies have addressed motor function during the premanifest stage [11,25,44,45]. Considering a clin-ical diagnosis relies on the unequivocal presence of involuntary movement [46], pre-HD would not be expected to exhibit overt motor dysfunction. Interestingly, however, neuroimag-ing findneuroimag-ings clearly depict striatal neuronal loss 15 to 20 years prior to symptom onset [8,47,48]. When voluntary movement is complex and challenged there may be some level of functional impairment in pre-HD, which could be assessed by sensitive tools and kinematic measures. Recent support of this notion has come from studies demonstrating significant increased movement variability in pre-HD [11,18,49,50]. The timing component of basal gan-glia function not only determines motor planning, but also influences generalised aspects of movement timing [51–53]. In the instance of pre-HD, early striatal degeneration may result in a disruption to the timing of an action, leading to the inability to maintain consistently timed motions [11,18,49,50]. This has been evidenced in both simple finger tapping [11,18], cued sequential tapping [17], and in the more automated action of walking [49,50]. No study has previously investigated different kinematic components of movement during goal directed aiming. Findings from such a study could provide important new insight about how motor processes breakdown (i.e., movement planning) during the pre-HD stages.
Accordingly, this study sought to quantify the kinematic profile of movement planning and online control in HD using a computerised reciprocal aiming task implementing Fitts’law, both with and without the restriction of visual cues. Fitts’law is a formulated model that pre-dicts movement time (MT) when performing a goal-directed action [54,55], by integrating tar-get traits of size and distance. The robust model implements the mathematical formula MT =a
+b[log2(2A/W)], whereAreflects movement amplitude (determined by distance between
tar-gets), andWrepresents target width, withaandbas constants [54,55]. Movement Time is dependent on the difficulty of the task being performed, requiring the planning system to strate-gically accommodate the limitations of the motor system, and to consequently adjust temporal parameters of the movement. For example, greater task difficulty entails greater corrective sub-movements, thus resulting in increased movement times [56,57]. Application of this model yields a specified index of difficulty (ID), as a function of movement amplitude (distance between targets) and target size (small or large), determined by the equation log2(2A/W). This
allows quantification of the speed-accuracy trade-off as a function of task difficulty [54,55], with smaller targets at a greater distance placing the greatest demand on the perceptual-motor system. Whilst Fitts’law has been utilized in other clinical populations [58–62], never before has it been investigated in HD. No previous study, to our knowledge, has investigated the break-down of movement kinematics in HD to assess the individual contribution of motor planning, separate from error feedback. Moreover, considering the reliance on external cueing due to basal ganglia pathology [13,16,25], there is limited research into how the restriction of visual cues may impact motor performance. Implementing such a task will provide a more compre-hensive profile of the underlying motor dysfunction observed in HD across multiple domains.
controls. In light of HD neuropathology, it is hypothesized that all groups will adhere to Fitts’
law, showing a linear relationship with prolonged movement times as a function of increasing task difficulty, with this effect increasing with greater disease severity. Furthermore, given the role of the basal ganglia in motor planning and coordination of timing [16,31–34], it is expected that symp-HD will show greater impairment in measures of motor planning and of movement variability, compared with controls, under conditions of increasing task difficulty. Given the more profound global deficit in symp-HD, it is also hypothesized that this group will show greater impairment in online control than both controls and pre-HD, and as a function of increasing task difficulty. Moreover, it is hypothesized that the pre-HD group will show some impairment in measures of motor planning and coordination of timing, compared with controls, however the extent of this is unclear. Furthermore, the absence of visual cues is expected to have a more detrimental effect on both HD groups, with symp-HD and pre-HD performing poorer than controls when visual cues are restricted.
Method
Participants
Twenty-seven right handed participants (Edinburgh Handedness Test; [63]) aged 40–70 years were recruited for this study. Participants included 9 pre-HD (2 males) and 9 symp-HD (5 males), recruited through the Georgiou-Karistianis Experimental Neuropsychology Research Unit-Stout database, Monash University (Ethics Number 2003/847). Controls (2 males) were matched for age, gender and premorbid IQ (National Adult Reading Test 2ndedition, NART-2; [64]) to the pre-HD group. One-way ANOVAs revealed no significant group differences in estimated IQ (p<.05), although one participant failed to perform this task. Naturally, the
symp-HD group were significantly older than both the pre-HD and control groups (p= .003). All participants underwent a screening process prior to recruitment, with exclusion criteria including history of neurological or psychiatric disturbance, aside from HD, clinical diagnosis of depression (Beck Depression Inventory—II, BDI-II; [65]), or previous traumatic brain injury. A one-way ANOVA revealed no significant group differences in BDI-II (p<.05).
Pre-HD and symp-Pre-HD participants underwent gene testing prior to enrolment to the study, and CAG repeat length ranged from 39 to 47. All pre-HD and symp-HD were assessed by a collab-orating neurologist (Dr Andrew Churchyard) via the use of the Unified Huntington’s Disease Rating Scale total motor score (UHDRS-TMS; [66]). Inclusion in the pre-HD group was based on UHDRS-TMS5 and the symp-HD group based on UHDRS-TMS>5, as per previous
studies [67]. Disease burden score (DBS) [68] was calculated across both groups and estimated years to onset (YTO) of symptoms was calculated for the pre-HD group only [69]. Demo-graphic and clinical data for all groups are provided inTable 1. Symp-HD participants remained on their normal medication regime and reported taking selective serotonin reuptake inhibitor (SSRI) antidepressants (n = 3), neuroleptic medications (n = 3) and Benzodiazepines (n = 1). Neither control or pre-HD groups reported taking any prescribed medications.
Ethics approval was granted by the Monash University Standing Committee on Ethics in Research Involving Humans, and all participants gave informed consent prior to participation in accordance with the declaration of Helsinki.
Procedures
interactive stylus upon screen surface, measured at 1 kHz, which was transmitted to a con-nected laptop. No filter was applied to the pen trace at pre-processing. Kinematic analysis was performed using Matlab software (Version 8.01, MathWorks, MA, USA).
Two circular yellow targets were presented upon a white background. In each condition tar-get size and distance varied, comprising two levels of tartar-get size (large 2cm, or small, 1cm), and two levels of distance between targets (near 12cm, or far 25cm). The combination of size and distance resulted in four trial conditions with corresponding ID’s (seeFig 1).
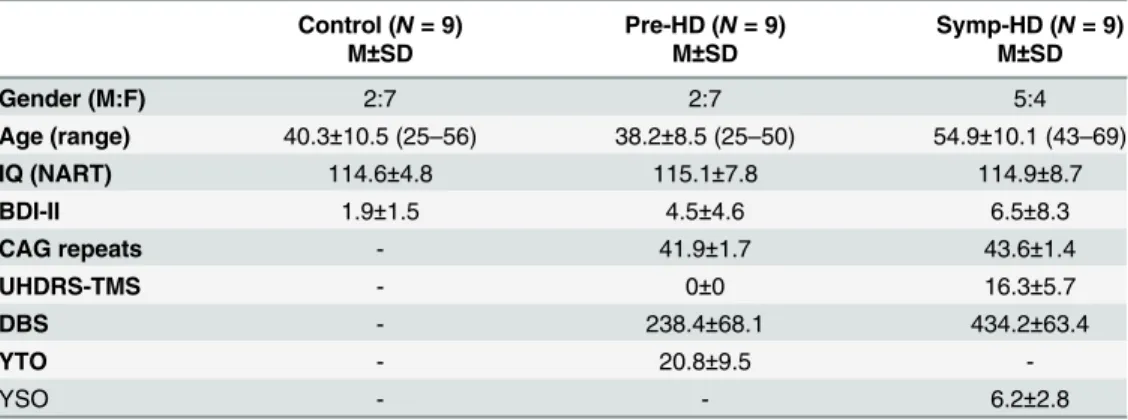
Table 1. Demographic and neurocognitive data across groups. Means and standard deviations (SD) provided.
Control (N= 9) Pre-HD (N= 9) Symp-HD (N= 9)
M±SD M±SD M±SD
Gender (M:F) 2:7 2:7 5:4
Age (range) 40.3±10.5 (25–56) 38.2±8.5 (25–50) 54.9±10.1 (43–69)
IQ (NART) 114.6±4.8 115.1±7.8 114.9±8.7
BDI-II 1.9±1.5 4.5±4.6 6.5±8.3
CAG repeats - 41.9±1.7 43.6±1.4
UHDRS-TMS - 0±0 16.3±5.7
DBS - 238.4±68.1 434.2±63.4
YTO - 20.8±9.5
-YSO - - 6.2±2.8
Note: IQ (NART, National Adult Reading Test); CAG, cytosine-adenine-guanine (number of repeats>40 is full penetrance); UHDRS-TMS, Unified Huntington’s Disease Rating Scale-Total Motor Score (pre-HD, UHDRS-TMS5; symp-HD, UHDRS-TMS>5); DBS, Disease Burden Score (CAG-35.5) x age; YTO, Years to onset—estimation expressed as a countdown from current age to 0 = disease onset. YSO, Years since onset of symptoms.
doi:10.1371/journal.pone.0133709.t001
Fig 1. An illustration of the four configurations representing the four conditions and retrospective indices of difficulty.
All participants were instructed to draw reciprocal lines between the two target stimuli using a pen-shaped stylus. Each trial was initiated by stylus contact, and terminated upon stylus removal. Participants completed two practice trials prior to data collection. Using their domi-nant (right) hand beginning in the centre of the left target, participants performed reciprocal movements between the centre of each circle. After 10 movements, the targets disappeared and participants continued a further 10 reciprocal movements based on their recollection of target location. This allowed for trials with visual cues (initial 10 movements) and trials with no visual cues (subsequent 10 movements) to be statistically analysed. The trial concluded when the word“STOP”appeared on screen. Visual feedback was only provided upon completion of each trial, via a red line highlighting their movement path. A total of 5 trials were performed across each of the four conditions, presented in a pseudo-random order. Participants were instructed not to rest their elbow on the desk (to provide an accurate representation of full upper limb kinematics), not to prematurely remove the stylus (as this would void the trial), and not to count movements (to avoid metronomic influences of counting). Participants were advised to place equal emphasis on both speed and accuracy of movements.
Statistical analysis
The departure from zero velocity signified movement onset, and return to zero velocity marked the completion of that movement. Each trial was visually inspected to confirm validity, with individual movements identified and analysed via a custom script written using Matlab soft-ware (Version 8.01, MathWorks, MA, USA).
The relevant dependent variables obtained from kinematic analysis included: overall move-ment time, defined as the time from movemove-ment onset to movemove-ment offset (ms); dwell time, defined as the time spent stationary between offset of the previous movement and onset of the next subsequent movement (ms); peak velocity, the peak speed reached during the movement (cm/ms); mean velocity, the average speed during each trial (cm/ms); time to peak, time taken from movement initiation to reach peak velocity (ms); time after peak, time taken to decelerate from peak speed during target approach and to return to zero velocity (ms); Movement time variability, the standard deviation of individual movement times; Asymmetry index, propor-tion of time spent accelerating compared with time spent decelerating, (calculated as Time To Peak divided by Movement Time) [70]. Asymmetry Index scores ranged from 0.0–0.9, with a score of 0.5 indicating equal time spent accelerating and decelerating. Accuracy was also con-sidered via measures of constant error (mean distance from target centre in cm) and absolute variable error (standard deviation of movement endpoint in cm). Dependent variables were averaged for each trial, and each cue condition (with or without visual targets separately), and a total average was obtained for each participant. Given that index of difficulty is predicted to influence each of the dependent variables in a systematic way, we will not discuss main effects of index of difficulty. We will report only main effects and interactions involving Group.
A linear regression of Movement time, as a function of Index of difficulty, was performed to address the initial hypothesis, whether each group would display kinematic profiles that con-form to Fitts’law. To explore group differences, three-way mixed model ANCOVA’s, using factors Group (control, pre-HD and symp-HD), ID (3.58, 4.58, 4.64 and 5.64) and Cue Condi-tion (with or without visual targets) were performed across each of the dependent variables whilst covarying for age. Where required, post-hoc one-way ANCOVA’s were performed to further investigate significant interactions. Due to expected age differences between groups, age was used as a covariate across all analyses.
CAG repeat length, UHDRS-TMS and time in years to/since onset. The pre-HD and symp-HD groups were combined to create a new variable, investigating disease characteristics as a contin-uum [45].
The raw data collected in this study can be viewed inS1 Dataset.
Results
Preliminary analyses were performed across all data addressing violations, with relevant statis-tics reported below. The following section presents the results according to variables of interest.
Movement time
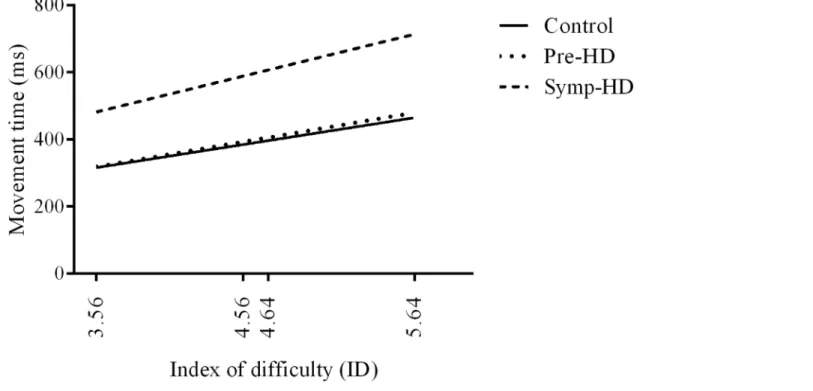
All participants conformed to Fitts’law, with a linear regression analysis revealing a positive relationship between Movement time and Index of difficulty (Fig 2). All groups expressed a moderate fit to the regression model (controls R2= .63,p= .029); pre-HD R2= .50,p= .016; symp-HD R2= .52,p= .005). A one-way ANCOVA was performed on the slope of regression lines for each participant, which revealed no significant Group differenceF(2,26) = 1.68,p= .207. For all groups, Movement time increased as a function of increasing Index of difficulty.
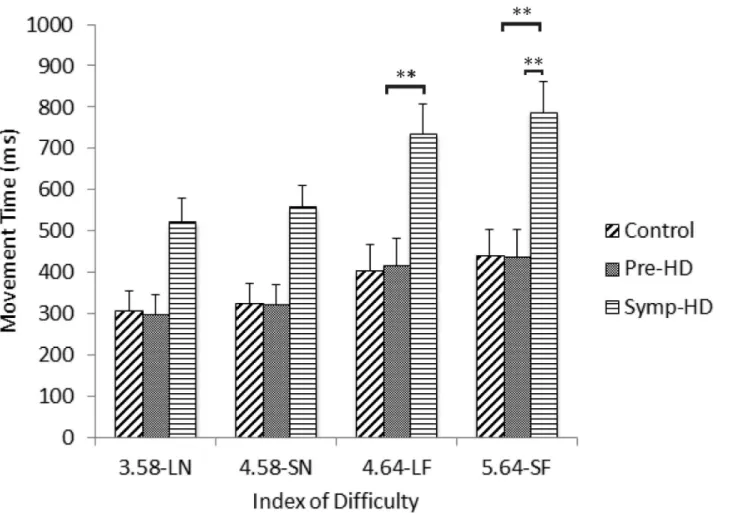
A three-way ANCOVA revealed no significant main effect of Group. There was a significant Group by ID interaction,F(3.56, 39.13) = 3.56,p<.020,ηp2= .239. After Bonferroni
correc-tions, post-hoc ANCOVA’s revealed that the symp-HD group (4.64-LF:M= 677,SE= 419; 5.64-SF:M= 716,SE= 433) performed significantly (p<.008) slower than controls at the two
highest ID conditions (4.64-LF:M= 429,SE= 103; 5.64-SF:M= 469,SE= 109), and signifi-cantly (p<.008) slower than pre-HD (5.64-SF:M= 481,SE= 126) only at the highest ID
con-dition (Fig 3). There were no other significant interactions.
Fig 2. Linear regression of movement times as a function of index of difficulty.
Dwell Time
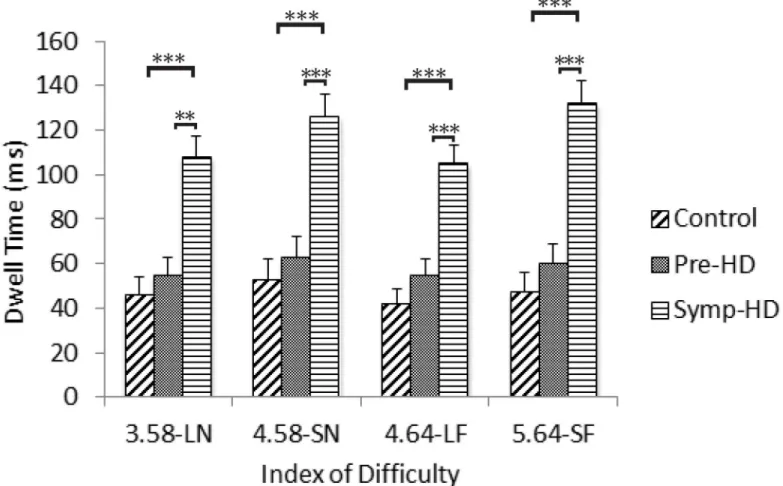
A three-way ANCOVA revealed a significant main effect of Group,F(2, 23) = 8.36,p= .002, ηp2= .421; the symp-HD group (M= 105,SE= 17) expressed significantly longer dwell times than both the control (M= 53,SE= 6.45;p= .002) and pre-HD (M= 66,SE= 9;p= .011) groups. A significant Group by ID interaction was also found,F(5.71, 65.66) = 2.47,p<.05,
ηp2= .177. After Bonferroni corrections, post-hoc ANCOVA’s revealed that the symp-HD
group (3.58-LN:M= 95,SE= 17; 4.58-SN:M= 113,SE= 18; 4.64-LF:M= 94,SE= 14; 5.64 = SF:M= 116,SE= 19) presented with significantly (p<.001) longer dwell times than
both the control group (3.58-LN:M= 51,SE= 6; 4.58-SN:M= 57,SE= 7; 4.64-LF:M= 47,
SE= 6; 5.64 = SF:M= 53,SE= 7) and the pre-HD group (3.58-LN:M= 63,SE= 8; 4.58-SN:
M= 70,SE= 9; 4.64-LF:M= 62,SE= 7; 5.64 = SF:M= 70,SE= 10) across each index of diffi-culty (Fig 4). There were no other significant interactions.
Peak Velocity and Mean Velocity
A three-way ANCOVA revealed no significant Group effects for mean velocityF(2, 23) = 0.68,
p= .52 or peak velocityF(2, 23) = 0.27,p= .76. There were no significant interaction effects for mean velocity or peak velocity.
Fig 3. Movement time between groups as a function of index of difficulty.Standard error bars included. Note: LN = large near, SN = small near, LF = large far, SF = small far.**= p<.01.
Time To Peak Velocity
A three-way ANCOVA revealed no significant Group effects,F(2, 23) = 2.11,p= .14, or inter-actions in time to peak velocity.
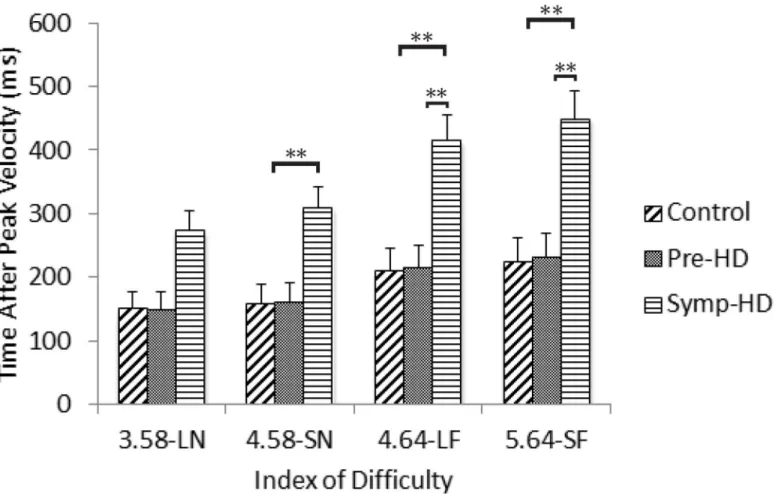
Time After Peak Velocity
A three-way ANCOVA revealed no significant main effect of GroupF(2, 23) = 3.22,p= .058. There was a significant Group by ID interaction,F(4.02, 46.3) = 4.24,p= .005,ηp2= .270.
Post-hoc ANCOVA’s revealed that the symp-HD group (4.58-SN:M= 282,SE= 66; 4.64-LF:
M= 377,SE= 81; 5.64 = SF:M= 402,SE= 84) took significantly (p<.008) longer to decelerate
from peak speed than controls at the three higher ID conditions (4.58-SN:M= 170,SE= 15; 4.64-LF:M= 224,SE= 21; 5.64 = SF:M= 243,SE= 23), and significantly (p<.008) longer to
decelerate from peak speed than pre-HD (5.64 = SF:M= 258,SE= 28) only at the two highest ID conditions (Fig 5). There were no other significant interactions.
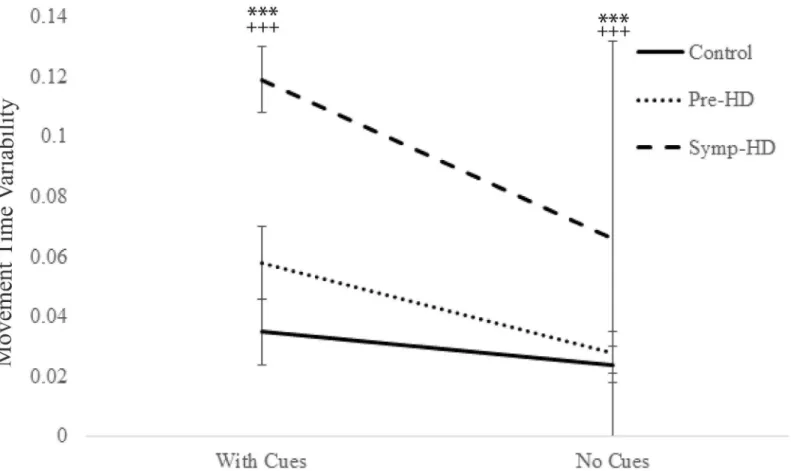
Movement Time Variability
A three-way ANCOVA revealed a significant main effect of Group,F(2, 23) = 11.87,p<.001,
ηp2= .508; the symp-HD group (M= .093,SE= .009) performed with significantly greater
vari-ability than both the control (M= .043,SE= .008;p<.001) and pre-HD (M= .043,SE= .008;
Fig 4. Dwell times between groups as a function of index of difficulty.Standard error bars included. Note: LN = large near, SN = small near, LF = large far, SF = small far.**= p<.01,***= p<.001.
p= .004) groups. There was also significant main effect of Cue condition,F(2, 23) = 66.12,p<
.001,ηp2= .742; all groups showing significantly greater variability when cues were present (M
= .071,SE= .006;p<.001), compared with when they were removed (M= .039,SE= .003;p<
.001). Additionally, significant Group by Cue condition interaction was found,F(4.71, 23) = 7.13,p= .008,ηp2= .383. After Bonferroni corrections, post-hoc ANCOVA’s revealed that the symp-HD group (Cues:M= .12,SE= .007; No Cues:M= .066,SE= .004) displayed signifi-cantly (p<.001) greater variability than both the control (Cues:M= .035,SE= .006; No Cues:
M= .024,SE= .004) and pre-HD groups (Cues:M= .058,SE= .006; No Cues:M= .028,SE= .004), under both cue conditions (Fig 6). In addition, the pre-HD group showed greater vari-ability than controls, at a significance ofp= .027, just shy of the Bonferroni adjusted value ofp
= .017 to be statistically significant. There were no other significant interactions.
Asymmetry Index
A three-way ANCOVA revealed no significant Group effects,F(2, 23) = 2.59,p= .097, or inter-actions in asymmetry index.
Constant Error
A three-way ANCOVA revealed no significant Group effects,F(2, 23) = 0.63,p= .54, or inter-actions in constant error.
Fig 5. Time after peak velocity between groups as a function of index of difficulty.Standard error bars included. Note: LN = large near, SN = small near, LF = large far, SF = small far.**= p<.01.
Variable Error
A three-way ANCOVA revealed a significant main effect of Cue Condition,F(1, 23) = 7.32,p= .013,ηp2= .241; all individuals showed significantly (p<.001) greater variability in movement
end point in the cue condition without visual targets (M= .90,SE= .04), than the cue condition with visual targets (M= .62,SE= .05). No further significant Group effects,F(2, 23) = 2.68,p= .09, or interactions were found.
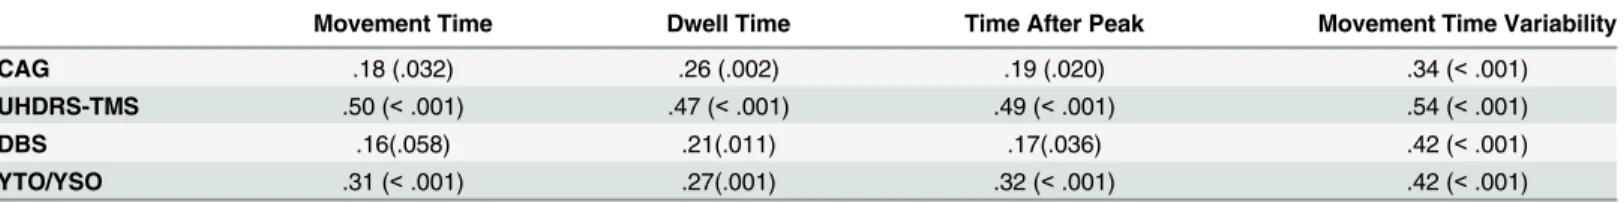
Correlations
Pearson’s correlation coefficients were used to assess the relationship between motor measures that differentiated between groups (movement time, dwell time, time after peak and movement time variability) and HD clinical disease characteristics. These correlations are represented in
Table 2.
As presented inTable 2, movement time variability showed the strongest correlations, with moderate to large positive associations across all clinical measures. Dwell time and time after peak showed small to moderate positive correlations across all clinical measures. Movement time showed small to moderate correlations with only years to/since diagnosis, CAG repeat length and UHDRS-TMS.
Fig 6. Movement time variability between groups as a function of cue condition.Standard error bars included.***= p<.001, between symp-HD and
controls;+++= p<.001, between symp-HD and pre-HD.
Discussion
The aim of this study was to characterise motor performance in pre-HD and symp-HD, com-pared with controls, in accordance with Fitts’law, to determine whether the Fitts’task is sensi-tive to subtle movement irregularities across groups, and to determine whether any notable irregularities were exacerbated in the absence of visual cues. In support of the first hypothesis, all groups conformed to Fitts’law, demonstrating increased movement times with correspond-ing increments in index of difficulty. Although no significant group differences were found on the slope of regression lines, the significant Group by ID interaction showed that symp-HD performed slower as a function of greater task difficulty, compared with pre-HD and controls. The second hypothesis was partially supported; symp-HD dedicated more time to movement planning, as evident by increased dwell times compared with controls, although no group dif-ferences were observed in time spent accelerating to peak speed. Symp-HD also showed signifi-cantly greater variability in movement times compared with both pre-HD and control groups. Although pre-HD showed a trend towards increased dwell times, their performance on the planning variables (dwell time and time to peak) did not differ significantly from controls. They did however show greater variability in movement times than controls; however, this was not statistically significant after Bonferroni corrections. The third hypothesis was also sup-ported; symp-HD demonstrating a reduced capacity for online control, as evidenced by the excessive time spent decelerating from peak speed compared with both controls and pre-HD. Contrary to the fourth hypothesis, group differences were apparent, but not in the direction expected, and were only observed in the measure of movement time variability. Greater vari-ability was apparent in the presence of visual cues compared to their absence, which was shown to increase with disease severity.
The extended movement times observed in the symp-HD group, which were exacerbated as a function of increased task difficulty, supports previous literature [11,16,71,72]. Interestingly, although movement times increased in symp-HD, there were no group differences in speed of movement as measured by both peak and mean velocities. This suggests that increased move-ment time was not attributable to overall slowness in symp-HD, who performed comparably to pre-HD and controls. One suggestion for this disconnect relates to movement trajectory. For example Carella et al. [13] also found that symp-HD performed at a comparable velocity to controls, during a square tracing task, albeit whilst travelling significantly greater distances; the authors attributed this finding to more curvilinear trajectories, thought to arise from an increase in multiple sub-movements by the HD group during the trace [13]. Sub-movements are thought to represent a directional change [26,72,73], implying that the individual has detected an error in trajectory, and subsequently has corrected for it by altering their path. This Table 2. Pearson correlations of significant variables with clinical measures.
Movement Time Dwell Time Time After Peak Movement Time Variability
CAG .18 (.032) .26 (.002) .19 (.020) .34 (<.001)
UHDRS-TMS .50 (<.001) .47 (<.001) .49 (<.001) .54 (<.001)
DBS .16(.058) .21(.011) .17(.036) .42 (<.001)
YTO/YSO .31 (<.001) .27(.001) .32 (<.001) .42 (<.001)
Note. Pre-HD and symp-HD were combined to create a new variable to explore the relationship between disease characteristics as a continuum. CAG, cytosine-adenine-guanine repeat length; UHDRS-TMS, Unified Huntington’s Disease Rating Scale total motor score; DBS, Disease Burden Score; YTO/ YSO, years to onset/ years since onset, expressed as a continuum, pre-HD counting down to 0, symp-HD counting up from 0. r = .10 to .29 small correlation, r = .30 to .49 moderate correlation, r = .50 to 1.0 large correlation (Pallant, 2011). Figures in parentheses are p values.
notion is supported by the fact that such sub-movements predominantly occur at the end stages of movement [37–39,74]. With prolonged times spent after peak velocity, our findings provide further evidence that goal-directed movements in symp-HD are laden with late stage jerks, attributable to defective online control. Researchers have postulated an inadequacy in feedback control mechanisms in symp-HD, arising from an inability to effectively integrate sensorimotor information [75]. In this case however, a deficiency in sensorimotor integration would likely be reflected in extended deceleration times across all ID conditions. With extended deceleration times apparent, as a function of increasing task difficulty, our findings instead, support the theory of a compromised internal switch, with symp-HD unable to effec-tively disengage from their current action. Assuming this is the case, symp-HD may persever-ate with each successive movement, resulting in an exacerbpersever-ated trajectory along an undesired path prior to correction, making multiple corrective sub-movements necessary.
While it is apparent that there is a deficit in online control in symp-HD, motor planning appears to also be impaired, with dwell time showing significant group differences across all ID levels. Interestingly, however, no group differences were observed in time to peak, thought also to be a function of motor planning [38–40]. The contrast in findings, across the two measures, may indicate that each variable is measuring a different motor component. Since the basal gan-glia plays a role in the planning of movement and in particular to direct when to instigate or terminate an action [76], it is possible that the measure of dwell time is representing a feature of the planned timing of a motor action. In contrast, the time taken to reach peak speed may in fact be a reflection of the quality of the motor plan [71], incorporating a more proprioceptive representation of the plan, including factors such as movement amplitude and force [77]. It is possible that the motor plan itself may not be defective in symp-HD; rather it could be that the planned timing of movement initiation is disrupted.
Further supporting this theory is the increased variability of movement times expressed by symp-HD, and to some extent, pre-HD. This supports previous findings of a disruption in the coordination of movement timing early in HD, which may be a sensitive preclinical marker of disease progression [11,18,49,50]. Interestingly, however, these differences were most notable in the cued condition. The timing mechanism of the basal ganglia initiates an internal cue, pro-viding context as to when an action should begin and end [36,78]. Efficient movements rely on both internal and external cueing; however, in the instance of HD where the basal ganglia, and subsequent internal cueing mechanism is compromised, the external cueing system must actively compensate [31,35]. Individuals with HD were expected to show greater reliance on the provision of external cues to guide motor performance as evidenced from previous studies [13,17,25]; however, the current findings did not support this. Movement time consistency was reduced in the cued condition, suggesting the absence of visual cues unexpectedly enhanced performance. It has been suggested that removing visual cues, thus removing the target objec-tive, results in a simple aimless action where accuracy is trivial [74,79,80]. The removal of cues likely simplified the task, modifying the movement into an automated action. Therefore, the need to recruit fronto-striatal circuitry (preferentially reserved for novel behaviours [81]) was reduced, thus minimising the impact this dysfunctional circuitry could have on behavioural outcomes. Whilst findings were inconsistent in the absence of visual cues, the cued condition did support previous findings, showing a marked disruption in the consistency of movement timing in symp-HD. Moreover, movement variability demonstrated consistent moderate to strong correlations across all clinical measures, suggesting that movement time variability alongside dwell time and time after peak are perhaps more sensitive measures of the voluntary movement deficit in HD, than simple measures of movement time, speed or accuracy.
providing justification to further explore more subtle motor measures across disease stages. Furthermore, the pre-HD cohort was relatively young and substantially far from onset (mean 20.8 years to onset), which may have masked the significance of any subtle motor deficits. Fur-thermore, when interpreting our results it is important to consider that the symp-HD group was significantly older than the pre-HD and control groups. This poses a limitation for assess-ing differences between symp-HD and controls, despite the fact that age was included as a covariate in all analyses. The relatively small sample size in each group may have rendered the analysis vulnerable to type II statistical error. Note that care should be taken when interpreting the pattern of results and possible influence of medication. For example of the medications reportedly taken by the symp-HD group, SSRI’s [82], neuroleptic’s [83], and Benzodiazepines [84] have all been reported to improve motor performance, particularly in suppressing chorea, although controversy remains as to the efficacy of these findings [85,86]. Note also, while par-ticipants conformed to Fitts’law, the proportionate increase in ID was relatively minor. These small scale movements may not be entirely representative of actual everyday real-world actions, therefore over interpretation should be avoided.
This is the first study, to our knowledge, that has characterised upper-limb movement in accordance with Fitts’law in both pre-HD and symp-HD groups. Overall, the voluntary motor deficit depicted in symp-HD is in-line with previous literature, and is consistent with the global neurodegenerative profile observed in symp-HD. Collectively, these findings provide evidence of a deficiency in both motor planning, particularly in relation to movement timing and online control in symp-HD, which is exacerbated as a function of task difficulty. Findings suggest that simple measures of movement time and accuracy may not be sufficient at detecting subtle motor irregularities, and consideration should be made to incorporate alternative kinematic measures such as movement time variability, dwell time and time after peak (shown to be highly sensitive in symp-HD) into the battery of motor assessments implemented in large scale biomarker development studies with larger samples. These findings contribute further to our characterization of motor function in HD and may provide guidance for future interventions to improve the functional capacity of individuals suffering from HD.
Supporting Information
S1 Dataset. File provides the raw data associated with this research. (XLSX)
Acknowledgments
We would like to acknowledge the contribution of all the participants who took part in this study.
Author Contributions
Conceived and designed the experiments: JD BDB GP AC AMT NGK. Performed the experi-ments: JD BDB AC. Analyzed the data: JD BDB GP AMT. Contributed reagents/materials/ analysis tools: JD BDB GP AC AMT NGK. Wrote the paper: JD BDB GP AC AMT NGK. Designed the software used in analysis: GP.
References
1. Cattaneo E, Zuccato C, Tartari M. Normal huntingtin function: an alternative approach to Huntington's disease. Nat Rev Neurosci. 2005; 6: 919–930. PMID:16288298
3. Sturrock A, Leavitt BR. The clinical and genetic features of Huntington disease. J Geriatr Psychiatry Neurol. 2010; 23: 243–259. doi:10.1177/0891988710383573PMID:20923757
4. Georgiou-Karistianis N, Scahill R, Tabrizi SJ, Squitieri F, Aylward E. Structural MRI in Huntington’s dis-ease and recommendations for its potential use in clinical trials. Neurosci Biobehav Rev. 2013; 37: 480–490. doi:10.1016/j.neubiorev.2013.01.022PMID:23376047
5. Group THsDCR. A Novel Gene Containing a Trinucleotide Repeat That Is Expanded and Unstable on Huntington’s Disease Chromosomes. Cell. 1993; 72: 971–983. PMID:8458085
6. Paulsen JS, Wang C, Duff K, Barker R, Nance M, Beglinger L, et al. Challenges assessing clinical end-points in early Huntington disease. Mov Disord. 2010; 25: 2595–2603. doi:10.1002/mds.23337PMID: 20623772
7. Tabrizi SJ, Scahill RI, Durr A, Roos RA, Leavitt BR, Jones R, et al. Biological and clinical changes in premanifest and early stage Huntington's disease in the TRACK-HD study: the 12-month longitudinal analysis. Lancet Neurol. 2011; 10: 31–42. doi:10.1016/S1474-4422(10)70276-3PMID:21130037 8. Aylward EH, Nopoulos PC, Ross CA, Langbehn DR, Pierson RK, Mills JA, et al. Longitudinal change in
regional brain volumes in prodromal Huntington disease. J Neurol Neurosurg Psychiatry. 2011; 82: 405–410. doi:10.1136/jnnp.2010.208264PMID:20884680
9. Philpott AL, Fitzgerald PB, Cummins TDR, Georgiou-Karistianis N. Transcranial magnetic stimulation as a tool for understanding neurophysiology in Huntington’s disease: A review. Neurosci Biobehav Rev. 2013; 37: 1420–1433. doi:10.1016/j.neubiorev.2013.05.009PMID:23727400
10. Andrich J, Saft C, Ostholt N, Müller T. Assessment of simple movements and progression of Hunting-ton's disease. J Neurol Neurosurg Psychiatry. 2007; 78: 405–407. PMID:17369593
11. Bechtel N, Scahill RI, Rosas HD, Acharya T, Van Den Bogaard SJA, Jauffret C, et al. Tapping linked to function and structure in premanifest and symptomatic Huntington disease. Neurology. 2010; 75: 2150–2160. doi:10.1212/WNL.0b013e3182020123PMID:21068430
12. Bartenstein P, Weindl A, Spiegel S, Boecker H, Wenzel R, Ceballos-Baumann AO, et al. Central motor processing in Huntington's disease. A PET study. Brain. 1997; 120: 1553–1567. PMID:9313639 13. Carella F, Bressanelli M, Piacentini S, Soliveri P, Geminiani G, Monza D, et al. A study of arm
move-ments in Huntington's disease under visually controlled and blindfolded conditions. Neurol Sci. 2003; 23: 287–293. PMID:12624715
14. CurràA, Agostino R, Galizia P, Fittipaldi F, Manfredi M, Berardelli A. Sub-movement cueing and motor
sequence execution in patients with Huntington's disease. Clin Neurophysiol. 2000; 111: 1184–1190. PMID:10880791
15. Folstein SE, Jensen B, Leigh RJ, Folstein MF. The measurement of abnormal movement: Methods developed for Huntington's disease. Neurobehav Toxicol Teratol. 1983; 5: 605–609. PMID:6230541 16. Georgiou N, Bradshaw JL, Phillips JG, Chin E, Bradshaw JA. Reliance on advance information and
movement sequencing in Huntington's disease. Mov Disord. 1995; 10: 472–481. PMID:7565829 17. Georgiou-Karistianis N, Long JD, Lourens SG, Stout JC, Mills JA, Paulsen JS, et al. Movement
sequencing in Huntington’s disease. World J Biol Psychiatry. 2014; 15: 459–471. doi:10.3109/ 15622975.2014.895042PMID:24678867
18. Hinton SC, Paulsen JS, Hoffmann RG, Reynolds NC, Zimbelman JL, Rao SM. Motor timing variability increases in preclinical Huntington's disease patients as estimated onset of motor symptoms approaches. J Int Neuropsychol Soc. 2007; 13: 539–543. PMID:17445303
19. Lemay M, Fimbel E, Beuter A, Chouinard S, Richer F. Sensorimotor mapping affects movement correc-tion deficits in early Huntington's disease. Exp Brain Res. 2005; 165: 454–460. PMID:15875168 20. Lemay M, Chouinard S, Richer F, Lesperance P. Huntington's disease affects movement termination.
Behav Brain Res. 2008; 187: 153–158. PMID:17980441
21. Michell AW, Goodman AOG, Silva AHD, Lazic SE, Morton AJ, Barker RA. Hand tapping: A simple, reproducible, objective marker of motor dysfunction in Huntington's disease. J Neurol. 2008; 255: 1145–1152. doi:10.1007/s00415-008-0859-xPMID:18465109
22. Moisello C, Perfetti B, Marinelli L, Sanguineti V, Bove M, Feigin A, et al. Basal ganglia and kinematics modulation: Insights from Parkinson's and Huntington's diseases. Parkinsonism Relat Disord. 2011; 17: 642–644. doi:10.1016/j.parkreldis.2011.06.021PMID:21764625
23. Saft G, Andrich J, Meisel NM, Przuntek H, Müller T. Assessment of complex movements reflects dys-function in Huntington's disease. J Neurol. 2003; 250: 1469–1474. PMID:14673581
25. Say MJ, Jones R, Scahill RI, Dumas EM, Coleman A, Santos RC, et al. Visuomotor integration deficits precede clinical onset in Huntington's disease. Neuropsychologia. 2011; 49: 264–270. doi:10.1016/j. neuropsychologia.2010.11.016PMID:21094653
26. Smith MA, Brandt J, Shadmehr R. Motor disorder in Huntington's disease begins as a dysfunction in error feedback control. Nature. 2000; 403: 544–549. PMID:10676962
27. Stout JC, Jones R, Labuschagne I, O'Regan AM, Say MJ, Dumas EM, et al. Evaluation of longitudinal 12 and 24 month cognitive outcomes in premanifest and early Huntington's disease. J Neurol Neuro-surg Psychiatry. 2012; 83: 687–694. doi:10.1136/jnnp-2011-301940PMID:22566599
28. van Vugt JPP, Piet KKE, Vink LJ, Siesling S, Zwinderman AH, Middelkoop HA, et al. Objective assess-ment of motor slowness in Huntington's disease: Clinical correlates and 2-year follow-up. Mov Disord. 2004; 19: 285–297. PMID:15022182
29. Yágüez L, Lange HW, Hömberg V. Differential effect of Huntington's and Parkinson's diseases in pro-gramming motor sequences of varied lengths. J Neurol. 2006; 253: 186–193. PMID:16044211 30. Biglan KM, Zhang Y, Long JD, Geschwind M, Kang GA, Killoran A, et al. Refining the diagnosis of
hun-tington disease: The PREDICT-HD study. Front Aging Neurosci. 2013; 5.
31. Bapi RS, Miyapuram KP, Graydon FX, Doya K. fMRI investigation of cortical and subcortical networks in the learning of abstract and effector-specific representations of motor sequences. NeuroImage. 2006; 32: 714–727. PMID:16798015
32. Brotchie P, Iansek R, Horne MK. Motor function of the monkey globus pallidus: 1. Neuronal discharge and parameters of movement. Brain. 1991; 114: 1667–1683. PMID:1884172
33. Brotchie P, Iansek R, Horne MK. Motor function of the monkey globus pallidus: 2. Cognitive aspects of movement and phasic neuronal activity. Brain. 1991; 114: 1685–1702. PMID:1884173
34. Chakravarthy VS, Joseph D, Bapi RS. What do the basal ganglia do? A modeling perspective. Biol Cybern. 2010; 103: 237–253. doi:10.1007/s00422-010-0401-yPMID:20644953
35. Cunnington R, Iansek R, Bradshaw JL, Phillips JG. Movement-related potentials in Parkinson's dis-ease—Presence and predictability of temporal and spatial cues. Brain. 1995; 118: 935–950. PMID: 7655889
36. Georgiou N, Iansek R, Bradshaw JL, Phillips JG, Mattingley JB, Bradshaw JA. An evaluation of the role of internal cues in the pathogenesis of Parkinsonian hypokinesia. Brain. 1993; 116: 1575–1587. PMID: 8293289
37. Elliott D, Chua R, Helsen WF. A century later: Woodworth's (1899) two-component model of goal-directed aiming. Psychol Bull. 2001; 127: 342–357. PMID:11393300
38. Elliott D, Hansen S, Grierson LEM, Lyons J, Bennett SJ, Hayes SJ. Goal-Directed Aiming: Two Compo-nents but Multiple Processes. Psychol Bull. 2010; 136: 1023–1044. doi:10.1037/a0020958PMID: 20822209
39. Jeannerod M. The neural and bahavioural organization of goal-directed movement. New York, NY: Oxford University Press; 1988.
40. Woodworth RS. The accuracy of voluntary movement. Psychol Rev. 1899; 3: 1–119.
41. Fautrelle L, Bonnetblanc F. On-line coordination in complex goal-directed movements: A matter of inter-actions between several loops. Brain Res Bull. 2012; 89: 57–64. doi:10.1016/j.brainresbull.2012.07. 005PMID:22814096
42. Glover S. Separate visual representations in the planning and control of action. Behav Brain Sci. 2004; 27: 3–24. PMID:15481943
43. Glover S, Wall MB, Smith AT. Distinct cortical networks support the planning and online control of reaching-to-grasp in humans. Eur J Neurosci. 2012; 35: 909–915. doi:10.1111/j.1460-9568.2012. 08018.xPMID:22429244
44. Biglan KM. Tapping in Huntington disease: a path forward to preventive therapies? Neurology. 2010; 75: 2142–2143. doi:10.1212/WNL.0b013e318203f0cdPMID:21068428
45. Reilmann R, Bohlen S, Klopstock T, Bender A, Weindl A, Saemann P, et al. Tongue force analysis assesses motor phenotype in premanifest and symptomatic Huntington's disease. Mov Disord. 2010; 25: 2195–2202. doi:10.1002/mds.23243PMID:20645403
46. Hayward L, Zubrick SR, Hall W. Early sensory-perceptual changes in Huntington's disease. Aust N Z J Psychiatry. 1985; 19: 384–389. PMID:2938570
48. Tabrizi SJ, Scahill RI, Owen G, Durr A, Leavitt BR, Roos RA, et al. Predictors of phenotypic progression and disease onset in premanifest and early-stage Huntington's disease in the TRACK-HD study: Analy-sis of 36-month observational data. Lancet Neurol. 2013; 12: 637–649. doi:10.1016/S1474-4422(13) 70088-7PMID:23664844
49. Delval A, Bleuse S, Simonin C, Delliaux M, Rolland B, et al. Are gait initiation parameters early markers of Huntington's disease in pre-manifest mutation carriers? Gait Posture. 2011; 34: 202–207. doi:10. 1016/j.gaitpost.2011.04.011PMID:21616667
50. Rao AK, Marder KS, Uddin J, Rakitin BC. Variability in interval production is due to timing-dependent deficits in Huntington's disease. Mov Disord. 2014.
51. Malapani C, Rakitin B, Levy R, Meck WH, Deweer B, Dubois B, et al. Coupled temporal memories in Parkinson's disease: A dopamine-related dysfunction. J Cogn Neurosci. 1998; 10: 316–331. PMID: 9869707
52. Rao AK, Mazzoni P, Wasserman P, Marder K. Longitudinal change in gait and motor function in pre-manifest Huntington's disease. PLoS Curr. 2011.
53. Wiener M, Turkeltaub P, Coslett HB. The image of time: A voxel-wise meta-analysis. NeuroImage. 2010; 49: 1728–1740. doi:10.1016/j.neuroimage.2009.09.064PMID:19800975
54. Fitts PM. The information capacity of the human motor system in controlling the amplitude of move-ment. J Exp Psychol. 1954; 47: 381–391. PMID:13174710
55. Fitts PM, Peterson JR. Information capacity of discrete motor responses. J Exp Psychol. 1964; 67: 103–112. PMID:14114905
56. Elliott D, Hansen S, Mendoza J, Tremblay L. Learning to optimize speed, accuracy, and energy expen-diture: A framework for understanding speed-accuracy relations in goal-directed aiming. J Mot Behav. 2004; 36: 339–351. PMID:15262629
57. Meyer DE, Abrams RA, Kornblum S, Wright CE, Smith JEK. Optimality in Human Motor Performance: Ideal Control of Rapid Aimed Movements. Psychol Rev. 1988; 95: 340–370. PMID:3406245 58. Corben LA, Georgiou-Karistianis N, Bradshaw JL, Hocking DR, Churchyard AJ, Delatycki MB. The
Fitts task reveals impairments in planning and online control of movement in Friedreich ataxia: Reduced cerebellar-cortico connectivity? Neuroscience. 2011; 192: 382–390. doi:10.1016/j. neuroscience.2011.06.057PMID:21749914
59. Hocking DR, Rinehart NJ, McGinley JL, Moss SA, Bradshaw JL. A kinematic analysis of visually-guided movement in Williams syndrome. J Neurol Sci. 2011; 301: 51–58. doi:10.1016/j.jns.2010.11.001 PMID:21095618
60. Papadopoulos N, McGinley J, Tonge BJ, Bradshaw JL, Saunders K, Rinehart NJ. An investigation of upper limb motor function in high functioning autism and Asperger's disorder using a repetitive Fitts' aiming task. Res Autism Spect Disord. 2012; 6: 286–292.
61. Ternes AM, Fielding J, Corben LA, White OB, Bradshaw JL, Hocking DR. Movement planning and online control in multiple sclerosis: assessment using a Fitts law reciprocal aiming task. Cogn Behav Neurol. 2014; 27: 139–147. PMID:25237744
62. Temprado JJ, Sleimen-Malkoun R, Lemaire P, Rey-Robert B, Retornaz F, Berton E. Aging of sensori-motor processes: A systematic study in Fitts' task. Exp Brain Res. 2013; 228: 105–116. doi:10.1007/ s00221-013-3542-0PMID:23649969
63. Oldfield RC. The assessment and analysis of handedness: The edinburgh inventory. Neuropsycholo-gia. 1971; 9: 97–113. PMID:5146491
64. Nelson HE, Willison J. National Adult Reading Test (NART). Test Manual. 2 ed. Windsor UK: NFER Nelson; 1991.
65. Beck AT, Steer RA, Brown GK. Manual for the beck depression inventory-II. San Antonio: Psychologi-cal Corporation; 1996.
66. Huntington Study Group. Unified huntington's disease rating scale: Reliability and consistency. Mov Disord. 1996; 11: 136–142. PMID:8684382
67. Tabrizi SJ, Langbehn DR, Leavitt BR, Roos RA, Durr A, Craufurd D, et al. Biological and clinical mani-festations of Huntington's disease in the longitudinal TRACK-HD study: cross-sectional analysis of baseline data. Lancet Neurol. 2009; 8: 791–801. doi:10.1016/S1474-4422(09)70170-XPMID: 19646924
68. Penney JB Jr, Vonsattel JP, MacDonald ME, Gusella JF, Myers RH. CAG repeat number governs the development rate of pathology in huntington's disease. Ann Neurol. 1997; 41: 689–692. PMID: 9153534
70. Chua R, Elliott D. Visual regulation of manual aiming. Hum Mov Sci. 1993; 12: 365–401.
71. Phillips JG, Bradshaw JL, Chiu E, Teasdale N, Iansek R, Bradshaw JA. Bradykinesia and movement precision in Huntington's disease. Neuropsychologia. 1996; 34: 1241–1245. PMID:8951836 72. Quinn L, Hamel V, Flanagan R, Kaminski T, Rubin A. Control of multijoint arm movements in
Hunting-ton's disease. J Neurol Rehabil. 1997; 11: 47–60.
73. Milner TE, Ijaz MM. The effect of accuracy constraints on three-dimensional movement kinematics. Neuroscience. 1990; 35: 365–374. PMID:2381512
74. Keele SW, Posner MI. Processing of visual feedback in rapid movements. Journal of Exp Psychol. 1968; 77: 155–158.
75. Boulet C, Lemay M, Bédard MA, Chouinard MJ, Chouinard S, Richer F. Early Huntington's disease affects movements in transformed sensorimotor mappings. Brain Cogn. 2005; 57: 236–243. PMID: 15780456
76. Jeannerod M. The cognitive neuroscience of action. Cambridge, MA: Blackwell Publishers; 1997. 77. Sarlegna FR, Sainburg RL. The roles of vision and proprioception in the planning of reaching
move-ments. Adv Exp Med Biol.2009. pp. 317–335.
78. Sheppard D, Bradshaw JL, Phillips JG, Iansek R, Cunnington R, Georgiou N, et al. Cuing of movement in Parkinson's disease. Neuropsychiat Neuropsychol Behav Neurol. 1996; 9: 91–98.
79. Craik KJW. Theory of the human operator in control systems 1. Brit J Psychol. 1947; 38: 56–61. 80. Crossman ER, Goodeve PJ. Feedback control of hand-movement and Fitts' Law. Q J Exp Psychol A:
Hum Exp Psychol. 1983; 35 Pt 2: 251–278.
81. Miller EK, Cohen JD. An integrative theory of prefrontal cortex function. Ann Rev Neurosci. 2001. pp. 167–202. PMID:11283309
82. Peng Q, Masuda N, Jiang M, Li Q, Zhao M, Ross CA, et al. The antidepressant sertraline improves the phenotype, promotes neurogenesis and increases BDNF levels in the R6/2 Huntington's disease mouse model. Exp Neurol. 2008; 210: 154–163. PMID:18096160
83. Parsa MA, Szigethy E, Voci JM, Meltzer HY. Risperidone in treatment of choreoathetosis of Hunting-ton's disease. J Clin Psychopharmacol. 1997; 17: 134–135. PMID:10950488
84. Peiris JB, Boralessa H, Lionel NDW. Clonazepam in the treatment of choreiform activity. Med J Aust. 1976; 1: 225–227. PMID:131236
85. Frank S. Treatment of Huntington's Disease. Neurotherapeutics. 2014; 11: 153–160. doi:10.1007/ s13311-013-0244-zPMID:24366610