REVISTA
BRASILEIRA
DE
ANESTESIOLOGIA
PublicaçãoOficialdaSociedadeBrasileiradeAnestesiologiawww.sba.com.br
SCIENTIFIC
ARTICLE
Infrared
image
monitoring
of
local
anesthetic
poisoning
in
rats
夽
Angelo
Manoel
G.
Carstens
∗,
Elizabeth
Milla
Tambara,
Daniel
Colman,
Márcio
G.
Carstens,
Jorge
Eduardo
Fouto
Matias
UnversidadeFederaldoParaná(UFPR),Curitiba,PR,Brazil
Received19February2015;accepted22April2015 Availableonline31August2016
KEYWORDS
Monitoring; Localanesthetics; Acuteintoxication; Ropivacaine; Infraredimaging; Rats
Abstract
Backgroundandobjectives: Toevaluatethethermographicpredictivevalueoflocalanesthetic poisoninginratsthatindicatestheearlyrecognitionofthermalsignsofintoxicationandenable theimmediatestartofadvancedlifesupport.
Methods:Wistarratsunderwentintraperitonealinjectionofsalineandropivacaine;theywere allocatedintopairs,andexperimentsperformedatbaselineandexperimentaltimes.For ther-mography, centralandperipheralcompartmentwere analyzed,checking themaximum and averagedifferencesoftemperaturesbetweengroups.Thermographicandclinicalobservations wereperformedforeachexperiment,andthetimesinwhichthesignsofintoxicationoccurred wererecorded.Inthethermalanalysis,thethermogramscorrespondingtothetimesofinterest weresoughtandrelevantdatasheetsextractedforstatisticalanalysis.
Results:Basal andexperimental: the displayofthe thermal images attimes was possible. It was possibletocalculate the heattransfer rateinall cases. Atbaseline itwas possible toseethephysiologyofmicrocirculation,characterizedbythermaldistributioninthe cran-iocaudal direction. It was possible to visualize the pathophysiological changes or thermal dysautonomias causedby intoxicationbefore clinical signs occur,characterized by areas of hyper-radiation,translatingautonomicnervoussystempathophysiologicaldisorders.Inanimals poisonedbyropivacaine,therewasnostatisticallysignificantdifferenceinheattransferrate attheexperimentaltime.
Conclusions: Themaximumtemperature,mediumtemperature,andheattransferratewere different fromthestatistical point ofviewbetween groups attheexperimentaltime,thus confirmingthesystemicthermographicpredictivevalue.
©2016SociedadeBrasileiradeAnestesiologia.Publishedby ElsevierEditoraLtda.Thisisan openaccessarticleundertheCCBY-NC-NDlicense( http://creativecommons.org/licenses/by-nc-nd/4.0/).
夽 ThisarticleispartofDr.AngeloCarstens’PhDthesis,GraduatePrograminClinicalSurgeryoftheFederalUniversityofParaná,Curitiba, PR,Brazil.
∗Correspondingauthor.
E-mail:[email protected](A.M.Carstens).
http://dx.doi.org/10.1016/j.bjane.2015.04.006
PALAVRAS-CHAVE
Monitorizac¸ão; Anestésicoslocais; Intoxicac¸ãoaguda; Ropivacaína; Imagem infravermelha; Ratos
Monitorizac¸ãoporimageminfravermelhadaintoxicac¸ãoporanestésicolocalemratos
Resumo
Justificativaeobjetivos: Estudarovalorpreditivotermográficonaintoxicac¸ãoporanestésico local em ratosque efetue o reconhecimento precoce dos sinais térmicos de intoxicac¸ão e possibiliteoinícioimediatodosuporteavanc¸adodevida.
Método: RatosWistarforamsubmetidosàinjec¸ãointraperitonealdesorofisiológicoe ropiva-caína,alocadosaospares,eforamfeitosexperimentosemtemposbasaleexperimental.Parao estudotermodinâmicoforamanalisadosocompartimentocentraleoperiférico,verificaram-se asdiferenc¸asdastemperaturasmáximasemédiasentreosgrupos.Foramfeitasobservac¸ões clínicas e termográficaspara cada experimentoe anotados ostempos em que ossinais de intoxicac¸ão ocorriam. Foram buscados na análise termográfica os termogramas correspon-dentesaostemposdeinteresseeextraídasasplanilhasdedadoscorrespondentes,paraanálise estatística.
Resultados: Foipossívelavisibilizac¸ãodasimagenstérmicasnosmomentosbasale experimen-tal.Foipossívelcalcularataxadetransferênciadecaloremtodososcasos.Nomomentobasal foipossívelobservarafisiologiadamicrocirculac¸ão,caracterizadapordistribuic¸ãotérmicano sentidocraniocaudal. Foi possívelvisibilizar asalterac¸ões fisiopatológicas oudisautonomias térmicas causadas pela intoxicac¸ão antes que ossinais clínicos ocorressem, caracterizadas por áreas de hiperradiac¸ão e traduziram perturbac¸ões fisiopatológicas do Sistema Nervoso Autônomo. Nosanimais intoxicados porropivacaína houvediferenc¸a estatisticamente signi-ficativanataxadetransferênciadecalornomomentoexperimental.
Conclusões:Constatou-sequeatemperaturamáxima,atemperaturamédiaeataxade trans-ferênciadecalorforamdiferentesdopontodevistaestatísticoentreosgruposnomomento experimental,oquecorroboraovalorpreditivotermográficosistêmico.
©2016SociedadeBrasileiradeAnestesiologia.PublicadoporElsevierEditoraLtda.Este ´eum artigoOpen Accesssobumalicenc¸aCCBY-NC-ND( http://creativecommons.org/licenses/by-nc-nd/4.0/).
Introduction
Assessmentofthesystemicthermographicpredictivevalue is very important for increasing safety in anesthesia and surgicalprocedures.The observationof accidentsin clini-calpracticeofanesthesiaandtheirpotentiallyfataleffects suggestthedevelopmentofasupplementaryperioperative monitoringmethodtopredictcasesofintoxicationbylocal anesthetics (LA). This method can provide early recogni-tionof the intoxication signs and the immediate start of advancedlifesupportinthesecriticalsituations.
The direct intraperitoneal LA instillationstarted tobe used in clinical practice, with confirmed efficiency and decreasedmorphineuseforpostoperative(PO)analgesia.1
AnimportantstudyintheUK showedresultsofdecreased immediate postoperative pain complaints, particularly in the first hours and when LA was used intraperitoneal at thebeginningofsurgery.The studyconcludedthatLAuse issafeandprovidessignificantpainreductionintheearly postoperativeperiod.2AnotherstudyofintraperitonealLA
nebulization for pain management was performed. The authorshighlighted theimportance ofthis technique,but stressedtheneedforfurtherstudiestoevaluatethesafety of intraperitoneal anesthetic administration.3 This
impor-tantobservationdemonstratestherelevanceofthepresent study regardingthe pathophysiology of acute intoxication inducedbyintraperitonealLA.
StudiesofintraperitonealLAforPOanalgesiain laparo-scopic procedures have yielded conflicting results. LA
distributionandinadequateabsorptionalongtheperitoneal surface were considered as one of the factors contribut-ing to such results.4---6 New forms of intraperitoneal LA
administrationweretestedtoprovideanalgesiaandbetter distribution and peritoneal absorption, such as intraperi-toneal aerosolization.7 The development of new devices
thatdeliverLAcombinewiththepneumoperitoneum insuf-flationgasisalsohighlighted.8
Bupivacainehas oftenbeen used inanesthesia, partic-ularly in long procedures, and provides excellent sensory and motor anesthesia. However, some unexpected acci-dentswithitsuseencouragedthesearchforsaferoptions regarding cardiovascularcomplications, aswell ascentral nervoussystem toxicity.9 Becauseof these complications,
ropivacaine was developed.10 However, more studies are
need to assess the behavior of thermal changes and the pathophysiologyinvolved initsintraperitoneal administra-tionandclinicalimplications.
Assessingthesystemicthermographicpredictivevaluein LAacuteintoxicationisofparamountimportancetoimprove surgicalsafety,asneurotoxicandcardiotoxiccomplications are relatedtochanges in microcirculation andvasomotor stateandincreasedrateofintercompartmentalheat trans-fer.
support management and surgery monitoring. The use of perioperative infrared (IR) monitoring may contribute to increasesafetyinanestheticproceduresandimprove surgi-calclinicmanagement,asitisanoninvasivecomplementary method and safe for recognition and prevention of anes-theticcomplications.
Method
The experimentalstudy wasperformed in the Experimen-talSurgeryLaboratoryoftheGraduatePrograminSurgery, Federal Universityof Paraná(UFPR),andapprovedby the UFPREthicsCommittee.Experimentalprocedureswere con-ducted in accordance with the ethical principles of the BrazilianCollegeofAnimalExperimentation(COBEA)11 and
the Guide for the Care and Use of Experimental Animals (CanadianCouncilonAnimalCare)requirements.
A totalof 24 maleWistar rats(Rattus norvegicus albi-nos,Rodentia mammalia)with70 daysof life andweight of330---400gwereused.Theanimalswereplacedincages, eachwithfiveanimals.Itwasobservedacircadianrhythm of 12h/light and 12h/dark. Preoperatively, rats type Cr-1 received standardized food and free access to water up to12h before the procedure. Environmental variables (temperature, humidity, and air velocity) were recorded. Therewasminimalthermalvariation,withambient temper-aturemaintainedwithinthelimitsof22◦Cbyprogramming the previous environment climate and relative humidity at 50%, both checkedusing athermo-hygrometer, so that the animal was in thermal comfort at the beginning of the trial, with no clinical signs of sweat or thermogenic shivering.
The animals were allocatedinto twogroups of 12 rats each (n=24).Group S(saline solution)received intraperi-tonealinjectionofsalinesolutioninthesamevolumeused inGroupR;GroupR(ropivacaine)receivedintraperitoneal injectionof1%ropivacaineatadoseof300mgkg−1.Twelve paired experiments were performed in two specific time points(baselineandexperimental)inacontrolled environ-ment. The analysis of animals in their physiological state withoutconcomitantinjectionwasconsideredasbaseline. Theanalysisafterintraperitonealinjectionofsalineor ropi-vacainewasconsideredasexperimental.
A trialbox wasassembledwiththebottomisolatedby polystyrenetominimizethermalvariations,andtwo cam-erasonfixedtripodsat anapproximateangle of30◦ were placedoneachsideofthebox, onemeterawayfromthe studysubject.Forthermographicobservation,aradiometer of the UFPR GraduateProgram in Surgery, with640×480 pixelsimageresolution and307,000absolutetemperature calibrated points per frame and its computer programs, wasused.Afterbaselinemeasurements, theanimalswere carefully picked up by the dorsal cervical region by a research assistant and submitted to antisepsis and local infiltration of the application point onthe right hypogas-tric regionwiththe respectiveinjection assignedtoeach group.
Clinical and thermographic evaluations of the animals were performed, and the times in which clinical signs of intoxication occurred were recorded. Subsequently, the thermograms corresponding to the times of interest
weresought in thethermographic imagesand worksheets containingnumericdataoftemperatureswereextractedfor statistical analysis.The animals were observed until they showedsignsofLApoisoning,definedbytheonsettimeof ataxia,aimlessexecutivemovements,archedtailandneck, seizures(graduatedby+,++or+++,accordingtoseverity), colorofskin andmucousmembranes, breathingdifficulty, andrecoverytimeordeath. Thatis,thetimerequiredfor clinicalpresentationofLAintoxicationsigns,adaptedfrom experimentalmodel.12
Itwasconsidered anemissivity of0.95; thatis, 95%of theradiationemittedtotheenvironmentsufferedno reflec-tiontothesurface itself.The interface representationof digital numeric spreadsheets for conversion into thermo-gramwaspreparedbythecomputerprogram,generatedfile extension,andthe respectiveimageswereconvertedinto AVIextensionvideoclips.Thermogramswerepreparedand standardized withtemperature range, temperature level, and isotherms (a continuous colorimetric scale withlines connectingpointsofequaltemperature)inwhite,red, yel-low,green, light blue, darkblue and black colors. These colorsrepresented,respectively,adecreasingscaleof tem-peratureareas, equally distributedfrom hottertocolder. Thecolorimetricscalewasmaintaineduntiltheendofthe experiment.
Data for the animals’ weight,environmental tempera-tureand humidity, theGaussian attributes,independence andhomogeneity of variancesweretested. Previoustests mettheproposedcriteriaintheunivariateanalysis(ANOVA). Values for Group S heat transfer rate were compared at baseline and experimental time points (intergroup analy-sis),in ordertotest thehypothesis ofwhether therewas orwasnotadifferenceintheuseofintraperitonealsaline injection(surgicalstress).ForintragroupanalysisofGroup R, the heat transfer rates were also compared at base-line and experimental time points to test the hypothesis of whether therewas or was nota difference in the use ofintraperitonealsalineinjection.Thebaselineand exper-imental valuesof both groups average temperature were testedusingtheparametricmethodANOVA/MANOVA (inter-group analysis) in order todetermine whether there was difference between the stress caused by saline injection andintoxicationcausedbylocalanesthetic.Asignificance level of 0.05 or 5% (p<0.05) was set for all tests. Areas andpointswithnumericalinformationyieldedfroma ther-mogram or digital photo underwent tests for difference betweenmeansort-test(posthoc)forindependent varia-bles.
For this model, the first law of thermodynamics for a closedsystemonapermanentbasiswasapplied.The sys-temvolumecontrolwasdefinedastheregionbetweenthe centralandperipheralportionsoftheanimal;thatis,from internalorganstotheouterskinsurface.
Therat’sheatlosstotheexternalenvironment( ˙Q)was measured, considering the mass and specific heat of the animal (3.8kJkg−1◦C−1) divided by the total experiment time:
˙
Q=
where: ˙Q ---heat loss[W];m ---animal mass[kg];c --- ani-mal specific heat [Jkg−1◦C−1]; T --- difference between
initial and final temperatures [◦C]; t--- timeinterval of eachexperiment[s].
Foranalysis purposes, it was assumed that the animal specificheatis constant(3.8kJkg−1◦C−1),theexperiment timeinterval, asdetermined by the baselineand experi-mentaltimepointsandthefactthatthetestsarepaired; thatis,eachanimalpairedwithhisowncontrol.
After the experiments, the animals were killed by deepinhalationanesthesia,subjectedtoautopsyperformed by mentopubic incision, and chondrosternal plastron was removedforaccesstothoracoabdominalorgans.A macro-scopicstudyoftheviscerawasperformed.
Results
Elevenpairedexperimentswere consideredasvalidcases (22experimentalanimalsanalyzed).Apairofanimalswas excludedduetolowerlimbblockadeafterLAinjection, pos-sibly by injection site error, which prevented the animal fromwalkinginthetestingarea.
The environmental conditions of temperature and humidity remained constant throughout the experiment. Temperatureremainedsteady,maintainedat22◦C,and dur-ingthe study noanimal showedsigns of heat stress, and thermogenicsweatingortremorswerenotobserved.
Therewasnostatisticallysignificantdifferencebetween both groups regarding age and sex, as well as weight (p=0.930902).TherewasnomortalityinGroupSandnine animalsdiedinGroupR.Theremainingtwoanimalsevolved withsignsof cyanosisinmucousmembranesand extremi-tiesandsignsofrespiratoryfailure,andweresubsequently sacrificedbydeepinhalationanesthesia.
Experimentswereanalyzedandexperimentaltimepoints wereobserved.Therespectivethermogramsperformed in eachexperimentandtheircorrespondingdatasheetswere derived fromthe thermal database. Thermographic study included the selection of areas of interest (head, body, andtail)byselectingcomputergraphicsellipsesresources thatsurroundedthehighlighted areaintheimage. Subse-quently,the selectedareas wereautomatically converted into numerical spreadsheets in CSV file format, which allowedobtainingvariousdata,suchasmaximum tempera-ture,averagetemperature,standarddeviation,colorimetric scale,sumoftemperature areas,emissivity,distance,hot andcoldspots,location,size,andpixels.
Forthermodynamic study,the values of maximum and averagetemperaturesoftheanimal’sheadandbodywere recordedforbothgroupsatbaselineandexperimentaltime points.
Data used for obtaining the results presented were collectedfromthequalitativeanalysis(clinical)and quan-titativeanalysis(thermal).
Baselineobservation
Figure1showstheanimalinitsphysiologicalstateandthe
autonomicnervoussystem(ANS)preserved.
Figure1 Initialbaselinethermogramofoneexperiment.
Experimentalobservation
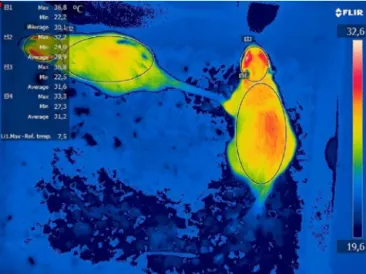
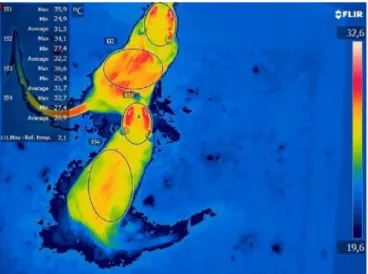
InGroupRthereweresignsofthermaldysautonomia(TD) predictive of clinical signs of intoxication. At the initial experimental time, immediately after receiving the LA injections,signsofmorphologicalthermalchangescouldbe seen intheanimal’sdorsum(peripheralcompartment),as showninthethermograms(Figs.2and3).
Inthe poisoned animal, itwas observedthat the head (central compartment) and dorsum (peripheral compart-ment) maximum temperatures were similar (centrifugal effect).Microcirculatoryandthermalchangesshowedsigns ofbloodcongestion andincreasedtemperatureinthe ani-mal’s tail,subsequently confirmed by autopsy.During the maximum intensification of poisoning signs, the observed pathophysiological modes showed TD signs in central and peripheralcompartments(Figs.4---6).
Thermographyidentifiedsignsofthermal dysautonomia inthepoisonedanimals’tails.Clinicalobservation corrobo-ratedthesefindings,asitevidencedpurplishtailswithsigns ofcongestionduetovasodilation.Asubsequentautopsy con-firmedthebloodcongestioninthehistologicalsections.
Figure3 Initialexperimentalthermogramofoneexperiment.
Figure4 Experimentalthermogram: thermaldysautonomia inthehead,dorsum,andtail.
Figure5 Experimentalthermogram:thermaldysautonomias inthelowerlimb.
Figure6 Experimentalthermogram:thermaldysautonomias inthetail.
TMAX_STR
6.2
5.6
5.0
4.4
3.8
3.2
2.6
Maximum temperature difference head and body
Stress = received saline
Baseline Experimental
±Std. Dev. ±Std. Err. Mean
Figure7 MaximumTofGroupS:baseline×experimental.
Resultsofintragroupstatisticalanalysis:GroupS
The resultof intragroup analysis showedno differencein maximumandaverageTinGroup Sat theexperimental timepointcomparedtobaseline(Figs.7and8).
Resultsofintragroupstatisticalanalysis:GroupR
TherewasnodifferenceinmaximumTinGroupRatthe experimentaltimepointcomparedtobaseline(Fig.9).
InGroup R,therewasdifferencein theaverage Tat experimentaltimepointcomparedtobaselineand statisti-callysignificant differenceregarding theanimals’average temperatureofheadanddorsum(p=0.004266)*(Fig.10).
Resultsofintergroupstatisticalanalysisatbaseline
0.6
0.2
–0.2
–0.6
–1.0
–1.4
–1.8
–2.2
Baseline Experimental Stress
Stress = received intraperitoneal injection of saline
Average temperature difference of head
and dorsum
±Std. Dev. ±Std. Err. Mean
Figure8 AverageTofGroupS:baseline×experimental.
Maximum temperature difference between head and dorsum
5.0
4.5
4.0
3.5
3.0
2.5
2.0
1.5
1.0
TMAX_ropivacaine
Baseline Experimental
Poisoning
±Std. Dev. ±Std. Err. Mean
Figure9 MaximumTofGroupR:baseline×experimental.
1.0
Average temperature of the body except the head
Ropivacaine
0.5
0.0 –0.5
–1.0
–1.5 –2.0
–2.5
–3.0
–3.5
Baseline
Poisoning
Experimental
±Std. Dev. ±Std. Err. Mean
Figure10 AverageTofGroupR:baseline×experimental.
Resultsofintergroupstatisticalanalysisat experimentaltime
TherewasdifferenceinmaximumandaverageTbetween SandRgroupsattheinitialexperimentaltimecomparedto baseline.
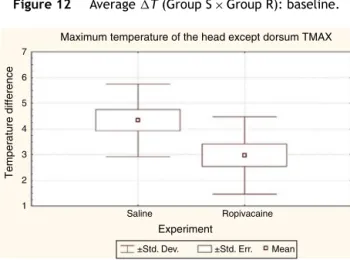
The analysis results showed that there was statistical significancebetweenthedifferencesin theheadand dor-sum maximum and average temperatures of the animals’ in Group R compared to animals’ in Group S, at experi-mentaltime.MaximumT(p=0.040232)*andaverageT
(p=0.021741)*(Figs.13and14).
Categorized plot for variable: baseline 6.0
5.5
5.0 4.5
4.0
3.5
2.5 2.0
1.5
Saline
Groups assigned to experiment
Maximum temperature difference between
head and dorsum
±Std. Err. ±Std. Dev. Mean
Ropivacaine 3.0
Figure11 MaximumT(GroupS×GroupR):baseline.
Moment baseline
Average temperature difference of
head and dorsum
0.6
0.2
–0.2
–0.6
–1.0
–1.4
–1.8
Saline
±Std. Dev. ±Std. Err. Mean
Groups assigned to experiment
Ropivacaine
Figure12 AverageT(GroupS×GroupR):baseline.
7
6
5
Temperature difference
Maximum temperature of the head except dorsum TMAX
4
3
Saline
±Std. Dev. ±Std. Err. Mean
Experiment
Ropivacaine 2
1
Figure13 MaximumT(GroupS×GroupR):experimental.
Autopsyresults
Macroscopic evaluation showed no signs of visceral dam-agebypuncture,anditwasfoundthatallinjectionswere intraperitoneal.Inpoisonedanimals,therewerewidespread signsofbloodcongestion,mainlyintheliver.InGroupS,no visceralsignsofbloodcongestionwerefoundintheanimals autopsied.
Discussion
0.5
0.0
–0.5
Average temperature difference
Average temperature difference of head and dorsum
–1.0
–1.5
–2.0
–2.5
–3.0
–3.5
Saline
Experiment
±Std. Dev. ±Std. Err. Mean
Ropivacaine
Figure14 AverageT(GroupS×GroupR):experimental.
ofvasomotorstateisessentialtounderstandthephysiology andpathophysiologyofdruginteractionsandacuteLA poi-soning.This understanding contributestoimproveclinical managementofaccidentalcaseswiththesedrugsandobtain furtherinformationasadditionalparametersfor decision-makingincriticalmomentsofadvancedlifesupport.
Whenthethermalbehaviorofananimalisstudied,the basic technicalcriteriaforusinghighprecision equipment shouldbeconsidered,thecorrectandcurrentnomenclature should be adopt, proper preparationand management of experimental animalsshould bedeveloped, andadequate control of thermal variables and atmospheric phenomena inthe researchlaboratory shouldbeperformed. Allthese criteriawereobservedandappliedstrictly.
The relationship between the causes and effects of severe acute cases of intraperitoneal LA poisoning was demonstratedinthisexperimentalstudy,asof the11 ani-malsinGroupR,ninediedimmediatelyafterreceivingthe drug injection and the other two that had brief survival developedseveresignsofrespiratoryfailureandunderwent euthanasia.
IRviewprovidedtheimagerecognitionofthe physiolog-icalstateandalsoofpathophysiologicalchangescausedby poisoning. As a result of this complication, characteristic changes wereregistered inthe thermal image,consisting of anomalies compared to the animal’s baseline thermal image. These thermal changes or signsof thermal dysau-tonomia could be seen before the occurrence of clinical signs.Tomathematicallyconfirmthesevisualmorphological changesinthermal imaging,calculationswereperformed. Asdescribedinthethermodynamicmodel,theheattransfer rate is determined by the animal’s mass product, multi-plied by the specific heat, multiplied by the initial and final temperature difference, divided by the experiment timeinterval. Foranalysis purposes, it wasassumed that theanimal specific heatis constant,theexperiment time interval,asdetermined bythe baselineandexperimental timesandthefactthatthetestsarepaired;thatis,each animal pairedwithhisowncontrol.Therewereno statis-tically significantdifferences intheweightofthe animals between the groups. Thus, the heat transfer rate can be determinedbythedifferenceofinitialandfinal tempera-turesbetweenthecompartmentsofinterestforthestudy. For objective demonstration purposes, the differences in
maximumandaveragetemperaturesoftheheadandbody wereassessed.
Intragroupcomparisonateachtimepoint(baselineand experimental)wasperformed,eachcaseservedasitsown referentialcontrol.Subsequently,intergroupcomparisonat thebaselinetimepointwasperformed.Afterwards, inter-groupcomparisonwasperformedattheexperimentaltime point,comparingthemicrocirculatoryandthermalchanges in poisoned animals with those that received the same volume of saline, to mitigate the analysis of differences regarding the surgical stress caused in experimental ani-mals.
The results of baseline assessmentsshowed that there werenodifferenceinmaximumandaveragetemperatures andin any of the cases; allanimals showed physiological thermaldistributionandnothermalchangetojustify exclu-sion from the experiment. To minimize the influence of thesurgicaltraumaandtheendocrine-metabolicresponses associated,it wasdecided to submit the animals in con-troltosaline solutioninjection.Theanalysisof thegroup subjectedtosalineinjectionshowednodifferencebetween themaximum and average temperatures of thehead and body.
Thebaselineinfraredanalysisrepresentsthephysiology ofmicrocirculationandassociatedvasomotor phenomena, in addition to muscle, organs and tissue production, which are autonomically controlled by the central ner-voussystem(CNS).Baselinethermogramshowedtheintact, unchanged autonomic nervous system image, performing the homeothermic control by maintaining the vasomotor toneconstriction.Thisimportantfunctionperformedbythe ANSenablesthethermal distributionmaintenanceinbody compartments,aredistribution phenomenonof bodyheat thathasthermalgradientindescendingorder,fromwarmer tocooler,fromthebody’scentertoperiphery.13Inbaseline
thermogramitwasalsoobservedacraniocaudal physiolog-icalpatternofthermaldistributionfromwarmertocooler, fromtheheadtothetail.Inthethermographicanalysis,it waspossibletocompareusingtheisothermalmethod(lines ofconstant temperature),which also confirmedthe ther-maldistributionmorphology indescendingorderfromthe headtothebody.So,thisthermaldistributiontheoryinthe craniocaudaldirectionwasfollowed.
The thermograms analysis results showed that, imme-diatelyafter LA injection (Group R), at the beginning of theexperimental time, itwas possible todetermine that there was statistically significant difference in average temperaturebetween theanimal’s head andbody. Imme-diately after drug injection, it was possible to calculate mathematical differences between the physiological and changedstates, which demonstratedobjectively and pre-dictively the clinical signs of the drug acute poisoning. Thesedifferenceswereobservedqualitativelyand morpho-logically by infrared, through the perception of thermal changesmanifestedbyhyper-radiationareasand quantita-tivelyconfirmedbystratificationofstatisticalmathematical results.
ANS image with obvious morphological differences from baseline thermogram of the same animal. Clinical obser-vationcorroboratedthesefindings,evidencingpurplepaws andtailswithsignsofcongestion duetovasodilation. The subsequentautopsyconfirmedbloodcongestion.
The thermal changes were described in this study as thermal dysautonomia (TD), characterized by areas of hyper-radiationcaused bymicrocirculationdisorders man-ifestedby vasomotor effect(vasodilation), resulting from ANSdisorderscausedbyneurotoxicityand,havingas con-sequences, changes in heat transfer rate between body compartments.
NeurotoxicityisthefirstmanifestationofLApoisoning; thus,itisexpectedthattheuseofIRmonitoringassociated withtheuseofanestheticdrugsmaycontributetothe pre-dictiverecognition of TD signs and preventcomplications resulting from drug poisoning and its deleterious conse-quences. Such ‘‘thermal aberrations’’’ may be explained by the direct neurotoxic action and effects of LA cere-bralcirculation afterthedrug systemicabsorption,which intraperitoneallytakesplaceintheportocavalsystem.
Possibledrug interactions or cases of LACNS intoxica-tionmaycausethermalchangesresultingfromdisturbances inthevasomotorstatemicrocirculationandimpaired auto-nomiccontroloftemperature.Therefore,themathematical results obtained from the IR images have confirmed the existence of morphological changesobserved in the ther-malimagerandpredictivelydemonstratedtheoccurrenceof thermaldysautonomiaresultingfromtheanesthetic intoxi-cation.
Currentthermographicsystemsfeatureeasyhandlingand severalautocompletefeatures, automaticauxiliarymodes that reduce error margins withseveral variables, such as distance, emissivity,humidity, andtemperature. IR moni-toringhasnopractical andtheoreticallimitations,asitis a practical noninvasive method, with low cost compared tosupplementarymonitoring,whichwillresultinincreased safetyinsurgeryandtechnologicalinnovationsinpain con-trolmanagementandpostoperativerecovery.Itcanbeused inclinicalpracticeforbaselineIRmonitoringofpatientsat restbeforetheprocedureandthencompareitwiththe mon-itoringduringsurgeryandpost-anesthesiacareunit(PACU) stay.
Surgical monitoring techniques greatly evolved; in the last decades, monitoring devices such as the bispectral index (BIS), capnography, electronic gas analyzers, and neuromuscular transmission monitoring have been devel-oped.Severalimportantaccessoryparametersthatallowed improved management, better differential diagnosis, and increased safety in surgery. BIS monitoring is a neuro-physiological monitoring system that constantly analyzes electroencephalogram to determine the level of aware-nessofpatientsundergoinggeneralanesthesia.Thepresent study propositionfound convergencewith the mathemat-ical model proposed by the computerized system, which converts the EEG signalsinto a number from 0 to 100 in BISmonitor.Considering that,asseveralstudiesusingthe IRsoughttheformulationofthermographicscoresfor nor-malization of temperature readings, the predictive value analysisalsooffersthepossibilityofdevelopingascoreor dimensionlesscalculationtodeterminethermalmonitoring parameters.
Duetoitsnoninvasive analysiscapacity,thermographic systemsarepresentedasimportanttoolsforawiderangeof applicationareasinresearchesandindustrialdevelopment duetoitsreliabilityandaccuracy.IRisusedinareassuch asmicroelectronics,automotive andaerospaceindustries, mechanicalweartesting,plantandbiologyresearches,and materialsevaluation.
Inthemedicalfield,theuseofIRasamonitoringmethod is still meager. The use of this technologypresents ques-tioningofinterferenceintemperaturemeasurementdueto theinfluenceexertedbyenvironmentalconditionsandthe productionofheatbytheindividualorganismand interfer-encecausedbytheequipmentoperator.Overtime,various theorieshavebeenestablishedinanattempttoneutralize suchinterference in theresults, particularlythe develop-ment of a thermographic indexfor IRquantification (and thismethodwassubsequentlyusedinseveralstudies).14---16
OtherrelatedtheorieswereproposedforIRquantification, such as the measurement of heat transfer rate through thecorrelationofnormalandabnormalskinareas.17 Other
authorshavedevelopednormalizationmethodstoquantify IRby comparingthe pointsof differencebetween normal and abnormal tissue temperatures, the thermal informa-tion of each point were compared with the surrounding areas.18,19Themethodofdeterminingtheheattransferrate
usedinthisresearchhasfoundconvergencewiththemethod usedbytheseauthors,astheanalysisoftemperature dif-ferenceswasperformed.
Vargasetal.designedanimportantmethodforIR normal-izationbydeterminingthedimensionlesstemperature.They followedfor587daysthetreatmentevolutionofa 50-year-oldmalepatient,withleprosyformanyyearsandhepatitis C. The evaluated the concomitant medical treatment of both diseases.The standardizedIRresultsshowedsuccess inthetreatmentofleprosyfromday87,whiletheskin pig-mentationoccurredonlyatday182,subsequentlyconfirmed bybiopsyonday390.Theleprosytreatmentevaluationvia
IR was able to determine signs of skin injury healing 95 daysbeforetheclinicalpossibilityofseenthisevolution.20
Similartothepresentstudy,thermographicsignsof poison-ingwerealsoobservedpriortoitsclinicalmanifestations. Therefore,bothstudiesshowedconvergencesregardingthe thermographic predictivevalue. The predictive identifica-tion of LA poisoning signs may enable early treatment approaches,suchasoxygenadministration,maintenanceof airwaypatency,appropriateventilatorysupport,anduseof benzodiazepines.IRmonitoringmayalsoassistinthe diag-nosis of the dreaded and unexpected cases of malignant hyperthermia.
Several image processing studies have been performed.21---26 Other studies have been conducted to
develop a thermographic index to increase diagnostic accuracy.14,15,17---19,27,28
Themost currentmethods ofimage processingarethe automated targetrecognition(ATR), thresholdalgorithms, andartificialneuralnetworks(ANN),amongothers. Thermo-graphicevaluationofthermalasymmetrycanbedonewith imagesegmentation(thresholdalgorithms),feature extrac-tion(ANN),andpatternrecognitiontechniques(ATR).29ATR
or objectsthatfell onthesubway tracks.30 The drawback
of this method for IR normalization, as in LA poisoning assessment,istherequirementofareliable.Athermogram database of cases of acute poisoning, as the images are processedbasedontheimage databasefilescomparedto thenewassessedimage.Thisaspectmayhinderitsuseas thesolemethodofidentifyingthermographicchanged pat-terns.Incontrast,theartificialneuralnetworksuseasetof datatoproducethepatternrecognition.
Itis noteworthythatallthesefeaturesassociatedwith IR can contribute significantly to mitigate the techni-cal influence exerted by equipmentoperators experience and improve diagnostic accuracy. Therefore, it is con-cludedthatIRapplicationinacuteLApoisoningmonitoring demonstrated its predictive value. In clinical practice, frequent IR monitoring may enable the physician the ‘‘recognition familiarity of normal thermographic image’’ and its ‘‘differentiation from morphologically altered images’’, whichcan beconfirmed bythe resultsof math-ematicalcalculationsofmeasuredtemperaturereadings.
Thedevelopmentofathermographicpredictiveindexfor LAacutepoisoning ispresented asa newhorizonfor fur-ther studies. It can enable the developmentof ‘‘thermal warnings’’scheduledfromtheanalysisoftemperature dif-ferencesbyisothermalfeature(linesofequaltemperature) and decreasethe influence of equipmenthandling by the operator,whichfacilitatespracticalapplicationofinfrared monitoringinsurgery.
Conflicts
of
interest
Theauthorsdeclarenoconflictsofinterest.
Acknowledgements
ToallcollaboratorsandtheCNPq/Capes(ConselhoNacional deDesenvolvimento Científico eTecnológico/Coordenac¸ão deAperfeic¸oamentodePessoaldeNível Superior)support forthedevelopmentofthisresearch.
References
1.Thornton PC, Buggy DJ. Local anaesthetic wound infusion for acutepostoperativepain: a viable option?Br JAnaesth. 2011;107:656---8.
2.Boddy AP, Mehta S, Rhodes M. The effect of intraperi-toneal local anesthesia in laparoscopic cholecystectomy: a systematicreviewandmeta-analysis.AnesthAnalg.2006;103: 682---6.
3.Ingelmo PM, Bucciero M, Somiani M, et al. Intraperi-toneal nebulization of ropivacaine for pain control after laparoscopic cholecystectomy: a double-blind, randomized, placebo-controlledtrial.BrJAnaesth.2013;110:800---6.
4.BisgaardT,KlarskovB,KristiansenVB,etal.Multi-regionallocal anestheticinfiltrationduringlaparoscopiccholecystectomyin patientsreceivingprophylacticmulti-modalanalgesia:a ran-domized, double-blinded, placebo-controlled study. Anesth Analg.1999;89:1017---24.
5.KehletH,GrayAW,BonnetF,etal.Aprocedure-specific system-aticreviewandconsensusrecommendationsforpostoperative
analgesiafollowinglaparoscopiccholecystectomy.SurgEndosc. 2005;19:1396---415.
6.Gupta A.Local anaesthesiafor painreliefafterlaparoscopic cholecystectomy: a systematic review. Best Pract Res Clin Anaesthesiol.2005;19:275---92.
7.Alkhamesi NA, Peck DH, Lomax D, et al. Intraperitoneal aerosolization of bupivacaine reduces postoperative pain in laparoscopic surgery: a randomized prospective controlled double-blindedclinicaltrial.SurgEndosc.2007;21:602---6.
8.GreibN,SchlotterbeckH,DowWA,etal.Anevaluationofgas humidifyingdevicesasameansofintraperitoneallocal anes-theticadministration for laparoscopicsurgery. AnesthAnalg. 2008;107:549---51.
9.SimonettiMPB,FerreiraFMC.Doestheisomerofbupivacaine contributetotheimprovementofefficacyinneuralblock?Reg AnesthPainMed.1999;24:43.
10.CovinoBG.Onehundredyearsplustwoofregionalanesthesian: annualscientificmeetingoftheAmericanSocietyofRegional Anesthesia;1986.p.11.
11.COBEA, Lei n.◦ 6638 de 08 de maio de 1979: http://www.
meusite.com.br/COBEA/etica.htm[accessed30.06.11]. 12.DeJongRH, BoninJD.Deaths from localanesthetic-induced
convulsionsinmice.AnesthAnalg.1980;59:401---5.
13.Sessler DI. Temperature regulation and monitoring: Miller’s anesthesia,vol.48,7thed.Philadelphia:ChurchilLivingstone; 2010.p.1533---56.
14.Collins AJ, Ring EFJ,Cosh J.Á.,et al. Quantitation of ther-mography in arthritis using multi-isothermal analysis: I.The thermographicindex.AnnRheumDis.1974;33:113---5.
15.RingEFJ,CollinsAJ,BaconPA,etal.Quantitationof thermo-graphyinarthritisusingmulti-isothermalanalysis:II.Effectof nonsteroidalantiinflammatory therapy on thethermographic index.AnnRheumDis.1974:33---53.
16.CollinsAJ.Anti-inflammatorydrugassessmentbythe thermo-graphicindex.ActaThermogr.1976;2:73---9.
17.SalisburyRS,ParrG,DeSilvaM,etal.Heatdistributionover nor-maland abnormaljoints:thermalpatternandquantification. AnnRheumDis.1983;42:494---9.
18.Warashina H, HasegawaY, TsuchiyaH, et al. Clinical, radio-graphic,andthermographicassessmentofosteoarthritisinthe kneejoints.AnnRheumDis.2002;61:852---4.
19.Yahara T, Koga T, Yoshida S, et al. Relationship between microvesseldensityandthermographichotareasinbreast can-cer.SurgToday.2003;33:243---8.
20.VargasJVC, BrioschiML,DiasFG,etal.Normalized method-ology for medical infrared imaging. Infrared Phys Technol. 2009;52:42---7.
21.Meyer F. Iterative image transformations for an auto-matic screening of cervical cancer. J Histochem Cytochem. 1979;27:128---35.
22.GiardinaCR,DoughertyER.Morphologicalmethodsinimageand signalprocessing,EnglewoodCliffs;1988.p.321.
23.Gonzalez RC, Woods RE. Digital image processing. Reading: Addison-Wesley;1992.p.716.
24.HeijmansHJAM. Morphological image operators:advancesin electronicsandelectronphysics.Boston:AcademicPress;1994.
25.RussJC.Theimageprocessinghandbook.2nded.BocaRaton: CRCPress;1995.
26.CastlemanKR.Digitalimageprocessing.2nded.Prentice-Hall: NewJersey,EnglewoodCliffs;1996.
27.InoueK,NishiokaJ,KoboriT,etal.Theuseofthermography in the assessment of the rheumatoid knee: the thermo-graphic index and the heat distribution index. Ryumachi. 1990;30:356---61.
29.BrioschiML.Metodologiadenormalizac¸ãodeanálisedocampo detemperaturasemimageminfravermelhahumana. Curitiba-PR:Tesededoutoradoemengenhariamecânica.Universidade FederaldoParaná;2011.