ISSN 1546-9239
© 2009 Science Publications
Corresponding Author: J.C. Akan, Department of Chemistry, Faculty of Science, University of Maiduguri, P.M.B 1069, Maiduguri, Borno state, Nigeria Tel: +2348036000506
Heavy Metals and Anion Levels in Some Samples of Vegetable Grown Within the
Vicinity of Challawa Industrial Area, Kano State, Nigeria
1J.C. Akan, 1F.I. Abdulrahman, 1V.O. Ogugbuaja and 2J.T. Ayodele 1Department of Chemistry, Faculty of Science, University of Maiduguri,
P.M.B 1069, Maiduguri, Borno State, Nigeria
2Department of Chemistry, Bayero University, Kano state, Nigeria
Abstract: Problem section: Effluents from the surrounding industries such as tannery and textile are used by vegetable farmers for the irrigation of their crops. These effluents may contain some toxic metals which bioaccumulate along the food chain. Moreover the uptake of such toxic metals by crops is governed by their availability and concentration in the soil. Therefore such crops may accumulate heavy metals in excessive amount in their various parts. This may ultimately, adversely affect humans and other species that depend on such crops for food, hence the need to evaluate the pollutant levels in vegetables samples in these areas.
Approach: Six vegetable samples of various organs were freshly harvested from ten farms within the vicinity of Challawa industrial areas. The concentration of heavy metals which include, Cu, Zn, Co, Mn, Mg, Fe, Cr, Cd As, Ni and Pb, were determined using Perkin-Elmer analyst 300 Atomic Absorption Spectroscopy (AAS). Levels of some anions (nitrate, nitrite, sulphate and phosphate were determined using Hach direct reading 2000 Spectrophotometer. Results: The results obtained from this analysis revealed that Cr and Fe shows the highest concentrations, while As shows the lowest levels in the whole vegetable organs studied. The concentrations of the anions ranged between 40.00-1300.00 µg g−1 nitrite, 65-1500 µg g−1 nitrate, 122.00-765.00µg g−1 and 12.00-60.00 µg g−1. The leaves contained much higher concentrations of heavy metals and anions than roots and stems. Conclusions: The concentrations of the above parameters were higher than the FAO, WHO/EU and FAO/WHO allowed limit. The high values might be attributed to the used of untreated effluents from textile and tanneries industries by farmers for the irrigation of these vegetables. Thus, the high values of these trace metals and anions in the vegetable samples could put the consumers of these vegetables at health risk. Further works should be carried out in the soil samples were the vegetables are grown.
Key words: Heavy metals, anions, vegetables, challawa industrial area, kano state
INTRODUCTION
The consumption of vegetables and fruits as food offer rapid and least means of providing adequate vitamins supplies, minerals and fibre. In these areas of study, vegetables used as food include those used in making soups or served as integral parts of the main sources of a meal[1]. Each plants species has its nutritive requirements differing from others. Thus different plants supported by identical solutions will contain varying concentrations of minor and macro elements. Application of industrial effluent decreases the budding and growth rate of vegetables[1]. Leafy vegetables occupy a very important place in the human diet, but unfortunately constitute a group of foods which contributes maximally to nitrate and other anions as well as heavy metals consumption. The excessive application of nitrogen and other inorganic fertilizers
and organic manures to these vegetables can accumulate high levels of nitrate and other anions as well as heavy metals. Consequently their consumption by humans and animals can pose serious health hazards. Although some heavy metals such as Cu, Zn, Mn and Fe are essential in plant nutrition, many of them do not play any significant role in the plant physiology. The uptake of these heavy metals by plants especially leafy vegetables is an avenue of their entry into the human food chain with harmful effects on health[1].
the provision of fertilizers, herbicides, pesticides and modern farm equipments to boost both dry and rainy seasons farming of food and vegetable crops production[2].
While efforts are being consolidated by the government towards improving and increasing food and vegetable crops production, the problem of industrial effluents into water bodies is undermining these efforts, especially in Kano where tannery and textile effluents are discharged into drain which is used for the irrigation of vegetable crops during the dry season farming. Mineral elements are known to be essential in our diet and may enter the food crops or vegetables from soil through mineralilzation by crops, food processing or environmental contamination[3,4]. Many researchers have reported trace metals like As, Cr, Cu, Fe, Pb and Zn as components in tannery effluents[2,5,6].
Kano city in northern Nigeria (Lat: N 1159° 981', Long: E 008° 31.491') is home to (70%) of Nigerians tanneries. Most of the tannery industries in Kano are in Challawa Industrial Estate. Consequently, the amount of pollutants and wastes generated by the tanning industries pose significant effect on the vegetable crops grown on the Challawa river bank. Since the polluted effluent is used for irrigation to water the vegetable crops along the river bank, trace metals and anions may enter the food chain through irrigated crops thereby exposing consumers of these vegetable crops to bioaccumulation of trace metals and anions with time. Thus, the need to carry out extensive screening on the vegetables grown in the vicinity of the Challawa river in order to have a comprehensive report on the impact of tannery operations in the area. It was in this regard, that vegetables which are some of the crops grown for commercial purposes were screened in order to assess the level of trace metals and some anions.
MATERIALS AND METHODS
Sample area and sampling: Vegetable samples such as spinach (Amaranthus caudatus), carrot (Daucus carota), lettuce (Lactuca sativa), cabbage (Brassica oleracea), tomato (Lycopersicon sculenetum)and onion
(Allium cepa) irrigated from the Challawa river bank were freshly harvested from ten farms sites and packaged into labelled paper bags and transported to the laboratory awaiting analysis. The vegetable samples were collected for a period of one year, represent the dry and rainy season and divided into root, stem and leaf.
Sample preparation and digestion for heavy metals determination: The vegetables samples were weighed
to determine the fresh weight and dried in an oven at 80°C for 72 h to determine their dry weight. The dry samples were crushed in a mortar and the resulting powder digested by weighing 0.5 g of oven-dried ground and sieve (<1 mm) into an acid-washed porcelain crucible and placed in a muffle furnace for four hours at 500°C. The crucibles were removed from the furnace and cooled. 10 mL of 6 M HCl was added covered and heated on a steam bath for 15 min. Another 1 mL of HNO3 was added and evaporated to dryness by continuous heating for one h to dehydrate silica and completely digest organic compounds. Finally, 5 mL of 6 M HCl and 10ml of water were added and the mixture was heated on a steam bath to complete dissolution. The mixture was cooled and filtered through a Whatman no. 541 filter paper into a 50ml volumetric flask and made up to mark with distilled water.
Elemental analysis of samples: Determination of Cu, Zn, Co, Mn, Mg, Fe, Cr, Cd As, Ni and Pb were made directly on each final solution using Perkin-Elmer Analyst 300 Atomic Absorption Spectroscopy.
Determination of nitrate, nitrite, sulphate and phosphate in the vegetable samples
Determination of nitrate and nitrite: The
concentration of nitrate and nitrite analyzed in each of the vegetable samples were carried out using smart spectro Spectrophotometer (LaMotte 2000). Vegetable samples solutions were prepared by chopping each sample into smaller sizes. A known amount (1 g) of the chopped sample was transferred into 100 mL flask and soaked with 50 mL of distilled water. The flask was capped and shaken for 30 min, then filtered into another 100ml volumetric flask and the volume made to the mark with distilled water[7] Nitrate was determined spectrophotometrically using standard cadmium reduction method 3649-SC (Lamotte, 2000) while Nitrite was determined using standard diazotization method 3650-SC (Lamotte, 2000).
Ten mL of 6 M HCl were then added to each of the crucible and covered, then heated on a steam bath for 15 min. The contents of each crucible were completely transferred into different evaporating basins and 1 ml of concentrated HNO3 was added. The heating was made to continue for 1 h to dehydrate silica. One mL of 6 M HCl was then added, swirled and then followed by the addition of 10 mL-distilled water and again heated on the steam bath to complete dissolution. The contents of the evaporating basins were cooled and then filtered through a Whatman No. 1 filter paper into 50 mL volumetric flasks and the volumes made up to the marks with distilled water[7]. Phosphate was determined using hach direct reading 2000 spectrophotometer.
Determination of sulphate: For sulphate
determination, 5 mL of magnesium nitrate solutions were added to each of the ground and sieved samples in the crucibles. These were then heated to 180°C on a hot plate. The heating process was allowed to continue until the colour of the samples changed from brown to yellow[8]. The samples were then transferred to the furnace at a temperature of 500°C for four hours. Magnesium nitrate was added to prevent loss of sulphur. The contents of each crucible were carefully transferred to different evaporating basins. 10 mL of concentrated HCl were added to each of them and covered with watch glasses. They were boiled on a steam bath for 3 min. On cooling, 10 mL of distilled water were added to each of the basins and the contents of each were filtered into 50 mL volumetric flasks and the volumes made up to the marks with distilled water[7]. Sulphate was determined using smart spectro spectrophotometer (2000).
RESULTS
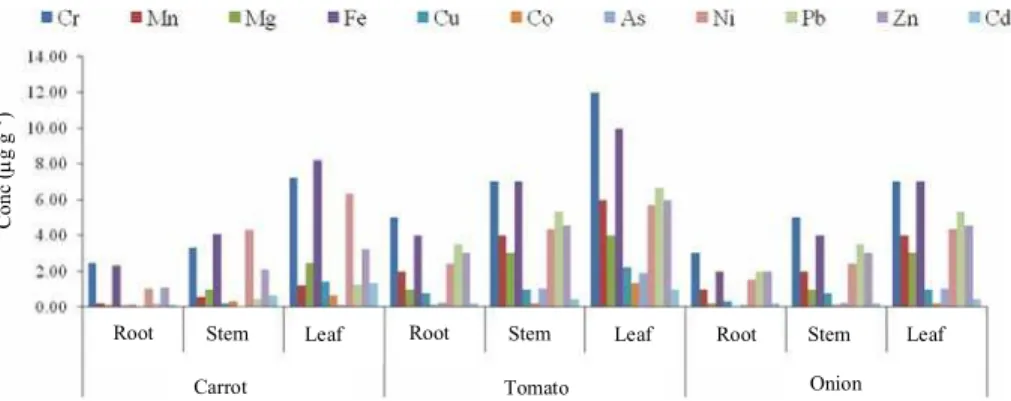
The concentrations of heavy metals in different parts of vegetable samples are presented in Fig. 1a and b. The concentrations of heavy metals in different parts of carrot ranged from 3.66-9.23 µg g−1 Cr, 0.54-2.33 µg g−1 Mn, .00-4.22 µg g−1 Mg, 4.00-14.00 µg g−1 Fe, 0.32-2.00 µg g−1 Cu, 0.23-01.25 µg g−1 Co, 0.11-0.34 µg g−1 As, 2.00-7.44 µg g−1 Ni, 0.32-2.00 µg g−1 Pb, 2.00-4.00 µg g−1 Zn, 0.11-1.66 µg g−1 Cd for spinach. 1.00-5.00 µg g−1 Cr, 0.61-3.00 µg g−1 Mn, 0.22-3.12 µg g−1 Mg, 2.00-5.00 µg g−1 Fe, 0.02-2.00 µg g−1 Cu, 0.11-0.43 µg g−1 Co, 0.33-4.00 µg g−1 As, 1.00-4.06 µg g−1 Ni, 0.03-1.00 µg g−1 Pb, 2.00-o 4.00 µg g−1 Zn, 0.11-2.00 µg g−1
Cd for lettuce, 0.21-3.22 µg g−1 Cr, 1.54-2.43 µg g−1 Mn, 0.87-3.21 µg g−1 Mg, 1.22-4.33 µg g−1 Fe, 0.12-0.66 µg g−1 Cu, 0.05-0.54 µg g−1 Co, 0.05-0.11 µg g−1 As, 2.00-5.33 µg g−1 Ni, 0.54-2.11 µg g−1 Pb, 0.33-3.11 µg g−1 Zn, 0.01-0.44 µg g−1 Cd for cabbage Fig. 1a 2.44-0 7.22 µg g−1 Cr, 0.22-1.22 µg g−1 Mn, 0.12-2.44 µg g−1 Mg, 2.33-8.23 µg g−1 Fe, 0.22-1.42 µg g−1 Cu, 0.11-0.63 µg g−1 Co, 0.02-0.11 µg g−1 As, 1.02-6.33 µg g−1 Ni, 0.22-1.23 µg g−1 Pb, 1.07-3.22 µg g−1 Zn, 0.11-1.34 µg g−1 Cd carrot.3.00-12.00 µg g−1 Cr, 1.00-6.00 µg g−1 Mn, 0.22-4.00 µg g−1 Mg, 2.00-10.00 µg g−1 Fe, 0.34-2.23 µg g−1 Cu, 0.03-1.33 µg g−1 Co, 0.12-1.87 µg g−1 As, 1.55-5.67 µg g−1 Ni, 2.00-6.66 µg g−1 Pb, 2.00-6.00 µg g−1 Zn, 0.22-1.00 µg g−1 Cd tomato. 3.00-7.00 µg g−1 Cr, 1.00-4.00 µg g−1 Mn, 0.22-3.00 µg g−1 Mg, 2.00-7.00 µg g−1 Fe, 0.34-1.00 µg g−1 Cu, 0.03-0.22 µg g−1 Co, 0.12-1.00 µg g−1 As, 1.55-4.33 µg g−1 Ni, 2.00-5.33 µg g−1 Pb, 2.00-4.55 µg g−1 Zn, 0.22-0.45 µg g−1 Cd onion Fig. 1b.
The mean metals concentrations in different parts of vegetable samples during the rainy season are as presented in Fig. 2a and b. The concentrations of heavy metals in the vegetable samples range between 0.21 -3.54 µg g−1 Cr, 0.20-1.34 µg g−1 Mn, 0.13-2.00 µg g−1 Mg, 0.56-6.45 µg g−1 Fe, 0.02-1.33 µg g−1 Cu, 0.20-0.57 µg g−1 Co, 0.01-2.00 µg g−1 As, 0.50-3.22 µg g−1 Ni, 0.01-1.01 µg g−1 Pb, 0.33-2.00 µg g−1 Zn, 0.01-1.00 µg g−1 Cd.
tomato (2.00-6.00 µg g−1) and the minimum in cabbage (0.33-3.11 µg g−1). Cadmium showed maximum concentration in lettuce (0.11-2.00 µg g−1) and the minimum in cabbage (0.01-0.44 µg g−1).
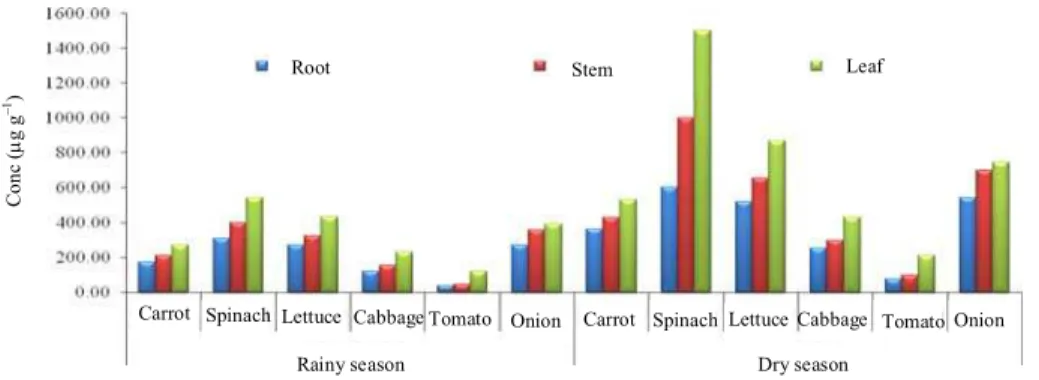
The mean concentrations of nitrate for all the organs of different vegetable samples in the dry and rainy seasons are presented in Fig. 2. The concentrations of nitrate ranged from 244.00-432.00 µg g−1 carrot, 500.00-1300.00 µg g−1 spinach, 444.00-765.00 µg g−1 lettuce, 232.00-377.00 µg g−1 cabbage, 40.00-133.00 µg g−1 tomato and 477.00-633.00 µg g−1 onion (dry season), while rainy season ranged from 174.00-237.00 µg g−1 carrot, 310.00-543.00 µg g−1 spinach, 273.00-436.00 µg g- lettuce, 123.00-231.00 µg g−1 cabbage, 38.00-121.00 µg g−1 tomato and 237.00-394.00 µg g−1 onion. Figure 4 show the concentrations of nitrite in vegetable samples in the dry and rainy seasons, which ranged from
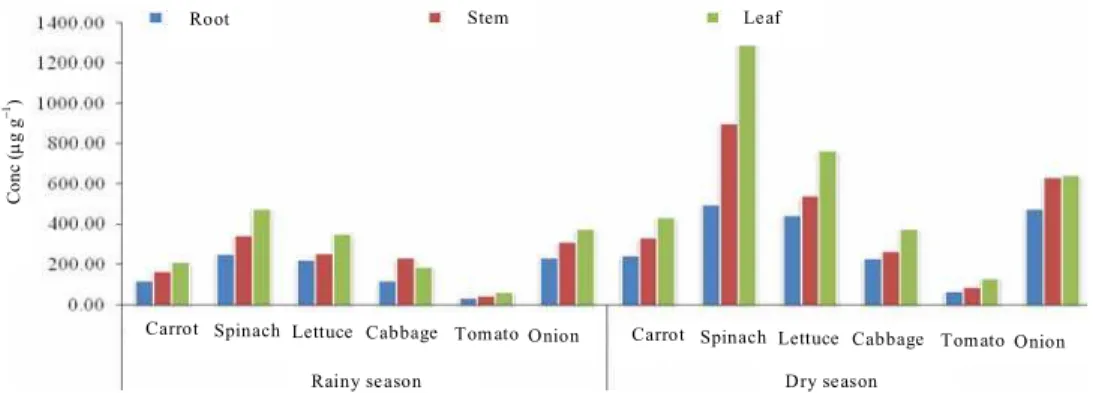
365.00-533.00 µg g−1 carrot, 600.00-1500.00 µg g−1 spinach, 522.00-867 µg g−1 lettuce, 256.00-433.00 µg g−1 cabbage, 65.00-211.00 µg g−1 tomato and 544.00-700.00 µg g−1 onion (dry season) and rainy season ranged from 122.00-212.00 µg g−1 carrot, 253.00-474.00 µg g−1 spinach, 222.00-352 µg g−1 lettuce, 121.00-187.00 µg g−1 cabbage, 33.00-63.00 µg g−1 tomato and 232.00-376.00 µg g−1 onion. For sulphate concentration (Fig. 5), carrot ranged from 412.00 to476.00 µg g−1, 743.00-1765.00 µg g−1 spinach, 588.00-900.00 µg g−1 lettuce, 311.00-511.00 µg g−1 cabbage, 122.00-344.00 µg g−1 tomato and 765.00-899 00 µg g−1 onion (dry season), while rainy season ranged from 206.00-293.00 µg g−1 carrot, 372.00-812.00 µg g−1 spinach, 253.00-456 µg g−1 lettuce, 156.00-253.00 µg g−1 cabbage, 112.00-156.00 µg g−1 tomato and 385.00-453.00 µg g−1 onion.
Co
n
c (
µ
g g
−
1)
Root Stem Leaf Root Stem Leaf Root Stem Leaf
Spinach Lettuce Cabbage
Fig. 1a: Trace element concentrations (µg g−1) in different parts of vegetable samples (Spinach, lettuce and cabbage) in dry season from kano industrial area
Root
C
onc (
µ
g g
−
1)
Root Leaf Stem Leaf
Stem Leaf Root Stem
Carrot Tomato Onion
Co
n
c (
µ
g g
−
1)
Root Root Stem Leaf Root Stem Leaf Stem Leaf Spinach Lettuce Cabbage
Fig. 2a: Mean metals concentrations (µg g−1) in different parts of vegetable samples (Spinach, lettuce and cabbage) in rainy season from kano industrial area
C
onc
(
µ
g g
−
1)
Root Root Stem Leaf Root Stem Leaf Stem Leaf Carrot Tomato Onion
Fig. 2b: Mean metals concentrations (µg g-1) in different parts of vegetable samples (Carrot, tomato and onion) in rainy season from kano industrial area
Carrot
Co
n
c (
µ
g g
−
1)
Root Stem Leaf
Cabbage Onion Spinach Lettuce
Spinach Lettuce Cabbage Tomato Carrot Tomato Onion Rainy season Dry season
C
onc
(
µ
g g
−
1)
Root Stem Le af
Carrot Spinach Lettuce Cabbage Tom ato Onion Carrot Spinach Lettuce Cabbage Tom ato Onion
Rainy se ason Dry se ason
Fig. 4: Seasonal variation of Nitrate concentrations (µg g-1) in different parts of vegetable samples from kano industrial area
R ai ny s e as o n D r y s e aso n
C ar r o t S pinac h L e ttuce C abb age To m ato O nio n C ar r o t S pi nac h L e ttuce C abb age To m ato O ni o n
Co
n
c
(
µ
g g
−
1)
R o ot S t e m L e af
Fig. 5: Seasonal variation of Sulphate concentrations (µg g-1) in different parts of vegetable samples from kano industrial area
Phosphate levels ranged from 42.00-80.00 µg g−1 carrot, 30.00-60.00 µg g−1 spinach, 22.00-80.00 µg g−1 lettuce, 30.00-55.00 µg g−1 cabbage, 12.00-45.00 µg g−1
tomato, 21.00-35.00 µg g−1 onion (dry season) and rainy season ranged from 42.00-80.00 µg g−1 carrot, 30.00-60.00 µg g−1 spinach, 22.00-80.00 µg g−1 lettuce,
30.00-55.00 µg g−1 cabbage, 23.00-45.00 µg g−1 tomato and 21.00-44.00 µg g−1 onion Fig. 6.
From Fig. 3, the maximum concentration of nitrate was found in spinach (543.00-1500.00 µg g−1) and the minimum in tomato (38.00-211.00 µg g−1). Nitrite had the maximum concentration in spinach (478.00-1300 µg g−1) and minimum in tomato (33.00-344.00 µg g−1) Fig. 4. Sulphate content was relatively higher in spinach (812.00-1765.00 µg g−1) while tomato shows the least values (112.00-344.00 µg g−1) Fig. 5. Phosphate showed the maximum concentrations in carrot (80.00-80.00 µg g−1) and the minimum concentrations in tomato (12.00-45.00 µg g−1) Fig. 6.
DISCUSSION
In the whole plants studied during the dry and rainy season, leaves contained higher concentrations of heavy metals than roots and stems. Similar study carried out by[9] shows that the heavy metal content of various parts of plant differs. They reported that in vegetables organs the concentrations of heavy metals are in the order of leaf> stem> root> tuber> bulb> fruit> seed. [10]
reported high level of heavy metals (Pb, Fe, Cu and Zn) in their study of the long term effects of municipal waste disposal on soil properties and productivity of sites used for urban agriculture in Abakaliki, South eastern part of Nigeria. [11] studied plant uptake of heavy metals on a similar site at University of Ife dump site and reported that Pb uptake by water leaf (Talinum triangulare), okra (Albennucus esculentus) increased in leaves and roots of water leaf and in the fruit of okra relative-those grown in the non-dump sites. Similar work by[12] reported that vegetables accumulate considerable amount of heavy metals especially Pb, Cr, Cu, Zn in roots and leaves.
The concentrations of heavy metals in all the vegetable organs in the dry season were higher than the rainy season. The high concentration of heavy metals in the dry season when compared with the rainy season might be due-the use of untreated effluents from textile and tanneries by farmers for the irrigation of these vegetables during the dry season[6,13]. The concentrations of heavy metals in all the vegetable samples in the dry and rainy season were higher than the FAO/WHO guideline values of 0.1-0.2 µg g−1 Cr, 0.3 µg g−1 Fe, 0.1 µg g−1 Pb, 0.1 µg g−1 Cu, 0.1 µg g−1 Zn, 0.1 µg g−1 Ni, 0.02 µg g−1 Cd and 0.3 µg g−1 Mn, with exception of Co in the rainy season. The presence of these metals in the vegetable samples during the rainy season might be due-some metal residues left behind in the dry season farming. The result of this
study agreed with the data reported by[14]. Results from present and earlier reports[15] demonstrated that plants grown on wastewater-irrigated soils are contaminated with heavy metals and pose health concern. Absorption and accumulation of heavy metals in plant tissues depend upon many factors. These include temperature, moisture, organic matter, pH and nutrient availability. The wastewater from tanneries and textile industries used for irrigation showed higher organic matter. The sites irrigated with textile and tanneries effluents also showed similar contamination levels for heavy metals, hence the high content of organic matter. Organic complexing molecules of Low Molecular Weight (LMW) serve as carriers of micronutrients[15]. Low Molecular Weight (LMW) has been shown-increase heavy metals uptake[16], while the presence of organic matter has been reported-increase the uptake of zinc, chromium, lead, iron and copper in the wheat plant[16].
The alkalinity range of soil is known-restrict the mobilization of heavy metals, thus reducing their uptake. However, the high nutrient input of irrigated water from these sites could contribute-the high uptake of heavy metals. The field data support this argument in that a higher uptake was recorded at the time when these vegetables were irrigated with textile and tanneries effluent as compared-the time when these effluents were not used. Long-term application of waste effluent is associated with increase in plant uptake and bioavailability of heavy metals[15]. In the present study many soil factors such as pH, organic matter, nitrogen bioavailability, soil moisture and temperature have interacted-impact on uptake.
The values of nitrate, nitrite, sulphate and phosphate in the vegetable samples show that the leaves are rich in this anion content than other organs studied. Similar study was carried out by [9] stated that nitrate and nitrite content of various parts of a plant differs in the order of leaf> stem> root> tuber> bulb> fruit> seed. [17]
the above observations. The concentrations of these anions were higher in the dry season when compared-rainy season. The high levels of these anions in the dry season is attributed-the used of untreated effluents from textile and tanneries by farmers for the irrigation of these vegetables, while the low concentrations of these anions during the rainy season are due-the fact that this effluent are not used for the irrigation of these vegetables. The concentrations of these anions in all the vegetable organs study during the dry season were higher than the limits set by WHO. Result of analysis of variance (ANOVA) showed that variation between vegetables and organs were statistically significant (p<0.05).
CONCLUSION
The results indicate that all the vegetable samples analyzed in this study had high levels of heavy metals and anions. Heavy metal levels were higher than those recommended by Food and Agricultural Organization (FAO) and the WHO/EU joint limits. The high levels of these heavy metals and anions place the consumers of these and other vegetable crops grown within vicinity of Challawa industrial area at health risk with time unless an urgent step is taken by relevant agencies-address this issue.
ACKNOWLEDGEMENT
I would like-acknowledge Mr. Fine Akawo for his laboratory assistance.
REFERENCES
1. Ihekeronye, A.I. and P.O. Ngoddy, 1985. Integral Food Science and Technology for the Tropics. 2nd Edn., Macmillian Education Ltd. Oxford and London, pp: 293.
2. Lawal, F.A. and K. Singh, 1981. Analytical studies of wastes water effluents on some tanneries of kano and sokoto states for possible environmental pollution. Bull.Chemical Soc. Nigeria, 6: 68-75. http://www.google.co.uk/search?hl=en&q=Lawal %2C+F.A.+and+K.+Singh%2C+1981.+Analytical +studies+of+wastes+water+effluents+on+some+ta nneries+of+kano+and+sokoto+states+for+possible +environmental+pollution.+Bull.Chemical+Soc.+ Nigeria%2C+6%3A+6875.&btnG=Google+Search &meta=
3. Onianwa, P.C., 2001. Copper and zinc contents of Nigeria foods and estimate of the adult-dietary intakes. Food Chem., 72: 89-95. http://cat.inist.fr/?aModele=afficheN&cpsidt=8614 36
4. Miller, N.J. 1996. Atomic absorption and atomic emission spectrometry for the determination of consumed in the united states. J. Food Composition Anal.,9: 310-311. Doi: 10.1006/Jfca.1996.9997 5. Lawal, F.A., 1986. Studies on major pollutants in
vegetable tannery wastewater. J. Leather Res., 4: 63-74.
http://www.google.co.uk/search?hl=en&q=vegetab le+tannery+wastewater.+J.+Leather+Res.%2C+4% 3A+63-74&btnG=Google+Search&meta=
6. Yisa, J., 2004. Tannery effluents analysis for challawa industrial estate, Nigeria. In: 16th Annual Conference of International Association of Nigerian Studies and Development, June 15-18, Held at Pioneer Hotel, Wuse, Zone 4, Abuja, Nigeria. pp: 1-28.
7. Radojevic, M. and V.N. Bashkin, 1999. Practical Environmental Analysis. The Royal Society of Chemistry, 2nd Edn., Cambridge, pp: 466.
8. Kenneth Helrich, 1990. Official Method of Analysis of AOAC. 5th Edn., AOAC Inc. Arlington USA
9. Santamaria, P., A. Elia, F. Serio and E. Todaro, 1999. A suevey of nitrate, metals and oxalate content in retail fresh vegetables. J. Sci. Food. Agric.,79:1882-1888.
http://www.google.co.uk/search?hl=en&q=Santam aria%2C+P.%2C+A.+Elia%2C+F.+Serio+and+E.+ Todaro%2C+1999.+A+suevey+of+nitrate%2C+me tals+and+oxalate+content+in+retail+fresh+vegetab les.+J.+Sci.+Food.+Agric.%2C+79%3A+1882-1888.&btnG=Google+Search&meta=
10. Anikwe, M.A.N. and K.C.A. Nwobodo, 2006. Long term effect of municipal waste disposal on soil properties and productivity of sites used for urban agriculture in Abakaliki, Nigeria. Bioresour. Technol.,83:241-251.
http://www.google.co.uk/search?hl=en&q=Anikwe %2C+M.A.N.+and+K.C.A.+Nwobodo%2C+2006. +Long+term+effect+of+municipal+waste+disposal +on+soil+properties+and+productivity+of+sites+u sed+for+urban+agriculture+in+Abakaliki%2C+Ni geria.+Bioresour.+Technol.%2C+83%3A+241-251.&btnG=Google+Search&meta=
11. Amusan, A.A., P.V. Ige and R. Olawala, 1999. Preliminary investigation on the use of municipal waste dump for farming. In: The 25th Annual Conference of Soil Science Society of Nigeria, Nov. 21-25, Benin City, Nigeria. pp: 1-34.
13. Audu, A.A. and A.O. Lawal, 2005. Variation in metal contents of plants in vegetable garden sites in kano metropolis. J. Applied Sci. Environ., 10:105-109.
http://www.google.co.uk/search?hl=en&q=Audu% 2C+A.A.+and+A.O.+Lawal%2C+2005.+Variation +in+metal+contents+of+plants+in+vegetable+gard en+sites+in+kano++++metropolis.++J.+++Applied
+++Sci.+++Environ.%2C+10%3A+105-109.&btnG=Google+Search&meta=
14. Kocak, S., O. Tokusoglu and S. Aycan, 2005. Some heavy metal and trace essential element detection in canned vegetable foodstuffs by differential pulse polarography (DPP). Electronic J. Environ. Agric. Food Chem., 4: 871-878. http://www.google.co.uk/search?hl=en&q=Kocak %2C+S.%2C+O.+Tokusoglu+and+S.+Aycan%2C +2005.+Some+heavy+metal+and+trace+essential+ element+detection+in+canned+vegetable+foodstuf fs+by+differential+pulse+polarography+%28DPP %29.+Electronic+J.+Environ.+Agric.+Food+Chem
.%2C+4%3A+871-878&btnG=Google+Search&meta=
15. Sharma, R.K., M. Agrawal and F. Marshall, 2007. Heavy metal contamination of soil and vegetables in suburban areas of Varanasi, India. Ecotoxicol. Environ. Safety. J., 66: 258-266. Doi: 10.1016/j.ecoenv.2005.11.007
16. Chen, Y. and T. Aviad, 1990. Effect of Humic Substances on Plant Growth. In: Humic Substances in Soil and Crop Sciences, America Society of Agronomy and Soil Science, Society of America, Madison,WI,pp:161-186.
http://www.google.co.uk/search?hl=en&q=Chen% 2C+Y.+and+T.+Aviad%2C+1990.+Effect+of+Hu mic+Substances+on+Plant+Growth.+In%3A+Hum ic+Substances+in+Soil+and+Crop+Sciences%2C+ America+Society+of+Agronomy+and+Soil+Scien ce%2C+Society+of+America%2C+Madison%2C+
WI%2C+pp%3A+161-186.&btnG=Google+Search&meta=
17. Zhou, Z.Y., M.J. Wang and J.S. Wang 2000. Nitrate and nitrite contamination in vegetables in china.Food.Rev.Int.,16:61-76.
http://www.google.co.uk/search?hl=en&q=Zhou% 2C+Z.Y.%2C+M.J.+Wang+and+J.S.+Wang+2000. +Nitrate+and+nitrite+contamination+in+vegetable s+in+china.+Food.+Rev.+Int.%2C+16%3A+61-76.&btnG=Google+Search&meta=
18. Maynard, D.N., A.V. Barker., Minotti and N.H. Peck, 1978. Nitrate accumulation in vegetables. J. Adva. Agro., 28: 71-118. http://www.google.co.uk/search?hl=en&q=Maynar d%2C++D.N.%2C++A.V.++Barker.%2C+++Mino tti+++and+N.H.+Peck%2C+1978.+Nitrate+accum ulation+in+vegetables.+J.+Adva.+Agro.%2C+28% 3A+71-118.&btnG=Google+Search&meta= 19. Aword, O.C., J.R. Hicks, P.O. Minotti and
C.Y. Lee, 1980. Effects of plant age and nitrogen fertilization on nitrate accumulation and postharvest nitrite accumulation in fresh spinach. J. Am.Soc.Hort.Sci.,105:18-20.