OSD
6, 491–524, 2009Sensors and instruments for
carbon measurements
U. Schuster et al.
Title Page
Abstract Introduction
Conclusions References
Tables Figures
◭ ◮
◭ ◮
Back Close
Full Screen / Esc
Printer-friendly Version
Interactive Discussion
Ocean Sci. Discuss., 6, 491–524, 2009 www.ocean-sci-discuss.net/6/491/2009/
© Author(s) 2009. This work is distributed under the Creative Commons Attribution 3.0 License.
Ocean Science Discussions
Papers published inOcean Science Discussionsare under
open-access review for the journalOcean Science
Sensors and instruments for oceanic
dissolved carbon measurements
U. Schuster1, A. Hannides2, L. Mintrop3, and A. K ¨ortzinger4
1
University of East Anglia, School of Environmental Sciences, Norwich, UK, NR4 7TJ, UK
2
Department of Fisheries and Marine Research, Ministry of Agriculture, Natural Resources and the Environment, Nicosia, Cyprus
3
MARIANDA, Marine Analytics and Data, Tulpenweg 28, Kiel, Germany
4
Leibniz Institute of Marine Sciences, Chemical Oceanography, Kiel, Germany
Received: 30 January 2009 – Accepted: 3 February 2009 – Published: 27 February 2009 Correspondence to: U. Schuster ([email protected])
OSD
6, 491–524, 2009Sensors and instruments for
carbon measurements
U. Schuster et al.
Title Page
Abstract Introduction
Conclusions References
Tables Figures
◭ ◮
◭ ◮
Back Close
Full Screen / Esc
Printer-friendly Version
Interactive Discussion
Abstract
Highly accurate and precise measurements of marine carbon components are required in the study of the marine carbon cycle, particularly when investigating the causes for its variability from seasonal to interannual timescales. This is especially true in the investigation of the consequences of anthropogenic influences.
5
The analysis of any component requires elaborate instrumentation, most of which is currently used onboard ships, either in manual mode or autonomous mode. Technolog-ical developments result in more and more instruments that have long-term reliability so that they can be deployed on surface moorings and buoys, whilst the great technolog-ical and operational challenges mean that only few sensors have been developed that
10
can be used for sub-surface in situ measurements on floats, robots, or gliders. There is a special need for autonomous instruments and sensors that are able to measure a combination of different components, in order to increase the spatial and temporal coverage of marine carbon data.
This paper describes analytical techniques used for the detection of the marine
dis-15
solved carbon components, both inorganic and organic: the fugacity of CO2, total
dis-solved inorganic carbon, pH, alkalinity, and disdis-solved organic carbon. By pointing out advantages, disadvantages, and challenges of the techniques employed in the analysis of each component, we aim to aid non-carbon marine scientists, sensor developers and technologists, in the decision where to tackle the challenges of further development.
20
1 Introduction
This paper is the outcome of the OceanSensors08 workshop, which was held at the Leibniz-Institut f ¨ur Ostseeforschung, Warnem ¨unde, Germany, from 31 March to 4 April 2008. The workshop was, and the resulting papers are, intended for “marine scientists, sensor developers and technologists with an interest in determining and shaping the
fu-25
OSD
6, 491–524, 2009Sensors and instruments for
carbon measurements
U. Schuster et al.
Title Page
Abstract Introduction
Conclusions References
Tables Figures
◭ ◮
◭ ◮
Back Close
Full Screen / Esc
Printer-friendly Version
Interactive Discussion
workshop itself covered four broad areas: climate, ecosystems, hazards, and cross-cutting issues and emerging technologies. The paper presented here covers instru-ments and sensors employed in studying the marine carbon cycle. Since none of the components of the marine dissolved carbon cycle can be measured directly, the sec-tions below describe the analytical principles, which are mainly used in instruments
5
(defined here as analytical systems installed onboard ships, buoys, and moorings), and sensors (defined here as analytical systems which can be installed in situ on sub-surface floats or robots).
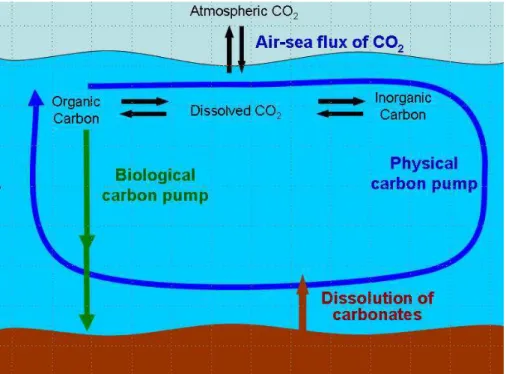
The oceanic carbon cycle is complex, being influenced by chemical, physical, as well as biological processes. Figure 1 shows a simplified schematic of the main processes
10
involved1.
Atmospheric CO2 is taken up by the oceans by transfer through the sea surface:
the air-sea flux of CO2. Through the “physical carbon pump”, this dissolved sea
sur-face carbon can be transported in inorganic form by vertical mixing to intermediate or deep layers in the oceans (also depicted as intermediate and deep water formation).
15
Upwelling, also part of the physical carbon pump, can bring such carbon-rich deep water back into contact with the sea surface, re-emitting CO2 to the atmosphere. The dissolved sea surface CO2can also be converted to organic carbon by biological
activ-ity. Through the “biological pump”, this organic carbon can either be re-cycled into the sea surface, or it can sink, to be mostly recycled at depth and to a minor extent leave
20
the ocean carbon cycle through burial in sediments. Many marine primary biological producers and consumers form tissue of calcium carbonate, i.e. particulate inorganic carbon, which can also undergo vertical export through the water column as well as burial in sediments.
Thus, oceanic carbon occurs in both inorganic and organic form, and as such as
25
both dissolved and particulate carbon. The sections below, describing the technolog-ical principles employed to measure oceanic carbon, are therefore divided into
dis-1
OSD
6, 491–524, 2009Sensors and instruments for
carbon measurements
U. Schuster et al.
Title Page
Abstract Introduction
Conclusions References
Tables Figures
◭ ◮
◭ ◮
Back Close
Full Screen / Esc
Printer-friendly Version
Interactive Discussion
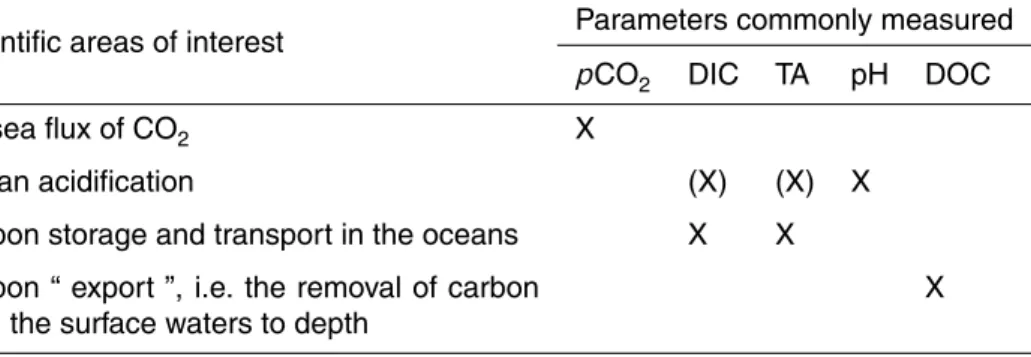
solved inorganic carbon (Sect. 2) and dissolved organic carbon (Sect. 3). Note that particulate carbon is not covered in this paper. A specific scientific interest determines which parameters have to be measured. Table 1 summarizes scientific areas of in-terest when studying the oceanic dissolved carbon cycle, and the parameters most commonly measured in such studies.
5
Measurements of all of these oceanic carbon forms are being done
– form surface waters to the greatest depths accessible;
– in discrete mode (using discrete seawater samples) as well as in continuous mode (in in situ or in pumped surface waters);
– in natural waters as well as samples from experiments (such as mesocosm
stud-10
ies);
– in (land-based) laboratories as well as field platforms, defined here as research ships or commercial vessels, and autonomous moorings, drifting buoys, floats, and other robotic platforms.
Challenges in developing instruments and sensors for oceanic carbon
measure-15
ments, as common in the development of any instrument or sensor, include:
– accuracy/precision2;
– routines for quality assessment (QA)/quality control of measurements (QC);
– long term drift – size/weight;
20
– power requirements and consumption;
2
OSD
6, 491–524, 2009Sensors and instruments for
carbon measurements
U. Schuster et al.
Title Page
Abstract Introduction
Conclusions References
Tables Figures
◭ ◮
◭ ◮
Back Close
Full Screen / Esc
Printer-friendly Version
Interactive Discussion
– costs for installation and maintenance; – sensitivity to biofouling/sedimentation;
– frequency of measurements;
– ruggedness;
– ease of use/maintenance;
5
– modularity;
– response time.
The first two challenges are naturally the same for all measurements, whilst others, e.g. size, weight, power requirements and consumptions, are more dependent on the platform to be used. Hence the order of these challenges is parameter as well as
10
platform dependent.
In order to achieve the required accuracy and precision of measurements, easy ac-cess is often essential for calibration and maintenance. Therefore, a significant num-ber of scientific marine carbon studies use instruments operated either manually or autonomously onboard ships. The technologies are included in this paper. We also
15
extend to sensors that can be used in situ, i.e. submerged below surface waters. De-velopment, quality control, and calibration also requires suitable instruments in land laboratories; with or without modifications, most of these instruments can also be used onboard ships.
A report of the methodologies employed in oceanic carbon research in the late
20
OSD
6, 491–524, 2009Sensors and instruments for
carbon measurements
U. Schuster et al.
Title Page
Abstract Introduction
Conclusions References
Tables Figures
◭ ◮
◭ ◮
Back Close
Full Screen / Esc
Printer-friendly Version
Interactive Discussion
for future developments. An internet-based catalogue of instruments and sensors cur-rently used by the oceanographic carbon community is available through the Inter-national Ocean Carbon Coordination Project (IOCCP), UNESCO-IOC, Paris, France (http://www.ioccp.org/; “Sensors”). This gives information and links for individual in-struments and sensors. Most of the chemical methods are described in (Grasshoff, et
5
al., 1983). A handbook outlining the chemistry, thermodynamical and physical data, and standard operating procedures (SOPs) for the ship-board study of dissolved inor-ganic and orinor-ganic carbon has recently been published (Dickson, et al., 2007). Details of the marine carbonate chemistry are given in (Zeebe and Wolf-Gladrow, 2001)
2 Oceanic carbon in dissolved inorganic form
10
CO2is taken up from the atmosphere by air-sea flux through the sea surface:
CO2(gaseous)↔CO2(aqueous) (1)
Three equilibria then describe the aqueous reactions of inorganic carbon chemistry in seawater:
CO2+H2O↔H2CO3 (2)
15
(Strictly speaking CO2 as shown here refers to a hypothetical species (often referred
to as CO2*(aq)) which is defined as the sum of the concentrations of CO2(aq) and H2CO3(aq).)
H2CO3↔H+ + HCO
−
3 (3)
HCO−
3 ↔H+ + CO 2−
3 (4)
20
OSD
6, 491–524, 2009Sensors and instruments for
carbon measurements
U. Schuster et al.
Title Page
Abstract Introduction
Conclusions References
Tables Figures
◭ ◮
◭ ◮
Back Close
Full Screen / Esc
Printer-friendly Version
Interactive Discussion
1. fugacity of CO2(fCO2),
2. dissolved inorganic carbon (DIC, i.e. the sum of the concentrations of dissolved CO2, bicarbonate and carbonate; also depicted as CT orΣCO2),
3. pH, and
4. total alkalinity (TA; also depicted as TAlk or AT)
5
If at least two of these four parameters are measured in a sample, the other two can be calculated using equilibrium constants, temperature, pressure, and salinity (Dick-son, et al., 2007; Lewis and Wallace, 1998). The particular research questions which has to be answered determine which of the four parameters are measured, in order to obtain the highest accuracy.
10
In the following 4 sections, the analytical principles for the dissolved inorganic carbon parameters are described separately. However, a great need in the marine community are instruments or sensor that are able to measure a combination of these parameters to the required accuracy and precision, in addition to at least seawater temperature and salinity.
15
2.1 The fugacity of CO2(fCO2)
The partial pressure of CO2 (pCO2) is equivalent to the mole fraction of CO2(xCO2)
in air that is in equilibrium with seawater, multiplied with the total pressure (p) of equili-bration:
pCO2=xCO2×p (5)
20
The fugacity of CO2in seawater (fCO2) is defined as the partial pressure of CO2in air that is in equilibrium with seawater, taking into account that CO2is not an ideal gas, i.e. considering molecular interactions of CO2 in seawater (e.g. with H2O and other CO2
OSD
6, 491–524, 2009Sensors and instruments for
carbon measurements
U. Schuster et al.
Title Page
Abstract Introduction
Conclusions References
Tables Figures
◭ ◮
◭ ◮
Back Close
Full Screen / Esc
Printer-friendly Version
Interactive Discussion
concentration range of interest here is rather small, so that thepCO2is therefore used frequently. For very precise calculation the non-ideal behaviour has to be taken into account, however, andfCO2 should be used. In this present work, we use the term fCO2throughout.
The calculation offCO2is given in (Dickson, et al., 2007), SOP24. 5
The fCO2 is reported in units of pressure. For historical reasons this is usually
microatmospheres [µatm] rather than Pascal [Pa]. Surface seawater fCO2 typically ranges from 250 to 550 µatm (with known open ocean extremes of <200µatm and
>1000 µatm), yet can reach 2000µatm at depth (at 20◦C). In order to reliably detect anthropogenic influences on the air-sea exchange of CO2, sea surfacefCO2 should
10
be determined to an accuracy of 1µatm.
Seawater fCO2 cannot be measured directly in the water phase. Hence, the first
step of measurement is to equilibrate seawater with a medium, in which CO2 can be
measured. SeawaterfCO2is therefore determined by
1. the measurement of the mole fraction of CO2 (xCO2) in air that has been equili-15
brated with seawater, or
2. the measurement of the pH of an indicator dye solution, after the solution has been equilibrated with seawater (the pH is determined by the equilibrated CO2it
contains).
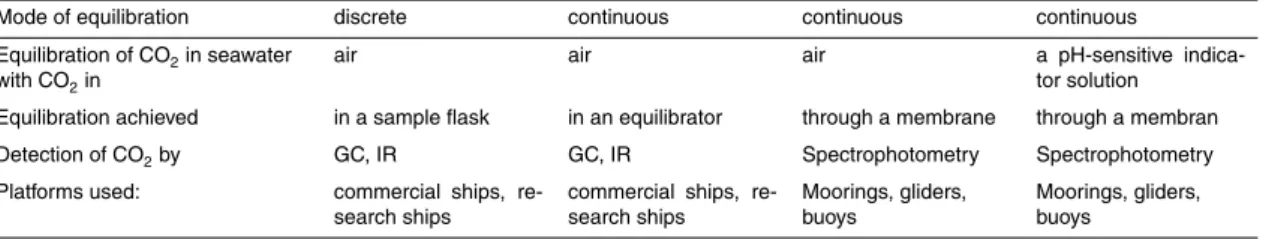
Table 2 outlines the different techniques of equilibration used, together with detection
20
of CO2through to the platforms on which they are used.
The exact technique of equilibration chosen depends on the scientific question un-der investigation, the platform used for measurements, and the geographical location. Equilibration between seawater and air is mainly used for continuous surface mea-surements, on board either research or commercial vessels, and for analysing discrete
25
impos-OSD
6, 491–524, 2009Sensors and instruments for
carbon measurements
U. Schuster et al.
Title Page
Abstract Introduction
Conclusions References
Tables Figures
◭ ◮
◭ ◮
Back Close
Full Screen / Esc
Printer-friendly Version
Interactive Discussion
sible, i.e. in the Southern Ocean or at depth using moorings or floats, equilibration is typically done through membrane-based approaches.
2.1.1 Determination offCO2by detection ofxCO2in air
CO2is firstly equilibrated between seawater and air (described in (b) below), followed
by the detection ofxCO2in the air.xCO2in air can be detected by gas chromatography
5
(GC) or by non-dispersive infrared spectrometry (NDIR).
(a) Detection techniques ofxCO2in air:
The detection technique ofxCO2 in equilibrated air by GC is based on the catalytic
conversion of the CO2to CH4, followed by flame ionization detection (FID) of the CH4 (Dickson, et al., 2007; Robertson, et al., 1993; Weiss, 1981; Weiss, et al., 1992).
10
Underway analytical systems with GCs for the detection ofxCO2were developed in the
1970s and extensively used until the 1990s, when the detection by NDIR absorption spectrometry began to be used more widely.
The advantages of using a gas chromatograph include the need for only small air samples, the non-interference of moisture in the air sample, and the linear response
15
of the FID over a large range ofxCO2concentrations. The latter is particularly
advan-tageous for discrete measurements due to the large concentration range encountered throughout the water column.
The detection technique ofxCO2in equilibrated air by NDIR absorption
spectrome-try is based on the absorption of infrared radiation by CO2molecules. The air, equili-20
brated with seawater, is at 100 % humidity at the temperature of equilibration, and H2O molecules also absorb NDIR radiation.
Advantages are that NDIR detectors can easily be included in automated instru-ments, making them suitable for systems on buoys and moorings. With care (e.g. tem-perature control) and automatic zero-ing of the CO2channel in the detector, long term
25
OSD
6, 491–524, 2009Sensors and instruments for
carbon measurements
U. Schuster et al.
Title Page
Abstract Introduction
Conclusions References
Tables Figures
◭ ◮
◭ ◮
Back Close
Full Screen / Esc
Printer-friendly Version
Interactive Discussion
radiation, so that either the air to be analysed requires drying prior to the detection, orxH2O has to be detected parallel to thexCO2, followed by mathematical moisture correction. Additionally, NDIR detectors can be affected by vibration such as on ships, causing increased instability of the readings. For highly accurate measurements, tem-perature control of the optical cell in the NDIR is also required.
5
(b) Equilibration of CO2between seawater and air:
Equilibration of CO2between air and seawater can be achieved either by direct contact
between air and seawater (discrete or continuous), or by permeation of CO2through a
membrane (continuous).
Equilibration in discrete seawater samples. A known volume of air is either pumped
10
around a closed circuit including it being bubbled through a known volume of seawater in a sample flask, or a know (small) volume of air is introduced into a sealed sample bot-tle filled with seawater. Once equilibrium of CO2between the two phases is achieved, xCO2 in the equilibrated air can then be detected by either GC or NDIR, described
above. The air used for equilibration needs to contain a known initial amount of CO2,
15
ideally close to thefCO2of the seawater sample, in order to minimise the perturbation
in the sample’s CO2concentration. During the equilibration process, a constant known
temperature and pressure within the closed circuit needs to be maintained.
These measurements are carried out during mesocosm experiments, or onboard research vessels to predominately determinefCO2in samples collected at great depth. 20
A disadvantage of such instrumentation is that it is elaborate, since it requires the control and measurement of temperature of the seawater sample to±0.05◦C, pressure
measurements, several standard (and head space) gases, and CO2-free carrier gas
(for GC detection). It also requires a major correction to in situ temperature, since the measurements are usually performed at a standard temperature (e.g. 20◦C). Yet with
25
care, precision of below 0.25% of fCO2 can be achieved. Typically, discrete fCO2
measurements are combined with measurements of at least one other CO2 system
OSD
6, 491–524, 2009Sensors and instruments for
carbon measurements
U. Schuster et al.
Title Page
Abstract Introduction
Conclusions References
Tables Figures
◭ ◮
◭ ◮
Back Close
Full Screen / Esc
Printer-friendly Version
Interactive Discussion
A standard operating procedure for these measurements, applying gas chromatog-raphy for detection, is described by Dickson et al. (2007), SOP04.
Equilibration in continuous mode using an equilibrator. A fixed volume of air is pumped around a circuit, part of which is an “equilibrator”, where CO2 is equilibrated
between a continuous flow of seawater and the counter-flowing air. The flow of
sea-5
water needs to be sufficiently large that it can be considered infinite. The volume of air, in contrast, should be minimised, ensuring that the CO2 in the air adjusts to the
equilibrium value with the seawater, without changing the CO2in the seawater notice-ably. Once equilibrium of CO2between the two phases is achieved, the mole fraction
of CO2(xCO2) in the equilibrated air can then be detected by either GC or NDIR, de-10
scribed above. Throughout, temperature and pressure within the equilibrator need to be measured to within±0.1◦C and±1 mbar, respectively. Additionally, in situ seawater temperature needs to be measured, so that the effect of the temperature change from seawater inlet to equilibrator can be corrected for (ideally<±0.5◦C change). A good
recommendation is to measure in situ salinity as well.
15
A number of different types of equilibrators have been developed, all of which attempt to optimise the surface area between seawater and air. They include the shower-head type (Feely, et al., 1998; Robertson, et al., 1993; Weiss, et al., 1992), the perco-lator type (Cooper, et al., 1998; Schuster and Watson, 2007), the bubble type, the laminar flow type, and also applying a combination of these types in one equilibrator
20
(K ¨ortzinger, et al., 1996; L ¨uger, et al., 2004; Nojiri, et al., 1999).
Measurements using an equilibrator are predominately carried out onboard ships, both on research and on commercial vessels.
The advantage of equilibrator based systems is that with care, highly accurate and precise data can be obtained. Disadvantages of equilibrators are their size, possible
25
OSD
6, 491–524, 2009Sensors and instruments for
carbon measurements
U. Schuster et al.
Title Page
Abstract Introduction
Conclusions References
Tables Figures
◭ ◮
◭ ◮
Back Close
Full Screen / Esc
Printer-friendly Version
Interactive Discussion
A very detailed standard operating procedure of one such ship-board system for the underway, continuous determination offCO2in surface seawater is given by Dickson et al. (2007), SOP05.
Equilibration in continuous mode through a membrane. Recently, commercial
ver-sions of autonomous sub-surface pCO2 sensors have become available, based on
5
NDIR detection, using gas-water equilibration across silicone membranes. In these systems the gas phase is separated from the hydrostatic pressure of the ambient sea-water by special measures (i.e. rigid membrane support in planar or tubular form).
2.1.2 Determination offCO2by detection of pH in a indicator dye solution
This detection technique of CO2 in seawater is based on the pH change of a
pH-10
sensitive colour indicator dye solution, in which the CO2is equilibrated across a
mem-brane with seawater. The pH of the equilibrated indicator dye then depends on the CO2 content.
In such instruments, the equilibrated dye is transferred to an optical cell, where the absorbance is measured spectrophotometrically at wavelengths of the absorbance
15
maxima of the indicator dye’s acid and base forms, and at a non-absorbing wavelength (baseline). The indicator dye solution is prepared by diluting a concentrated solution of the pH indicator with synthetic seawater. The colour indicator solution has to have an ionic strength close to that of seawater (by salinity and bicarbonate content), to min-imise the osmotic pressure across the membrane. The alkalinity of the dye solution
20
is adjusted in order to optimise the pH change across the expected fCO2 range. A mercuric chloride solution is usually added to the colour indicator solution, to prevent biofouling of the membrane.
ThefCO2values are either calculated from the spectrophotometric absorbance and temperature data, together with the dissociation constant of the dye, dissociation
con-25
OSD
6, 491–524, 2009Sensors and instruments for
carbon measurements
U. Schuster et al.
Title Page
Abstract Introduction
Conclusions References
Tables Figures
◭ ◮
◭ ◮
Back Close
Full Screen / Esc
Printer-friendly Version
Interactive Discussion
Southern Ocean. Alternatively, the absorbance of the specific dye solution can be cal-ibrated in the laboratory across the expected ranges infCO2and temperature, so that
measurements in the field can be directly related tofCO2.
A challenge for any instrument deployed on buoys or moorings is to minimise long-term drift. Additionally, a pH based technique requires sufficiently high sensitivity to
5
resolvefCO2changes in seawater.
2.1.3 fCO2instrument/sensor intercomparisons
A number of intercomparison experiments offCO2instruments have been carried out. In 1994, a laboratory intercomparison was carried out at Scripps Institute of Oceanog-raphy. In 1996, a ship-board intercomparison was carried out onboardFS Meteor
dur-10
ing a cross-Atlantic cruise (K ¨ortzinger, et al., 2000). This identified that the temperature in the equilibrator was not always measured to the accuracy required for high-quality
fCO2data. In 2003, a pool-side intercomparison experiment was carried out in Japan
(e.g. http://ioc3.unesco.org/ioccp/Docs/TsukubaWSdocs/WG1SummaryRpt.pdf). This identified that the performance of equilibrators can introduce differences in measured
15
fCO2. For 2009, two intercomparisons are planned: one again as a pool-side
inter-comparison in Japan, continuing the 2003 experiment, and an open-ocean one by the Alliance for Coastal Technologies (http://www.act-us.info/evaluation/rft.php)
2.2 Dissolved inorganic carbon (DIC)
DIC in seawater is defined as the sum of the concentrations of dissolved CO2, carbonic 20
acid, bicarbonate, and carbonate:
DIC=[CO2(aq)]+[H2CO3]+[HCO3−]+[CO23−] (6)
OSD
6, 491–524, 2009Sensors and instruments for
carbon measurements
U. Schuster et al.
Title Page
Abstract Introduction
Conclusions References
Tables Figures
◭ ◮
◭ ◮
Back Close
Full Screen / Esc
Printer-friendly Version
Interactive Discussion
4300µmol kg−1 in extreme environments (e.g. the Black Sea). For anthropogenic in-vestigations, it needs to be determined to an accuracy of 1µmol kg−1.
Certified calibration standards for DIC measurements are available since 1991 from Scripps Institution of Oceanography (http://andrew.ucsd.edu/co2qc/index.html), en-abling a globally consistent standardization of quality control of measurements.
5
DIC is measured by
1. coulometry, after acidifying a known amount of seawater with phosphoric acid, stripping the released CO2 by an inert, CO2-free carrier gas, and measuring the
amount of CO2in this gas by coulometry, or
2. NDIR, after acidifying a known amount of seawater with phosphoric acid, stripping
10
the released CO2by an inert, CO2-free carrier gas, and measuring the amount of CO2in this gas aborption spectrometry, or
3. potentiometry, during which a seawater sample of known mass is titrated with a strong acid (e.g. 0.1 M HCl) in a closed cell.
2.2.1 Detection of DIC by coulometry
15
The CO2 released from a seawater sample by acidification is passed into a
solu-tion containing a pH-sensitive colour indicator, where CO2 reacts to form a strong
acid, which can then be titrated coulormetrically by electrochemical generation of a strong base. Due to the necessity to carefully control the performance of a coulometer, coulometer-based systems can only be used for discrete samples on board research
20
vessels. Such a system using coulometers is described by Dickson et al. (2007), SOP02.
Disadvantages are that such measurements are elaborate. They require careful dis-pension of a precisely known volume of seawater into the chamber where the sample is acidified, high-quality measurement of temperatures, careful monitoring of coulometer
25
OSD
6, 491–524, 2009Sensors and instruments for
carbon measurements
U. Schuster et al.
Title Page
Abstract Introduction
Conclusions References
Tables Figures
◭ ◮
◭ ◮
Back Close
Full Screen / Esc
Printer-friendly Version
Interactive Discussion
in the analysis; since these chemicals need to be replaced at least at daily intervals, coulometers are affected by hourly-long “down-times” for the chemical conditioning of the coulometer solution. For improved quality of measurements, the coulometer cell should be temperature controlled.
The advantage is that with care, very high precision and accuracy can be achieved.
5
2.2.2 Detection of DIC by non-dispersive infrared absorption
The CO2 released from a seawater sample by the acidification is passed through a
NDIR, such as described in Sect. 2.1.1 for the determination of fCO2. To achieve
the required accuracy and precision, the detector needs to be carefully temperature controlled in such systems.
10
2.2.3 Determination of DIC by potentiometry
A seawater sample of known mass is titrated with a strong acid (e.g. 0.1 M HCl) in a closed cell. The addition of the acid changes the electromotive potential (e.m.f.) of the seawater, which can be followed by a pH sensitive electrode (combination electrode or electrode pair). During titration, the titration cell needs to be kept at constant
temper-15
ature. Since CO2 gas is produced near the location of acid addition in the seawater solution, this gas must be kept from escaping the system so that it re-dissolves; hence a closed titration cell is used.
2.3 pH
pH is a measure of the acidity or basicity of a solution. It is defined as the negative
20
OSD
6, 491–524, 2009Sensors and instruments for
carbon measurements
U. Schuster et al.
Title Page
Abstract Introduction
Conclusions References
Tables Figures
◭ ◮
◭ ◮
Back Close
Full Screen / Esc
Printer-friendly Version
Interactive Discussion
On the total scale, it is defined as:
pH=[H+]free+[1+ST/KS]≈[H+]free+[HSO
−
4](for pH>4) (7)
whereST is the total sulfate concentration, andKS is the acid dissociation constant for
HSO−4.
A full discussion on the other scales in beyond this paper, and we refer the interested
5
reader to e.g. (Dickson, 1984; Dickson, 1993) for a detailed discussion of the various pH scales that have been used in seawater.
Oceanic pH ranges from 7.8 to 8.3, but can reach more extreme values in e.g. anoxic basins such as the Black Sea. For oceanic carbon research purposes, it should be determined to an accuracy of±0.002 pH units.
10
Certified calibration standards for pH systems are not yet available, yet a limited num-ber of prototype reference material is available (http://andrew.ucsd.edu/co2qc/index. html).
1. potentiometry or
2. spectrophotometry.
15
2.3.1 Determination of pH by potentiometry
In the field of electroanalytical chemistry, potentiometry is the measurement of the electrical potential difference that develops between the ion activity in two different so-lutions separated by an interface. The potential is the result of the free energy change that would occur, if the chemical phenomena were to proceed until equilibrium. If the
20
activity of ions on one side of the interface is held constant, the electrical potential is related to the activity of ions on the other side.
A combined pH glass electrode, for example, has a thin membrane of hydrogen-sensitive glass, formed into a bulb and melted to a glass shaft. The inside is filled with a liquid of known, constant composition, which creates a potential difference across the
25
OSD
6, 491–524, 2009Sensors and instruments for
carbon measurements
U. Schuster et al.
Title Page
Abstract Introduction
Conclusions References
Tables Figures
◭ ◮
◭ ◮
Back Close
Full Screen / Esc
Printer-friendly Version
Interactive Discussion
potential is measured by an electrode inside the glass bulb, and a reference electrode outside. The reference electrode can be separated from the glass electrode, or as in the combined pH glass electrode, the reference electrode is placed inside a mantle surrounding the glass electrode, but its liquid connected to the outside through a glass frit. The measured potential represents the sum of several individual potentials along
5
the entire setup. Since only the potential across the glass membrane is of interest, all others (e.g., junction potential, asymmetry potential) as well as their change with time need to be accounted for by frequent calibration.
The response of any pair of glass electrode/reference electrode is calibrated using buffers prepared in the laboratory. Besides having a known pH, buffer solutions are
10
required to be very stable over time. A large number of different buffers have been developed for pH in seawater measurements, and need to be chosen according to the measurements to be made.
A combined glass electrode and reference electrode can be used, yet often better measurements are achieved with separate glass electrode and reference electrode.
15
The glass electrode/reference electrode pair measures the e.m.f. in a standard buffer to obtain background value, and then in a seawater sample, whilst both liquids are at the same temperature. The e.m.f. of the electrode pair can be measured with a voltmeter of high input impedance. The seawater pH can then be calculated using the e.m.f. of the buffer and seawater sample, temperature, and salinity. The standard operating
20
procedure of such a measurements is given by Dickson et al. (2007), SOP06a.
Challenges of such instrumentation are careful temperature control of solutions used, electrode drift, extremely careful preparation of the buffer solutions, problems with reference electrodes, and the need for frequent calibrations. SCOR Working
Group 75 reported that by 1988, the precision of pH measurements was ±0.02 pH
25
OSD
6, 491–524, 2009Sensors and instruments for
carbon measurements
U. Schuster et al.
Title Page
Abstract Introduction
Conclusions References
Tables Figures
◭ ◮
◭ ◮
Back Close
Full Screen / Esc
Printer-friendly Version
Interactive Discussion
2.3.2 Determination of pH by spectrophotometry
Spectrophotometry has been used increasingly especially since the late 1980s, first the multi-wavelength absorbance is measured in a seawater sample, then again after a pH-sensitive indicator dye is added to the seawater sample. It is based on the principle that the corresponding acid and base forms of a pH indicator dye have different colours,
5
hence different absorption bands. The total hydrogen concentration is then calculated using the absorbances measured, temperature, salinity, and the dissociation constant of the indicator dye used.
A number of different indicator dyes are being used for pH determination, and re-search is continuing for optimal combinations of e.g. indicator dye and multi-wavelength
10
chosen. The standard operating principle for ship-board measurements of discrete samples usingm-cresol purple as indicator is given by Dickson et al. (2007), yet de-velopments are being made to develop an automated system for the deployment on ships, buoys and moorings (Bellerby, et al., 2002; DelValls, 1999).
Challenges of these systems are careful temperature control of solutions and
spec-15
trophotometer cell, preparing indicator solution with ionic strength close to that of sea-water, homogenous mixing of sample and dye solution.
Potential accuracy is±0.002 pH, sensitivity and long-term reproducibility can be bet-ter than±0.001 pH (e.g. Friis, et al., 2004)
2.4 Total Alkalinity (TA)
20
The total alkalinity of seawater is defined as the “number of moles of hydrogen ion equivalent to the excess of proton acceptors (bases formed from weak acids with a dissociation constant K≤10−4.5 at 25◦C and zero ionic strength) over proton donors
(acids with K>10−4.5) in 1 kg of sample” (Dickson, 1981). Total alkalinity encloses contributions from the alkalinity of all relevant ions in the sample. For seawater with
25
OSD
6, 491–524, 2009Sensors and instruments for
carbon measurements
U. Schuster et al.
Title Page
Abstract Introduction
Conclusions References
Tables Figures
◭ ◮
◭ ◮
Back Close
Full Screen / Esc
Printer-friendly Version
Interactive Discussion
very small contributions to the total alkalinity, are often available from parallel nutri-ent measuremnutri-ents. Concnutri-entrations of ammonia and sulfide are typically so low in the open ocean that their contributions to total alkalinity can (in most cases) be neglected. In coastal waters and anoxic waters, the situation can be different. These contributions, though minor, need to be estimated or measured separately.
5
A recent definition of alkalinity (Wolf-Gladrow, et al., 2007), which is entirely consis-tent with the one of (Dickson, 1981), takes a different approach that helps to infer the effects of biogeochemical processes on alkalinity.
TA is reported as micromoles per kilogram of seawater [µmol kg−1] or as microequiv-alent per kilogram [µEqu kg−1]. Please note that in some literature, alkalinity is reported
10
as [µmol l−1) or [µEq l−1], which is not independent of seawater density, i.e. tempera-ture and salinity.
Oceanic values are usually between 2000 and 2500µmol kg−1, yet can reach
4600µmol kg−1 (e.g. Black Sea). Total alkalinity needs to be measured to within
±1µmol kg−1 in ocean carbon studies to detect anthropogenic influences. For
cal-15
culations in the sea water CO2 system, the carbonate alkalinity is important. This is
therefore calculated by substracting all other alkalinity contributions from the measured total (or titration) alkalinity.
In principle, alkalinity is determined by adding acid to a seawater sample and ana-lyzing the change in the e.m.f. of a pH electrode caused hereby. The number of steps
20
can range from one to a full titration (20 or more acid increments added). As for pH, the pH change caused by the acid addition can be measured by
1. potentiometric titration or
2. spectrophotometrically.
The most common method, however, today is potentiometric titration in a closed or
25
OSD
6, 491–524, 2009Sensors and instruments for
carbon measurements
U. Schuster et al.
Title Page
Abstract Introduction
Conclusions References
Tables Figures
◭ ◮
◭ ◮
Back Close
Full Screen / Esc
Printer-friendly Version
Interactive Discussion
2.4.1 Determination of TA by potentiometric titration
Potentiometric titration in a closed cell follows the same procedure as outlined for the determination of DIC by potentiometry (Sect. 2.3.3) and is needed only if a DIC value is to be derived from the titration. It should be noted that this determination of DIC is of lower accuracy than the coulometric technique described in Sect. 2.2.1.
5
So, if other methods are used for DIC measurements, the alkalinity titration cell can beopen, since CO2exchange only affects the DIC value, but not alkalinity. The seawa-ter sample is titrated with hydrochloric acid, which has an ionic strength similar to that of seawater. Titration is monitored by reading the e.m.f. of a glass electrode/reference electrode pair. The detection of the titration end point from the titration results is diffi
-10
cult and requires mathematical procedures. This can be the linearization of the titration curve by a GRAN plot, or the comparison of the experimental titration curve to a the-oretical calculated titration curve and mathematical minimization of the difference by adjusting the parameters of the theoretical curve fit.
Although, in principle, alkalinity could be determined from the pH change by a single
15
acid addition, precision greatly increases if more titration points can be used for the calculation. Temperature needs to be kept constant during titration and good mixing is required. However, the stabilization of the potential in the solution is a rather slow process (faster at higher temperature), so a full titration does take some time (typically 10–20 min).
20
Spectrophotometric titrations of alkalinity have been described, but are not (yet) widely used.
OSD
6, 491–524, 2009Sensors and instruments for
carbon measurements
U. Schuster et al.
Title Page
Abstract Introduction
Conclusions References
Tables Figures
◭ ◮
◭ ◮
Back Close
Full Screen / Esc
Printer-friendly Version
Interactive Discussion
3 Oceanic carbon in dissolved organic form
Dissolved organic carbon (DOC) is defined as the fraction of organic carbon that passes through a filter (typically of 0.2–0.45µm pore size) and survives acidification and sparging (Dickson, et al., 2007). The determination of DOC concentrations has been the topic of considerable attention and activity (e.g., see discussions in Hansell
5
and Carlson, 2001; Pilson, 1998).
There are two noteworthy facts about DOC and its measurement:
(a) The introduction in 1988 of a high temperature catalytic oxidation technique to analyse for DOC (Sugimura and Suzuki, 1988) initiated an international effort to resolve the long-standing lack of coordination and consensus in DOC analysis (e.g., UNESCO,
10
1992). Subsequent intercalibration exercises have led to the resolution of many analyt-ical issues (Hedges, et al., 1993; Sharp, 1993) and have shown that experienced DOC analysts and the use of suitable reference materials can produce comparable results regardless of the method used (Dafner and Wangersky, 2002a; Hansell and Carlson, 2001; Sharp, et al., 2002).
15
(b) The majority of measured DOC remains chemically uncharacterized despite ad-vances in its characterisation (Aluwihare, et al., 1997; Dafner and Wangersky, 2002b; Lee and Henrichs, 1993). Therefore, reporting of DOC values is laden with operational and analytical significance and still cannot divulge more information regarding the type of organic compounds that are present (Hansell and Carlson, 2001).
20
DOC is the second largest pool of carbon in the ocean after DIC (Houghton, 2007; Pilson, 1998), with oceanic DOC concentrations varying from just under 40µmol·l−1in
the deep open ocean to over 200µmol·l−1at river-ocean margins (Sharp, et al., 2002). The sheer size of the DOC pool, as well as the current interest in monitoring the fate of anthropogenic carbon emissions, yield a necessity for measuring DOC systematically,
25
OSD
6, 491–524, 2009Sensors and instruments for
carbon measurements
U. Schuster et al.
Title Page
Abstract Introduction
Conclusions References
Tables Figures
◭ ◮
◭ ◮
Back Close
Full Screen / Esc
Printer-friendly Version
Interactive Discussion
3.1 Colored dissolved organic matter (CDOM)
There is currently no sensor that can detect DOC. The greatest advance in this direction has been the development of sensors for CDOM, which is defined as the component of total dissolved organic matter (DOM) that absorbs light over a broad range of visible and UV wavelengths (Coble, 2007). Two optical properties of CDOM, absorbance and
5
fluorescence, have been used to quantify CDOM. The absorption spectrum of CDOM in a sample can be used to calculate a spectral slope, which is empirically related to an absorption coefficient. Alternatively, the fluorescence of the fraction of CDOM that does fluoresce can be measured by excitation in the ultraviolet and detection in the visible spectrum.
10
Both absorption coefficient and fluorescence of DOM have been correlated with each other and DOC concentrations (Belzile, et al., 2006; Bowers, et al., 2004; Coble, 2007; R ¨ottlers and Doerffer, 2007), even though this is a case-specific endeavor, given that a direct correlation is not always the case (Hansell, 2002). However, the ability to detect CDOM remotely via satellite or aircraft, coupled with commonly positive correlations
15
between the two parameters in coastal areas, where DOC concentrations and dynam-ics are some of the most intense in oceanic settings, has elevated CDOM to the status of a DOC proxy (see discussion in Coble, 2007).
There are numerous commercially available CDOM sensors (see Sect. 3.1 in Moore, et al., 2008), and some have been successfully used on moored buoys to collect
20
high-frequency CDOM fluorescence data (Belzile, et al., 2006). A suite of suitable fluorometers has recently been evaluated by the Alliance of Coastal Technologies (http://www.act-us.info/evaluation reports.php).
3.2 Detection of hydrocarbons
The term “hydrocarbons” is used interchangeably with “oils” or “Polycyclic aromatic
25
OSD
6, 491–524, 2009Sensors and instruments for
carbon measurements
U. Schuster et al.
Title Page
Abstract Introduction
Conclusions References
Tables Figures
◭ ◮
◭ ◮
Back Close
Full Screen / Esc
Printer-friendly Version
Interactive Discussion
material.
Multispectral sensors employ the effect of hydrocarbon presence on the properties of absorption, fluorescence, and reflection to detect their presence and quantify their con-centration (Zielinski, et al., 2008). Of particular interest is the generation of excitation-emission matrices (EEM), by both sample excitation and spectrophotometric excitation-emission
5
detection of a single sample at multiple wavelengths (Moore, et al., 2004). Another notable application of these sensors is the use of differences in fluorescence lifetime (defined as the average duration of time an organic molecule remains excited before relaxing and radiating a photon) to distinguish between different organic compounds or groups of compounds (Moore, et al., 2008).
10
Special mention should be made of the demonstrated use of Surface-Enhanced Ra-man Scattering (SERS) in a sensor (“SERS optode”) to detect PAHs (Schmidt, et al., 2004). Raman Scattering is the technique by which a shift in the frequency of scattered laser light is related to the excitation of vibrational modes which are compound-specific. In SERS, molecules of the compounds under study are attached onto the surfaces of
15
metallic nanostructures contained in suitable substrates to enhance the Raman sig-nals. The reported limits of detection for this sensor ranged from 10−1to 102nmol·l−1
(Schmidt, et al., 2004).
4 Summary
The technological and operational challenges, to achieve highly accurate and precise
20
measurements of any marine dissolved carbon component, are numerous. In recent years, a great number of instruments and sensors have been developed, which lead to the collection of data serving as a basis for model calculations in some oceanic regions.
However, there remains a great need for the further development of instruments
25
OSD
6, 491–524, 2009Sensors and instruments for
carbon measurements
U. Schuster et al.
Title Page
Abstract Introduction
Conclusions References
Tables Figures
◭ ◮
◭ ◮
Back Close
Full Screen / Esc
Printer-friendly Version
Interactive Discussion
This is the only way to elucidate the causes for the variability of the marine carbon cycle on a global scale and to understand the anthropogenic impacts on the carbon cycle. Highly accurate and precise measurements are top priority for the study of the anthropogenic impacts on the carbon cycle. In geographical regions where the access is difficult, such as the Southern Ocean, lower quality measurements might still be
5
acceptable in order to obtain any data at all. Yet in general, in marine carbon science, a range of instruments and sensors is needed in the future, for deployment on more ships, buoys, moorings, floats, robots, and gliders.
Acknowledgements. The authors acknowledge the large number of past and present marine carbon scientists and technologists, in their effort in improving existing sensors/instruments as
10
well as developing new ones. The lead author is supported by the European Integrated Project CARBOOCEAN, grant number EVK2-CT-2000-00088.
References
Aluwihare, L. I., Repeta, D. J., and Chen, R. F.: A major biopolymeric component to dissolved organic carbon in surface sea water, Nature, 387, 166–169, 1997.
15
Bellerby, R. G. J., Olsen, A., Johannessen, T., and Croot, P.: A high precision spectrophoto-metric method for on-line shipboard seawater pH measurements: the automated marine pH sensor (AMpS), Tallanta, 56, 61–69, 2002.
Belzile, C., Roesler, C. S., Christensen, J. P., Shakhova, N., and Semiletov, I.: Fluorescence measured using the WETStar DOM fluorometer as a proxy for dissolved matter absorption,
20
Estuar. Coast. Shelf Sci., 67, 441–449, 2006.
Bowers, D. G., Evans, D., Thomas, D. N., Ellis, K., and Williams, P. J. L.: Interpreting the colour of an estuary, Estuar. Coast. Shelf Sci., 59, 13–20, 2004.
Coble, P. G.: Marine optical biogeochemistry: The chemistry of ocean color, Chem. Rev., 107, 402–418, 2007.
25
OSD
6, 491–524, 2009Sensors and instruments for
carbon measurements
U. Schuster et al.
Title Page
Abstract Introduction
Conclusions References
Tables Figures
◭ ◮
◭ ◮
Back Close
Full Screen / Esc
Printer-friendly Version
Interactive Discussion
Dafner, E. V. and Wangersky, P. J.: A brief overview of modern directions in marine DOC studies – Part I. Methodological aspects, J. Environ. Monitor., 4, 48–54, 2002a.
Dafner, E. V. and Wangersky, P. J.: A brief overview of modern directions in marine DOC sutdies Part II – Recent progress in marine DOC studies, J. Environ. Monitor., 4, 55–69, 2002b. DelValls, T. A.: Underway pH measurements in upwelling conditions: The California Current,
5
Ceinc. Mar., 25, 345–365, 1999.
Dickson, A. G.: An exact definition of total alkalinity and a procedure for the estimation of alkalinity and total inorganic carbon from titration data, Deep-Sea Res., 28, 609–623, 1981. Dickson, A. G.: pH scales and proton-transfer reactions in saline media such as sea-water,
Geochim. Cosmochim. Acta, 48, 2299–2308, 1984.
10
Dickson, A. G.: The measurement of seawater pH, Marine Chemistry, 44, 131–142, 1993. Dickson, A. G., Sabine, C. L., and Christian, J. R.: Guide to best practices for ocean CO2
measurements, PICES Special Publication, 3, 191 pp., 2007
Feely, R. A., Wanninkhof, R., Milburn, H. B., Cosca, C. E., Stapp, M., and Murphy, P. P.: A new automated underway system for making high precision pCO2 measurements onboard
15
research ships, Anal. Chim. Acta, 377, 185–191, 1998.
Friis, K., K ¨ortzinger, A., and Wallace, D. W. R.: Spectrophotometric pH measurement in the ocean: Requirements, design, and testing of an autonomous charge-coupled device detector system, Limnol. Oceanogr., 2, 126–136, 2004.
Grasshoff, K., Ehrhardt, M., and Kremling, K.: Methods of Seawater Analysis, 2nd ed., Verlag
20
Chemie, Weinheim, 1983.
Hansell, D. A. and Carlson, C. A.: Marine dissolved organic matter and the carbon cycle, Oceanography, 14, 41–49, 2001.
Hansell, D. A.: DOC in the global ocean carbon cycle, in: Biogeochemistry of marine dissolved organic matter, edited by: Hansell, D. A., and Carlson, C. A., Academic Press, Amsterdam,
25
The Netherlands, 685–715, 2002.
Hedges, J. I., Bergamaschi, B. A., and Benner, R.: Comparative analyses of DOC and DON in natural waters, Marine Chemistry, 41, 121–134, 1993.
Houghton, R. A.: Balancing the global carbon budget, Annu. Rev. Earth Planet. Sci., 35, 313– 347, 2007.
30
OSD
6, 491–524, 2009Sensors and instruments for
carbon measurements
U. Schuster et al.
Title Page
Abstract Introduction
Conclusions References
Tables Figures
◭ ◮
◭ ◮
Back Close
Full Screen / Esc
Printer-friendly Version
Interactive Discussion
K ¨ortzinger, A., Mintrop, L., Wallace, D. W. R., Johnson, K. M., Neill, C., Tilbrook, B., Towler, P., Inoue, H. Y., Ishii, M., Shaffer, G., Saavedra, R. F. T., Ohtaki, E., Yamashita, E., Poisson, A., Brunet, C., Schauer, B., Goyet, C., and Eischeid, G.: The international at-sea intercompar-ison offCO2systems during the R/V Meteor Cruise 36/1 in the North Atlantic Ocean, Mar. Chem., 72, 171–192, 2000.
5
Lee, C. and Henrichs, S. M.: How the nature of dissolved organic-matter might affect the anal-ysis of dissolved organic-carbon, Mar. Chem., 41, 105–120, 1993.
Lewis, E. and Wallace, D. W. R.: Program Development for CO2 System Calculations, Car-bon Dioxide Information Analysis Center, Oak Ridge National Laboratory, US Department of Energy, Oak Ridge, TennesseeORNL/DCIAC-105, 26, 1998.
10
L ¨uger, H., Wallace, D. W. R., K ¨ortzinger, A., and Nojiri, Y.: The pCO2variability in the midlat-itude North Atlantic Ocean during a full annual cycle, Glob. Biogeochem. Cy., 18, GB3023, doi:10.1029/2003GB002200, 2004.
Moore, C., Da Cuhna, J., Rhoades, B., Twardowski, M. S., Zaneveld, J. R. V., and Dombroski, J.: A new in-situ measurement and analysis system for excitation-emission flourescence in
15
natural waters, Ocean Optics XVII, Freemantle, Australia, 2004.
Moore, C., Barnard, A., Fietzek, P., Lewis, M. R., Sosik, H. M., White, S., and Zielinski, O.: Optical tools for ocean monitoring and research, Ocean Science Discussions, 5, 659–717, 2008.
Nojiri, Y., Fujinuma, Y., Zeng, J., and Wong, C. S.: Monitoring of pCO2with complete seasonal
20
coverage utilizing a cargo shipM/S Skaugranbetween Japan and Canada/US, Second Inter-national Symposium of CO2in the Oceans, CGER-Rep. CGER-1037-’99, Tsukuba, Japan, 1999.
Pilson, M. E. Q.: An Introduction to the Chemistry of the Sea, Prentice Hall, NJ, USA, 431 pp., 1998.
25
Robertson, J. E., Watson, A. J., Langdon, C., Ling, R. D., and Wood, J. W.: Diurnal variation in surfacepCO2and O2at 60◦N, 20◦W in the North Atlantic, Deep-Sea Res. II, 40, 409–422, 1993.
R ¨ottlers, R. and Doerffer, R.: Measurements of optical absorption by chromophoric dissolved organic matter using a point-source integrating-cavity absorption meter, Limnology and
30
Oceanography Methods, 5, 126–135, 2007.
OSD
6, 491–524, 2009Sensors and instruments for
carbon measurements
U. Schuster et al.
Title Page
Abstract Introduction
Conclusions References
Tables Figures
◭ ◮
◭ ◮
Back Close
Full Screen / Esc
Printer-friendly Version
Interactive Discussion
Bull., 49, 229–234, 2004.
Schuster, U. and Watson, A. J. W.: A variable and decreasing sink for atmospheric CO2in the North Atlantic, J. Geophus. Res., 112, C11006, doi:10.1029/2006JC003941, 2007.
Sharp, J. H.: The dissolved organic carbon controversy: an update, Oceanography, 6, 45–50, 1993.
5
Sharp, J. H., Carlson, C. A., Peltzer, E. T., Castle-Ward, D. M., Savidge, K. B., and Rinker, K. R.: Final dissolved organic carbon broad community intercalibration and preliminary use of DOC reference materials, Mar. Chem., 77, 239–253, 2002.
Sugimura, Y. and Suzuki, Y.: A high-temperature catalytic-oxidation method for the determina-tion of non-volatile dissolved organic-carbon in seawater by direct injecdetermina-tion of a liquid sample,
10
Mar. Chem., 24, 105–131, 1988.
UNESCO: Methodologies for oceanic CO2 measurements. Final report of SCOR Working Group 75, Woods Hole, USA, UNESCO Technical papers in marine science, 65, 37 pp., 1992.
Weiss, R. F.: Determinations of carbon dioxide and methane by daul catalyst flame ionization
15
chromatogrphy and nitrous oxide by electron capture chromatography, J. Chromatogr. Sci., 19, 611–616, 1981.
Weiss, R. F., Van Woy, F. A., and Salameh, P. K.: Surface water and atmospheric carbon dioxide and nitrous oxide observations by shipboard automated gas chromatography: results from expeditions between 1977 and 1990, Oak Ridge National Laboratory, Oak Ridge, Tennessee,
20
USAORNL/CDIAC-59, NPD-044, 150 pp., 1992.
Wolf-Gladrow, D. A., Zeebe, R. E., Klaas, C., K ¨ortzinger, A., and Dickson, A. G.: Total alkalinity: The explicit conservative expression and its application to biogeochemical processes, Mar. Chem., 106, 287–300, 2007.
Zeebe, R. E. and Wolf-Gladrow, D. A.: CO2in seawater: equilibrium, kinetics, isotopes, Elsevier
25
Oceanography Book Series, Elsevier, Amsterdam, 346 pp., 2001.
OSD
6, 491–524, 2009Sensors and instruments for
carbon measurements
U. Schuster et al.
Title Page
Abstract Introduction
Conclusions References
Tables Figures
◭ ◮
◭ ◮
Back Close
Full Screen / Esc
Printer-friendly Version
Interactive Discussion
Table 1. Scientific areas of interest when studying the oceanic carbon cycle, and the param-eters most commonly measured during such studies. Paramparam-eters listed are the fugacity of CO2(fCO2), total dissolved inorganic carbon (DIC), total alkalinity (TA), pH, dissolved organic carbon (DOC). “X” depicts the main parameter(s) to be measured; “(X)” depicts additional pa-rameters which can aid the scientific study substantially.
Scientific areas of interest Parameters commonly measured
pCO2 DIC TA pH DOC
Air-sea flux of CO2 X
Ocean acidification (X) (X) X Carbon storage and transport in the oceans X X
Carbon “ export ”, i.e. the removal of carbon from the surface waters to depth
OSD
6, 491–524, 2009Sensors and instruments for
carbon measurements
U. Schuster et al.
Title Page
Abstract Introduction
Conclusions References
Tables Figures
◭ ◮
◭ ◮
Back Close
Full Screen / Esc
Printer-friendly Version
Interactive Discussion
Table 2. Different techniques employed to determine oceanic fCO2, with the different tech-niques of equilibration used, together with detection of CO2through to the platforms on which they are used.
Mode of equilibration discrete continuous continuous continuous
Equilibration of CO2in seawater
with CO2in
air air air a pH-sensitive
indica-tor solution Equilibration achieved in a sample flask in an equilibrator through a membrane through a membran
Detection of CO2by GC, IR GC, IR Spectrophotometry Spectrophotometry
Platforms used: commercial ships, re-search ships
commercial ships, re-search ships
Moorings, gliders, buoys
OSD
6, 491–524, 2009Sensors and instruments for
carbon measurements
U. Schuster et al.
Title Page
Abstract Introduction
Conclusions References
Tables Figures
◭ ◮
◭ ◮
Back Close
Full Screen / Esc
Printer-friendly Version
Interactive Discussion
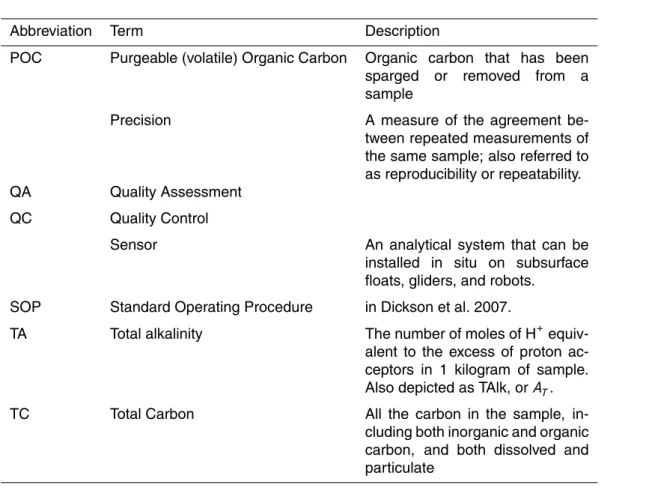
Table 3.Glossary of terms used in this paper.
Abbreviation Term Description
Accuracy The closeness of a measured quantity to the its true value. AT, ALK Alkalinity See TA
Biological pump The “export” of biologically bounded carbon from surface waters to depth, i.e. POC, PIC, and DOC.
CDOM Coloured Dissolved Organic Carbon The optically measurable fraction of the dissolved inorganic carbon. DIC Dissolved Inorganic Carbon The sum of the concentrations of dissolved CO2, bicarbonate and carbonate; also depicted as CT or ΣCO2, or TCO2.
DOC Dissolved Organic Carbon Organic carbon remaining in a sample after filtering the sample, typically using a<0.45µm filter. DOM Dissolved Organic Matter
fCO2 fugacity of CO2 pCO2 in air that is in equilib-rium with seawater, taking into ac-count the non-ideal behaviour of CO2 in seawater at atmospheric
pressure.
FID Flame Ionisation Detector Used to convert CO2 to CH4 for
OSD
6, 491–524, 2009Sensors and instruments for
carbon measurements
U. Schuster et al.
Title Page
Abstract Introduction
Conclusions References
Tables Figures
◭ ◮
◭ ◮
Back Close
Full Screen / Esc
Printer-friendly Version
Interactive Discussion
Table 3.Continued.
Abbreviation Term Description
GC Gas Chromatography Detection technique used to mea-surexCO2in air
Instrument An analytical system installed on-board ships, buoys, and moorings; it cannot be used in-situ in subsur-face deployments.
NDIR Non-dispersive infrared absorption Detection technique used to mea-surexCO2in air
NPOC Non-Purgeable Organic Carbon Commonly referred to as TOC; or-ganic carbon remaining in a sam-ple after purging the samsam-ple with gas.
PAH Polycyclic armoatic hydrocarbons Multi-carbon and –hydrogen satu-rated, unsatusatu-rated, and aromatic compounds.
pCO2 partial pressure of CO2 The partial pressure of CO2in air that is in equilibrium with seawa-ter. pCO2 does not take into ac-count the non-ideal behaviour of CO2 in seawater at atmospheric pressure.
OSD
6, 491–524, 2009Sensors and instruments for
carbon measurements
U. Schuster et al.
Title Page
Abstract Introduction
Conclusions References
Tables Figures
◭ ◮
◭ ◮
Back Close
Full Screen / Esc
Printer-friendly Version
Interactive Discussion
Table 3.Continued.
Abbreviation Term Description
POC Purgeable (volatile) Organic Carbon Organic carbon that has been sparged or removed from a sample
Precision A measure of the agreement be-tween repeated measurements of the same sample; also referred to as reproducibility or repeatability. QA Quality Assessment
QC Quality Control
Sensor An analytical system that can be installed in situ on subsurface floats, gliders, and robots.
SOP Standard Operating Procedure in Dickson et al. 2007.
TA Total alkalinity The number of moles of H+ equiv-alent to the excess of proton ac-ceptors in 1 kilogram of sample. Also depicted as TAlk, orAT. TC Total Carbon All the carbon in the sample,
OSD
6, 491–524, 2009Sensors and instruments for
carbon measurements
U. Schuster et al.
Title Page
Abstract Introduction
Conclusions References
Tables Figures
◭ ◮
◭ ◮
Back Close
Full Screen / Esc
Printer-friendly Version
Interactive Discussion
Table 3.Continued.
Abbreviation Term Description
TOC Total Organic Carbon Material derived from decaying vegetation, bacterial growth, and metabolic activities of living organ-isms or chemicals; excluding total inorganic carbon
VOS Voluntary Observing Ships In most cases commercial ships on which automated instrumenta-tion is installed. Also called Ships Of Opportunity (SOOP)
OSD
6, 491–524, 2009Sensors and instruments for
carbon measurements
U. Schuster et al.
Title Page
Abstract Introduction
Conclusions References
Tables Figures
◭ ◮
◭ ◮
Back Close
Full Screen / Esc
Printer-friendly Version
Interactive Discussion
Fig. 1.Schematic of the oceanic carbon cycle, including air-sea flux, biological pump, physical pump and dissolution of carbonates.