EPICE-HIV: An Epidemiologic
Cost-Effectiveness Model for HIV Treatment
Björn Vandewalle1, Josep M. Llibre2, Jean-Jacques Parienti3, Andrew Ustianowski4, Ricardo Camacho5, Colette Smith6, Alec Miners7, Diana Ferreira1, Jorge Félix1*
1Exigo Consultores, Lisbon, Portugal,2Fundació Lluita contra la SIDA, Hospital Universitari Germans Trias i Pujol, Universitat Autònoma de Barcelona, Barcelona, Spain,3Department of Clinical Research and Biostatistics, Côte de Nacre University Hospital, Caen, France,4Regional Infectious Disease Unit, North Manchester General Hospital, Manchester, United Kingdom,5Rega Institute for Medical Research, Katholieke Universiteit Leuven, Leuven, Belgium,6Department of Infection and Population Health, University College London, London, United Kingdom,7Department of Health Services Research and Policy, London School of Hygiene and Tropical Medicine, London, United Kingdom
Abstract
The goal of this research was to establish a new and innovative framework for cost-effec-tiveness modeling of HIV-1 treatment, simultaneously considering both clinical and epide-miological outcomes. EPICE-HIV is a multi-paradigm model based on a within-host micro-simulation model for the disease progression of HIV-1 infected individuals and an agent-based sexual contact network (SCN) model for the transmission of HIV-1 infection. It includes HIV-1 viral dynamics, CD4+T cell infection rates, and pharmacokinetics/pharma-codynamics modeling. Disease progression of HIV-1 infected individuals is driven by the interdependent changes in CD4+T cell count, changes in plasma HIV-1 RNA, accumulation of resistance mutations and adherence to treatment. The two parts of the model are joined through a per-sexual-act and viral load dependent probability of disease transmission in HIV-discordant couples. Internal validity of the disease progression part of the model is assessed and external validity is demonstrated in comparison to the outcomes observed in the STaR randomized controlled clinical trial. We found that overall adherence to treatment and the resulting pattern of treatment interruptions are key drivers of HIV-1 treatment out-comes. Our model, though largely independent of efficacy data from RCT, was accurate in producing 96-week outcomes, qualitatively and quantitatively comparable to the ones observed in the STaR trial. We demonstrate that multi-paradigm micro-simulation modeling is a promising tool to generate evidence about optimal policy strategies in HIV-1 treatment, including treatment efficacy, HIV-1 transmission, and cost-effectiveness analysis.
Introduction
As a result of the introduction of increasingly potent and safe anti-retroviral therapy (ART), over the last decade HIV-1 infection has largely become a manageable disease, with mortality rates approaching those of the general population in many countries [1–3]. Similar to other
OPEN ACCESS
Citation:Vandewalle B, Llibre JM, Parienti J-J, Ustianowski A, Camacho R, Smith C, et al. (2016) EPICE-HIV: An Epidemiologic Cost-Effectiveness Model for HIV Treatment. PLoS ONE 11(2): e0149007. doi:10.1371/journal.pone.0149007
Editor:Dimitrios Paraskevis, University of Athens, Medical School, GREECE
Received:August 6, 2015
Accepted:January 25, 2016
Published:February 12, 2016
Copyright:© 2016 Vandewalle et al. This is an open access article distributed under the terms of the
Creative Commons Attribution License, which permits unrestricted use, distribution, and reproduction in any medium, provided the original author and source are credited.
pharmaceutical drugs, before marketing authorization, efficacy and safety profiles of new anti-retroviral regimens are usually investigated exclusively in clinical trial settings.
Most current clinical trials on HIV-1 ART follow a predefined schedule of follow-up visits rarely spaced more than 2 to 3 months apart, with quite rapid confirmation of virologic failure and drug withdrawal after initial detection [4–7]. Common clinical trial efficacy endpoints and their algorithms (e.g. the percentage of virologically suppressed patients at a certain time win-dow, determined by the FDA Snapshot algorithm) are crucially dependent on these pre-speci-fied follow-up protocols [4,5,7,8]. International HIV-1 treatment guidelines, however, suggest follow-up visits for plasma HIV-1 RNA viral load assessment every 3 to 6 months (with more frequent monitoring only at the start of ART) and confirmation of virologic failure 1 to 2 months later [9]. Moreover, in clinical practice, much heterogeneity tends to be observed with respect to the monitoring of ART, and subjects on stable and suppressive regimens are commonly seen every 6 months [10,11].
Despite efforts to raise patient´s adherence [12–16], in clinical practice it continues to be lower in comparison to clinical trials [17,18]. For many patients it may be quite difficult to maintain a high level of adherence, necessary to achieve durable viral suppression, over the life-time course of a chronic disease [19–23]. Suboptimal adherence not only limits the effec-tiveness of therapy in terms of viral suppression, but also facilitates the replication and selec-tion of resistant mutant viral strains, often limiting subsequent ART opselec-tions [24,25]. HIV resistance drug resistance has further become a relevant public health issue, as HIV-1 resis-tance mutations can be transmitted to other individuals [26].
Due to the heterogeneity observed in real-life monitoring schedules and adherence patterns, basing cost-effectiveness models for HIV-1 treatment mainly on the efficacy observed in clini-cal trials has the potential of leading to biased estimates of true effectiveness. Moreover, for drugs whose public use has only recently been authorized, little to no data might be available from observational studies, further restricting modeling options.
State of the art cohort and micro-simulation cost-effectiveness models for HIV-1 treatment typically focus on clinical outcomes such as viral suppression, life expectancy, causes of death, opportunistic infections and time on treatment [27–31]. Many of these models lack the ability of quantifying the impact of different treatment regimens and adherence behavior on the trans-mission of HIV-1 and HIV-1 drug resistance [27–31].
Some models that include transition modules tend to do so in a mostly deterministic, non-dynamic nature, making use of systems of ordinary differential equations. These models are capable of distinguishing between different populations (uninfected, infected, heterosexual, homosexual, injection drug users), linking them through pathway-dependent infection rates, but lack the ability to capture important population behavioral heterogeneity [27,29,31].
In this paper, we present EPICE-HIV, an epidemiologic cost-effectiveness model for HIV-1 treatment, designed to produce qualitatively and quantitatively credible results without overly depending on outcomes of clinical trials and observational studies. EPICE-HIV is a multi-para-digm model based on a within-host micro-simulation for the disease progression of HIV-1 infected individuals and an agent-based sexual contact network (SCN) model for the transmis-sion of HIV-1 infection (transmistransmis-sion module). The two parts of the model are joined through a per-sexual-act, plasma HIV-1 RNA viral load dependent probability of HIV-1 transmission in serodiscordant couples and a CD4+T cell count dependent mortality rate.
Since the algorithm driving the HIV-1 transmission module has been described and vali-dated previously in the context of sexually transmitted diseases [32], this paper will focus on the within-host model of EPICE-HIV, in which disease progression is driven by adherence to ART and the interdependent changes in CD4+T cell counts and plasma HIV-1 RNA levels. For vali-dation purposes, a simulation study was set up to investigate the effectiveness of once daily
Reported Outcomes through Week 96. ICAAC; 2014 September 5–9, 2014; Washington DC, USA). Patient level data access was granted by Gilead for the purpose of the present analysis. Gilead's contact information for the data:[email protected].
Funding:Gilead contracted with Exigo for the development of the model and its validation using STaR clinical trial data. Gilead also made STaR study data available for external model validation. The funders had no role in study design, data collection and analysis, decision to publish, or preparation of the manuscript. Exigo Consultores provided support in the form of salaries for authors BV, DF, JF, but did not have any additional role in the study design, data collection and analysis, decision to publish, or preparation of the manuscript. The specific roles of these authors are articulated in the‘author contributions’section.
treatment with rilpivirine 25mg (RPV), emtricitabine 200mg (FTC) and tenofovir DF 245mg (TDF) as initial ART, mimicking the conditions and population of the STaR study [5,33].
Material and Methods
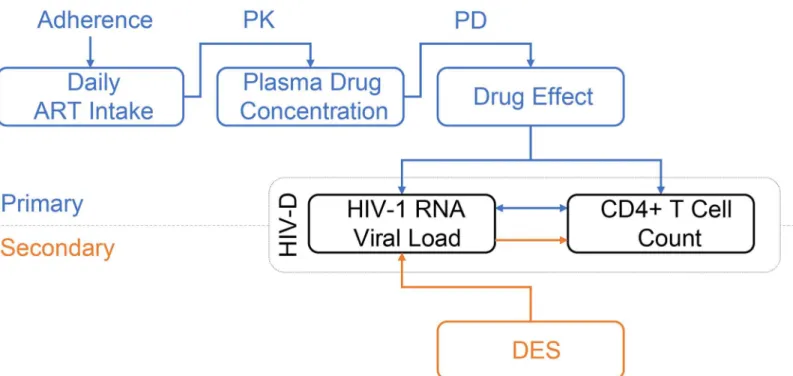
In the within-host model (Fig 1), adherence to the ART regimen of primary interest is modeled using a binary autoregressive model, assuming adherence on any given day is conditional on adherence on the previous day. A per-drug, one-compartment, pharmacokinetics model (PK) followed by a pharmacodynamics model (PD), link adherence to a progressive HIV-1 dynam-ics model (HIV-D) generating time dependent plasma concentrations of free virus and unin-fected and inunin-fected CD4+T cells. Treatment regimens of secondary interest are modeled connecting a previously published discrete event simulation (DES) model for HIV-1 treatment [34] to the HIV-D model.
Basic HIV-1 Dynamics Model
The HIV-D model consists of four populations: uninfected CD4+T cells (T1), productively infected activated CD4+T cells (T2), latently infected resting CD4+T cells (L) and HIV-1 viri-ons (V) [35]. Initially, only uninfected target CD4+T cells (T1) and HIV-1 virions (V) are pres-ent in the system (Table 1).
HIV-1 virions can infect target CD4+T cells, a process modeled through a commonly used
“mass-action”termkT1VT1, withkT1the target CD4
+T cell infection-rate by free virus. Upon
infection, a small fractionα
Lof CD4+T cells will result in latently infected CD4+T cells (L), not actively producing HIV-1 virions. The remaining fraction of infections results in
Fig 1. Diagram of the within-host model for disease progression of HIV-1 infected individuals.For the treatment regimen of primary interest (blue diagram), the adherence model dictates the daily intake of ART. Through a pharmacokinetic (PK) and pharmacodynamic (PD) model, the plasma drug concentration and drug effect are determined. Drug effect influences the inter-dependent and time-evolving plasma HIV-1 RNA level and CD4+ T cell count in the basic HIV-1 dynamics model (HIV-D). For treatment regimens of secondary interest (orange diagram), a discrete event simulation model (DES) determines the plasma HIV-1 RNA level over time. Using the dynamics of the HIV-D model, CD4+ T cell counts are updated accordingly.
productively infected CD4+T cells (T2). Latently infected CD4+T cells are activated into pro-ductively infected cells at a constant rateα
L.
All cells have a finite lifespan, determined by death-ratesd T1;
d T2and
δ
Lfor uninfected, pro-ductively infected and latently infected CD4+T cells, respectively. For HIV-1 virions, the death-rate is given byδV. Source rates of uninfected CD4+T cells (f
ssT1) and HIV-1 virions
(fppvT2), drug potency (ε) and persistent low level viremia (VMin) are discussed further on in this section.
The following system of ordinary differential equations, of which a graphical illustration is given inFig 2, represents the resulting rate of change in the concentration of cells for each of Table 1. Basic HIV-D model populations and initial values [35].
Population Description Initial value
T1 Uninfected CD4+ T cells 1,000 cells/mm3
T2 Productively infected CD4+ T cells 0 cells/mm3
L Latently infected CD4+ T cells 0 cells/mm3
V HIV-1 virions‡
0.001 virions/mm3
‡
Corresponding to 2 plasma HIV-1 RNA copies/mL.
doi:10.1371/journal.pone.0149007.t001
Fig 2. Stock and flow diagram of the basic HIV-1 dynamics model, modified from Rong et al [35].Uninfected CD4+ T cells (T1) are produced at a rate
fssT1. Infected CD4+ T cells are produced at a ratekT1VT1, following mass-action kinetics between free virions (V) and uninfected CD4+ T cells. A small
fractionαLof infections results in latently infected resting CD4+ T cells (L). The remaining fraction results in productively infected activated CD4+ T cells (T2). Latently infected CD4+ T cells are activated into productively infected cells at a constant rate aL. Free virions are produced by productively infected CD4+ T cells at a rate fppvT2.
the four modelled populations:
dT1
dt ¼ fssT1 ð1
εÞk
T1VT1dT1T1
dT2
dt ¼ ð1aLÞð1εÞkT1VT1
d
T2T2þaLL
dL
dt ¼ aLð1εÞkT1VT1
d
LLaLL
dV
dt ¼ fppVT2dVVþdVVMin:
ð1Þ
Disease Progression. During the first stage of HIV-1 infection (acute infection), in the absence of treatment, large amounts of virus are being produced, destroying CD4+T cells in the process. As a result, CD4+T cell counts drop rapidly and viral load levels spike. At the end of this stage CD4+T cell counts begin to increase, but do not return to pre-infection levels. At the same time, plasma viral loads drop back down and settle into a viral set-point after a couple of months, remaining at more stable levels thereafter. HIV-1 infection then moves into a clini-cal latency stage, in which HIV-1 continues reproducing, but at much lower levels than during the acute stage. This stage, though very variable, typically lasts about 8–10 years and is charac-terized by a slow depletion of CD4+T cells and late stage increase in plasma viral load [36–38]. Over time the efficiency in viral production increases due to different factors, including the progressive loss by the immune system of the ability to contain viral production. In the model, this is implemented by applying a time-dependent replication increase factor (fp) to the initial viral production rate (pv) of productively infected CD4+T cells (T2) [39]. Furthermore, since HIV-1 infection is known to eventually exhaust the body’s capacity to produce new uninfected CD4+T cells, a time-dependent capacity reduction factor (fs) is also applied to the base CD4+T cell source rate (sT1) [39].
Both adjustment factors (fpandfs) depend on a measure for the total viral burden accumu-lated over time since the start of infection, as
fs ¼ ð1þQÞ
1
fp ¼ 1þpQ
ð2Þ
whereQrepresents a Weibull cumulative distribution function on the viral burdenVb, the area under the curve of the time evolving virion concentrationVwith respect to reference valueVref[39]:
QðVbÞ ¼ 1exp
Vb s
k
" #
VbðtÞ ¼
1
Vref
ðt
0
VðxÞdx:
ð3Þ
The effect of specific incumbent period determinants that may affect disease progression (e.g. age at infection, the presence of other sexually transmitted diseases) have not been included in the current paper and will be addressed in future work.
potencyεrepresents the percentage of new cell infections inhibited and acts upon the
mass-action termkT1VT1by reducing the ratekT1at which uninfected target CD4
+T cells are infected
by free virus [35].
The analysis of viral decay following initiation of ART shows that plasma HIV-1 RNA levels typically decline in three distinct phases [35]. In the model, to simulate the second phase decay, a population of latently infected CD4+T cells was considered, with a much lower decay rate than the productively infected CD4+T cells.
Persistent Low Level Viremia. Studies with especially sensitive assays [40] have demon-strated that the second phase decay typically brings plasma viral loads down to a new quasi-steady state below the 50 plasma HIV-1 RNA copies/mL threshold, with an average of persis-tent low level viremia of around 3 copies/mL [41]. This could reflect the release of viruses from other stable reservoirs, potentially outside of the plasma, which are unaffected by treatment intensification. To accomplish a persistent low level of viremia in the model, an extra term
δ
VVminwas added to the rate of change in concentration of virions, representing the potential inflow of free viruses from external reservoirs.
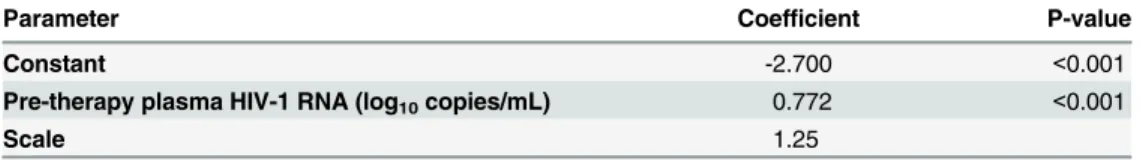
The level of persistent low viremia correlates well with pre-therapy plasma HIV-1 RNA lev-els, more than with specific treatment regimens, even though some reports have linked PI with higher rates of low level viremia than NNRTI [42]. Moreover, longitudinal analysis revealed no significant decline in the level of persistent viremia over time (60–110 weeks), while on sup-pressive ART. As a result of this, the HIV-D model assumes that the level of persistent low-viremia under ART (represented by the parameterVmin) remains constant over time and depends only on pre-therapy plasma HIV-1 RNA levels, through a log-normal model fitted to data presented in Maldarelli et al. (2007) [41]. The results of this analysis are presented in
Table 2and show a highly significant effect of pre-therapy plasma HIV-1 RNA levels (log10 copies/mL) on persistent low-level viremia.
Between-Patient Variability. Between-patient variability in cell concentrations in plasma has been introduced by exploiting the stable-state solution of the untreated (ε= 0), disease
pro-gression free (fp= 1 andfs= 1) system of ordinary differential equations. For untreated individ-uals, the contribution of the latently infected CD4+T cell population to plasma HIV-1 RNA levels is negligible. Ignoring the presence of latently infected CD4+T cells, two key parameters of the HIV-D model, the HIV-1 infection rate of CD4+T cells (kT1) and the viral production
rate (pV), can be written as a function of the stable-state plasma concentrations of target CD4+ T cells (T1) and HIV-1 virions (V), as
kT1 ¼
sT1 d
T1
T1
VT1
pV ¼
d VdT2
kT1
T1
:
ð4Þ
Table 2. Log-normal model parameter estimates for on-therapy plasma HIV-1 RNA levels as a function of baseline pre-therapy plasma HIV-1 RNA levels.
Parameter Coefficient P-value
Constant -2.700 <0.001
Pre-therapy plasma HIV-1 RNA (log10copies/mL) 0.772 <0.001
Scale 1.25
Both productively infected activated and latently infected resting CD4+T cells represent only a residual fraction of the total CD4+T cell population. As a result, the total CD4+T cell plasma concentration (T) can be approximated by the target CD4+T cell population (TffiT1). Between-patient variability in plasma cell concentrations over time can then be controlled by allowing for variability in model parameterskT1andpV, substituting the desired viral set-point
HIV-1 virion (Vs) and total CD4+T cell (Ts) concentrations forVandT1in the equations
above.
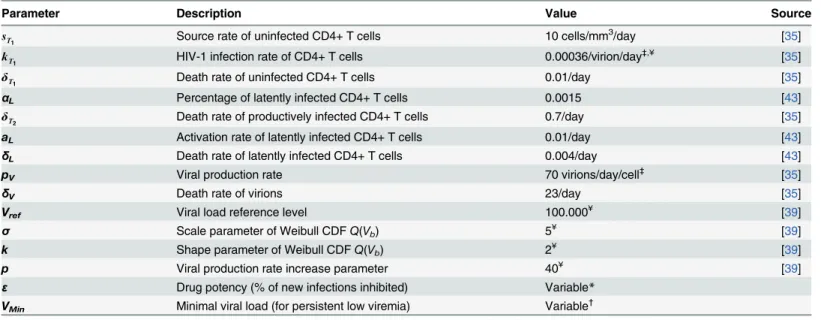
Model Parameters. All base parameters relevant to the HIV-D model can be found in
Table 3. Most parameters were initially taken from the literature [35,39,43]. Some were recali-brated to suit the purpose of modeling HIV-1 disease progression.
Many different values can be found in the literature for the viral production rate (pV) and the HIV-1 infection rate of CD4+T cells (kT1). For the base-case examples, presented
through-out the paper, the viral production rate (pV) wasfixed [35]. The HIV-1 infection rate (kT1) was
calibrated, from within a realistic range of values [35], as for stable-state CD4+T cells count and HIV-1 viral load to present suitable values (Fig 3). In the section on between-patient vari-ability, it has been explained how these two parameters can be varied to introduce variability in stable-state CD4+T cell counts and HIV-1 viral loads for different patients.
The remaining parameters that were subject to recalibration are related to the HIV-1 disease progression module. The conceptual model for disease progression was taken from a paper on co-infection with HIV-1 and tuberculosis, based on a different HIV-1 dynamics model [39]. Recalibration of the model parameters was necessary to result in a realistic CD4+ T cell decline and HIV-1 viral load increase over time (Fig 3 in theresultssection).
Disease Monitoring. Not all individuals in the simulated population are forced to perform regular HIV-1 testing. For those that do, HIV-1 testing is assumed to follow a Poisson process, Table 3. Parameter values used in the basic HIV-D model.
Parameter Description Value Source
sT
1 Source rate of uninfected CD4+ T cells 10 cells/mm
3
/day [35]
kT
1 HIV-1 infection rate of CD4+ T cells 0.00036/virion/day
‡,¥ [35]
δT
1 Death rate of uninfected CD4+ T cells 0.01/day [35]
αL Percentage of latently infected CD4+ T cells 0.0015 [43]
δT
2 Death rate of productively infected CD4+ T cells 0.7/day [35]
aL Activation rate of latently infected CD4+ T cells 0.01/day [43]
δL Death rate of latently infected CD4+ T cells 0.004/day [43]
pV Viral production rate 70 virions/day/cell
‡
[35]
δV Death rate of virions 23/day [35]
Vref Viral load reference level 100.000¥ [39]
σ Scale parameter of Weibull CDFQ(Vb) 5¥ [39]
k Shape parameter of Weibull CDFQ(Vb) 2¥ [39]
p Viral production rate increase parameter 40¥ [39]
ε Drug potency (% of new infections inhibited) Variable*
VMin Minimal viral load (for persistent low viremia) Variable
†
‡
See“between-patient variability”; *See“PK/PD modeling”;
†
See“persistent low viremia”; ¥Recalibrated
with exponential times between consecutive tests. Upon being diagnosed, a fraction of infected individuals may choose not to seek treatment. For those who do seek treatment, regular medi-cal visits are programmed in which CD4+T cell counts and plasma HIV-1 RNA levels are monitored until a patient is considered eligible for treatment (e.g.: CD4+T cell count below 500 or 350 cells/mm3[9,44]).
The model is completely flexible with respect to disease monitoring parameters, making it possible to investigate the effect on results of different hypotheses in terms of patients’ willing-ness to test, willingwilling-ness to be treated, monitoring frequency and treatment eligibility.
Primary Treatment Regimen Model
Adherence to Therapy. A quantitative relationship can be observed between the duration of the longer treatment interruption and the average adherence level [45], in which treatment interruptions of 30 or more days are not unusual for patients with an average adherence between 40% and 60%. Furthermore, there is a differential impact of adherence and treatment interruptions on the risk of virologic rebound (>400 plasma HIV-1 RNA copies/mL) when comparing NNRTI- based ART to ritonavir-boosted (PI/r) based ART [45]. For NNRTI, due to their long terminal pharmacokinetic tail, at low-to-moderate adherence levels, sustained treatment interruptions pose a greater risk of virologic rebound than a comparable number of interspersed missed doses. On the other hand, PI/r average adherence rather than consecutive missed doses is found to be associated with virologic rebound. In raltegravir-based regimens longer treatment interruption and average adherence were both independently associated with virological failure [46]. Lastly, and most importantly, the quantitative relationship between the longer treatment interruption and the average adherence level seems to depend little on specific treatment regimens [45].
The correct modeling of the daily adherence process, in order to capture the delicate rela-tionship between treatment interruptions and average adherence, is of utmost importance. Assuming adherence is a memoryless process may be misleading because the probability of a treatment interruption of 30 or more days, related to an average adherence of 50%, is almost non-existing. As such, in EPICE-HIV, adherence is modeled using a binary autoregressive model, assuming adherence on any given day is a random process, conditional on adherence on the previous day.
It depends on two key parameters: the probability of taking drugs on the current day, given drugs were skipped the previous day (p10) or not (p11). For each individual in the simulated
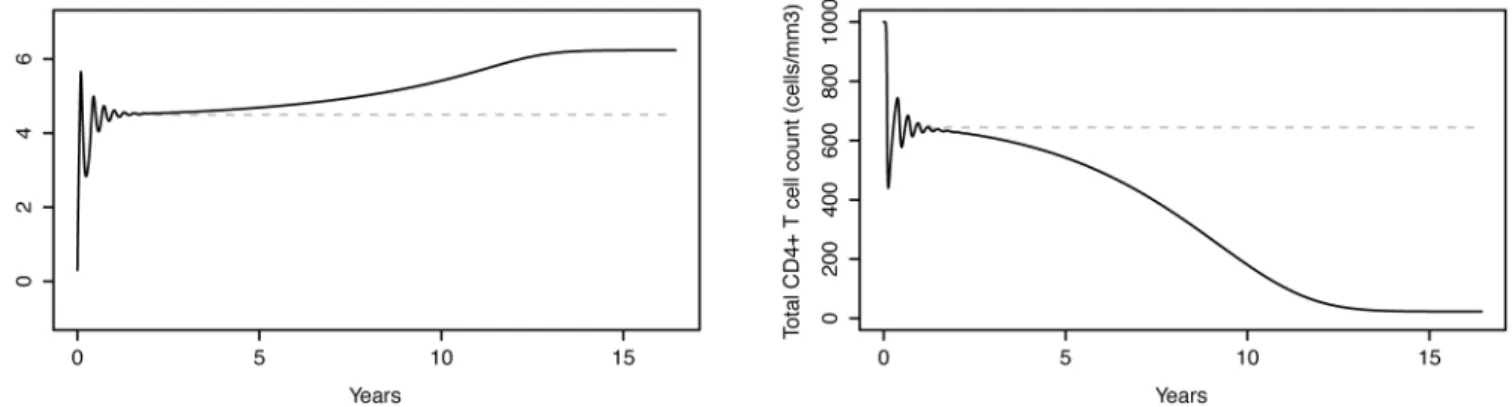
Fig 3. Evolution of plasma HIV-1 RNA levels and CD4+ T cell counts in an untreated subject.Left: Plasma HIV-1 RNA levels as a function of time, simulated by the HIV-D model accounting for disease progression. Right: corresponding CD4+T cell counts. The model simulates the 3 typical stages of HIV-1 infection: acute infection, clinical latency and AIDS phase. Dashed grey lines represent the HIV-D model without disease progression, the stable-state solution of which is exploited to introduce between-patient variability in plasma cell concentrations.
population, an expected average adherence level (αAdh) is sampled from a pre-defined
empiri-cal or theoretiempiri-cal population-level distribution. Given this adherence level, the parametersp10 andp11are then determined randomly for each individual as
p10 Uð0:10; 1:00Þ ifa
Adh0:80;
p10 U 0;min 0:25;
a Adh
1 a Adh
ifa
Adh0:80;
p11 ¼1þp10 p10
a Adh
:
ð5Þ
Here,p10is sampled from one of two possible continuous uniform distributions, conditional on the expected average adherence level being inferior or superior to 80%. The uniform distri-butions were calibrated as to result in a qualitatively representative simulated relationship between the longer treatment interruption and average adherence [45]. No formal calibration techniques were used.p11Is determined as a function ofp10andαAdhto ensure that the adher-ence level of each individual converges over time to the pre-specified average adheradher-ence level
αAdh.
PK/PD Modeling. Normalized drug concentrationsCn(t) =C(t)/IC50(withC(t) the drug concentration andIC50the 50% inhibitory concentration against wild-type virus) are modeled as a function of time as in [47] using the impulsive differential equation:
dCn
dt ¼ wCCn; t6¼ti; ðno dose takenÞ; CnðtþÞ ¼CnðtÞ þCn;sd; t¼ti; ðdose takenÞ:
ð6Þ
Normalized concentrationCn(t) is assumed to increase instantaneously by a single amount (Cn,sd) every time-pointτ
i(fori= 1,2,. . .) a dose is taken, while in between dosesCn(t) decays exponentially with a certain ratewC. For most commercially available antiretroviral drugs, val-ues are available for their 50% inhibitory concentration (IC50), plasma half-life (t1/2), required dosing interval (δτ=τi+1−τi) and related maximum concentration (Cmax). These values allow
forwCandCn,sdto be determined as follows:
wC ¼
lnð2Þ
t1=2
;
Cn;sd ¼
Cmax
IC50ð1e
wCdtÞ:
ð7Þ
The drug-potencyεwtagainst wild-type HIV-1 virus for a given drug is modeled as a
func-tion of its normalized concentrafunc-tion using a Hill type dose-response curve [48]:
1ε
wt ¼
1
Cm n þ1
; ð8Þ
representing the fraction of new infections unaffected by the drug. A logarithmic measure of inhibitionFwtcan be defined from this equation, as
Fwt ¼ log
ε
wt
1ε
wt
¼ mlogðCnÞ: ð9Þ
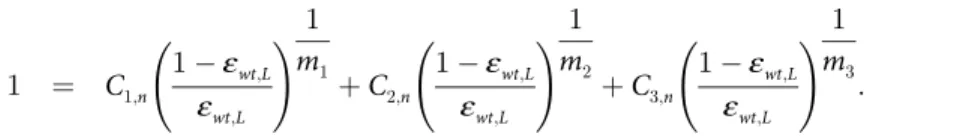
For combination therapy, drug potency interaction effects can readily be modeled, starting from the individual normalized drug concentrations, through Loewe additivity or Bliss inde-pendence [49]. Loewe additivity assumes drugs have similar mechanisms or compete for the same binding site. For a three-drug version of the Loewe additivity model, drug potencyε
wt,L can be described by the equation:
1 ¼ C1;n
1ε
wt;L
ε
wt;L
!
1
m1
þC2;n
1ε
wt;L
ε
wt;L
!
1
m2
þC3;n
1ε
wt;L
ε
wt;L
!
1
m3
: ð10Þ
Bliss independence assumes independent action between drugs, such that the combined effectε
wt,Bof triple combination therapy can be written as the product of the fractions unaf-fected by each individual drug:
1ε
wt;B ¼
1
Cm1
1;nþ1
1
Cm2
2;nþ1
1
Cm3
3;nþ1
: ð11Þ
It predicts higher inhibition than Loewe additivity, especially at clinical drug concentrations. Inhibition less than the Loewe prediction represents antagonism, whereas a combined effect significantly greater than the Bliss prediction represents synergy.
The inhibitory effect of drug combinations are characterized on a spectrum defined by two states, independent inhibition (Bliss independence) and competitive binding (Loewe additiv-ity), with synergistic and antagonistic interactions at either extreme [49], as
Fwt;DI ¼ Fwt;LþDI ðFwt;BFwt;LÞ: ð12Þ
whereFwt,DI,Fwt,LandFwt,Bfollow the definition of the previously introduced logarithmic mea-sure of inhibition. Here,DIrepresents an index that quantifies the degree of independence, withDI= 0 corresponding to Loewe additivity andDI= 1 to Bliss independence.
The inhibitory potential at clinical drug concentrations for pairwise and triple combinations of 19 commonly used antiretrovirals were analyzed, allowing for quantitative comparison of antiviral activity of different drug regimens at expected plasma concentrations [49]. The results of this analysis in terms ofDIindex estimates can be used to determine the combined inhibi-tion effect of different drug regimens in the spectrum defined by Bliss independence and Loewe additivity.
A summary of key PK/PD modeling quantities can be found inTable 4.
Table 4. Key PK/PD modeling quantities.
Quantity Description
C(t) Drug concentration, as a function of time
IC50 50% Inhibitory concentration (against wild-type virus)
Cn(t) Normalized drug concentration, as a function of time
Cn,sd Instantaneous single dose increase in normalized drug concentration
wC Exponential decay rate of normalized drug concentration εwt Drug potency (against wild-type virus),Cndependent
Fwt Logarithmic function of inhibition (against wild-type),Cndependent
m Slope parameter of logarithmic function of inhibition (Fwt)
DI Degree of independence
Loewe additivityDI= 0 Bliss independenceDI= 1
Disease Monitoring. Viral suppression is checked for the first time at 1–2 months for a patient starting a new ART and every 4–6 months thereafter, following international treatment guidelines [9,44]. If HIV-1 viral load is suppressed (<50 plasma RNA copies/mL), regular medical follow-up visits are programmed for plasma HIV-1 RNA and CD4+T cell count moni-toring. If on any of these medical visits plasma HIV-1 RNA is no longer suppressed, a confir-mation visit is scheduled (e.g. one month after [9]). If plasma HIV-1 RNA continues non-suppressed, the patient is defined as having a virologic failure and moves to a subsequent ment line. If plasma HIV-1 RNA is suppressed again, the patient maintains its current treat-ment regimen and returns to regular medical follow-up visits. Any time during the treattreat-ment, a patient can switch a regimen due to adverse events or other non-virologic reasons. Time to event distributions are considered for these regimen switches.
Costs. Daily costs for each of the components in the modeled ART are quantified indepen-dently and accumulated continuously (dependent on adherence) for ART cost identification purposes. For non-ART costs (e.g. non-ART medication, examinations and laboratory tests) the model follows the same rules as for secondary treatment regimens discussed below. The same holds for the simulation of hospitalizations and corresponding costs.
Secondary Treatment Regimens Model
Suppressive Therapy. Modeling of suppressive therapy for regimens of secondary interest is based on an adaptation of a DES-based cost-effectiveness model [34]. Conditional on a num-ber of patient-specific characteristics (age, gender, regimen characteristics, resistance level, etc.) the time to the occurrence of 5 clinical events is estimated:
• Viral suppression (plasma HIV-1 RNA<50 copies/mL)
• Regimen switch due to virologic failure
• Regimen switch not due to virologic failure (e.g.: toxicity)
• Resistance development
• Hospitalization
This section provides a concise description of the modeling steps. Further details can be found in the original publication [34].
Weibull distributions are considered for the estimation of event times for each of the clinical events. Upon the occurrence of any event (except hospitalization), time to occurrence of all events is updated using a conditional distribution approach. Virologic failure is defined as a confirmed plasma HIV-1 RNA level>50 copies/mL after initial viral suppression or unreached viral suppression 6 months after therapy initiation.
Once the highest resistance class is reached upon line switch, individuals start non-suppressive therapy.
Resistance levels are grouped into four classes, according to the inverted Genotypic Sensitiv-ity Score [34,50] and it is assumed that patients can move only to an adjacent, higher resistance class because resistance is archived in cellular DNA. Upon reaching the time to (new) resis-tance development, resisresis-tance levels are sampled uniformly from within each class. Adherence evolves over time based on a generalized linear model. Regimen characteristics are updated on occurrence of line and regimen switches.
Non-Suppressive Therapy. Upon reaching non-suppressive therapy, the plasma HIV-1 log10RNA level is set to a value sampled from a normal distribution with parameters calibrated on observational data [31]c. After this, modeling of CD4+T cell counts and plasma HIV-1 RNA levels is returned back to the HIV-D model. As a result of the increasing total viral bur-den, plasma HIV-1 RNA levels keep increasing whereas CD4+T cell counts start dropping to AIDS-defining levels, in turn increasing mortality risk.
Costs. The model considers monthly ART and non-ART costs, both based on generalized linear models, which are updated upon regimen switch and changes in resistance level. Monthly non-ART costs include in addition, among others, physician appointments, exams and laboratory tests [34].
Mortality and Quality of Life
Before, it was argued how, during the acute stage of the infection CD4+T cell counts initially drop and then increase rapidly, however never returning to pre-infection levels. If untreated, the subsequent clinical latency stage of the infection is characterized by a slow depletion of CD4+T cells until reaching AIDS-defining levels, typically about 8–10 years after seroconver-sion. If treated, CD4+T cell counts grow slowly, but again usually do not reach pre-infection levels.
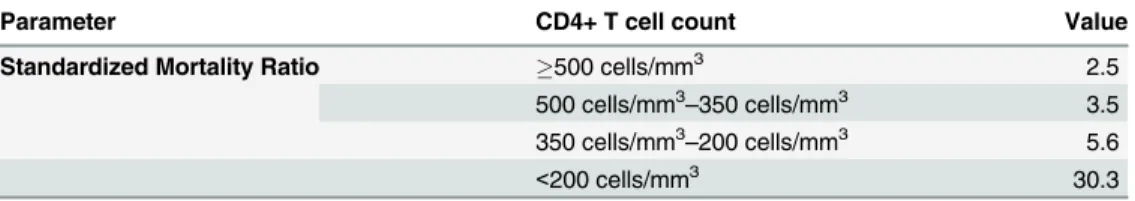
Studies show that mortality is CD4+T cell count dependent and, even after ART initiation, remains higher in HIV-1 infected individuals than in the general population [51]. For HIV-1 infected individuals with CD4+T cell counts below 200 cells/mm3, a 30-fold increase in (age and gender standardized) mortality rates has been estimated, whereas for patients with CD4+T cell counts above 500 cells/mm3, this is reduced to a 2.5-fold increase [51].
At model initiation, the life expectancy of each simulated individual is sampled from mor-tality tables of the general population. Instantaneous HIV-1 infection related excess mormor-tality as compared to the general population is implemented using CD4+T cell count-dependent standardized mortality ratios (SMR,Table 5) [51]. The model is completely flexible with respect to SMR, easily adaptable as more data on the true impact of life expectancy is acquired. In order to keep the total population-size constant, each time an individual dies, a new, unin-fected individual is generated, aged 13-years old (considered the minimum age for onset of sex-ual availability) [32].
Table 5. Standardized mortality ratios for excess mortality due to HIV-1 infection.
Parameter CD4+ T cell count Value
Standardized Mortality Ratio 500 cells/mm3 2.5
500 cells/mm3–350 cells/mm3 3.5 350 cells/mm3–200 cells/mm3 5.6
<200 cells/mm3 30.3
Given the variable nature of CD4+T cell counts (disease progression and ART dependent) in the model, it is easily understood that CD4+T cell counts are one of the main drivers of mor-tality in EPICE-HIV.
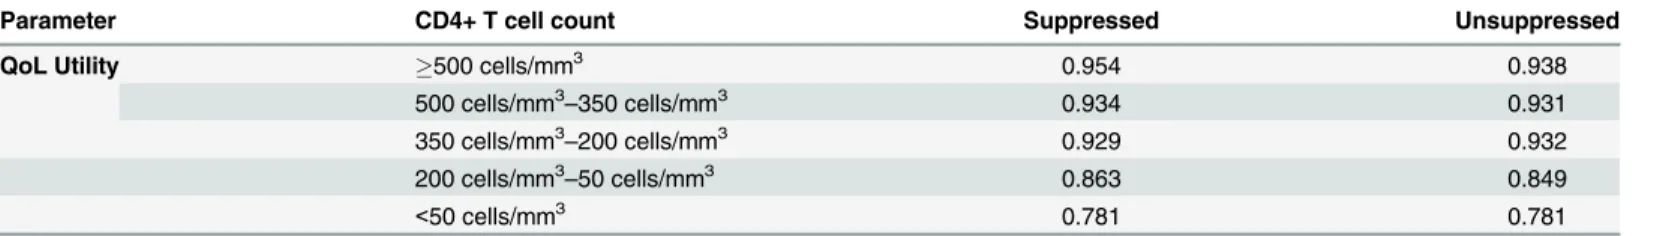
Similarly, CD4+T cell-dependent quality of life (QoL) utilities are considered for cost-effec-tiveness modeling in terms of quality adjusted life years (QALY). Two sets of utilities are con-sidered: one for plasma HIV-1 RNA suppressed individuals, and another for unsuppressed individuals (Table 6) [49].
External Model Validation
Due to the complexity and comprehensiveness of the EPICE-HIV model as a whole, compo-nents that have been previously validated or described in the literature are not presented nor discussed. Though constituting a limitation to the current paper, validation within EPICE-HIV of these model components will be addressed in future work. The secondary treatment regimen part of the within-host model and the transmission module have previously been discussed in detail within comparable contexts [32,34]. As such, the present analysis focuses on the HIV-D model and the implementation of the primary treatment regimen in the within-host model.
To strengthen the external validity of the HIV-D model, a simulation study was performed to allow comparisons to the data from the RPV/FTC/TDF arm of the STaR study [33]. The STaR study was a phase 3b, randomized, multicenter, international, open-label, 96-week clini-cal trial comparing the safety and efficacy of two single-tablet regimens, RPV/FTC/TDF and EFV/FTC/TDF, in 786 ART-naive, HIV-1 infected patients. Full validation against STaR study results, also including once-daily treatment with coformulated EFV/FTC/TDF will be dis-cussed in an upcoming paper. In future work, the validation of the model against data from observational studies will also be considered.
The simulation consisted of 100,000 hypothetical infected individuals, initiating first-line ART with once-daily, coformulated RPV/FTC/TDF, using the same set of conditions in terms of baseline characteristics, clinical management and efficacy criteria of the STaR study [5]. We tested the hypothesis if the HIV-D model component of EPICE-HIV would be able to accu-rately produce 96-week percentages of virologically suppressed patients (as determined by the FDA Snapshot algorithm), qualitatively and quantitatively comparable to the percentages observed in the STaR study [33], and what effect alternative adherence distributions have on the results.
Results and Discussion
HIV-1 Dynamics Model
Disease Progression. As an independent module, in the absence of drug effect, the HIV-D model simulates CD4+T cell counts and plasma HIV-1 RNA levels as a function of time for Table 6. Quality of life utilities for cost-effectiveness modeling.
Parameter CD4+ T cell count Suppressed Unsuppressed
QoL Utility 500 cells/mm3 0.954 0.938
500 cells/mm3–350 cells/mm3 0.934 0.931
350 cells/mm3–200 cells/mm3 0.929 0.932
200 cells/mm3–50 cells/mm3 0.863 0.849
<50 cells/mm3 0.781 0.781
HIV-1 infected individuals that pass through the 3 typical stages of HIV-1 infection: acute infection, clinical latency and AIDS phase (Fig 3) [52].
The HIV-D model is capable of reproducing not only the acute stage of HIV-1 infection, but also the slow depletion of CD4+T cells and increase in viral load typical of the clinical latency stage. In the simulated example, after about 8 years from seroconversion, the CD4+T cell count steadily declines, reaching the value of 200 cells/mm3at 9.7 years after infection.
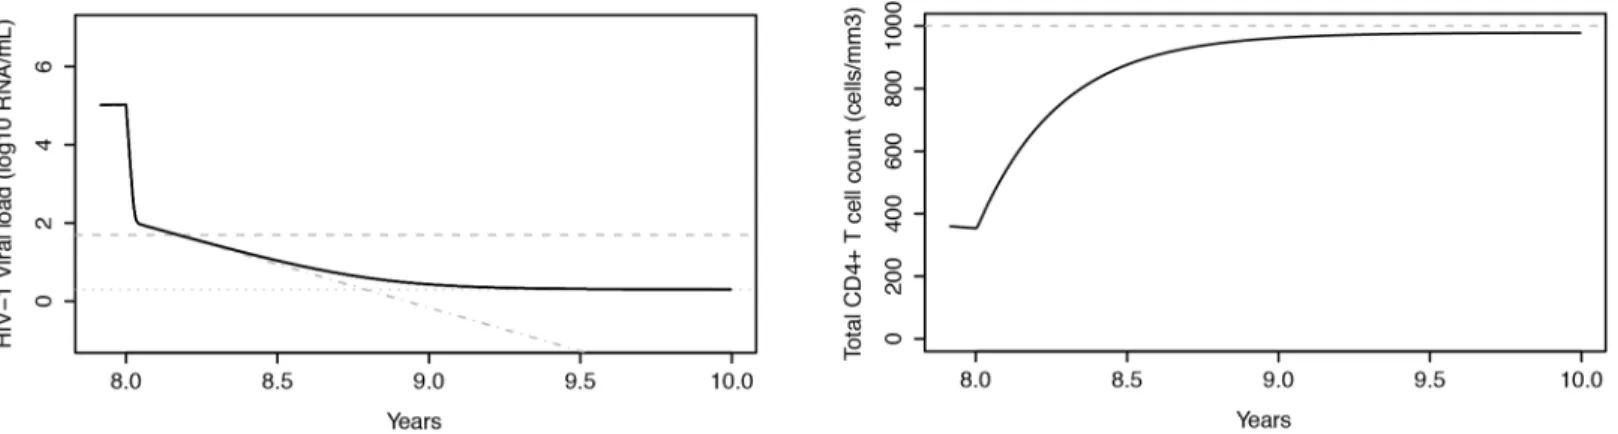
Drug Potency. InFig 4the evolution of the CD4+T cell count and plasma HIV-1 RNA levels is presented as a function of time for a patient starting ART 8 years after seroconversion with hypothetical continuous drug potencyε= 100%,.
After treatment initiation, the CD4+T cell count grows slowly, but does not reach the pre-infection level of 1000 cells/mm3. This is a consequence of the inclusion of disease progression in the model, as previously mentioned. The decline in plasma viral load follows the three phases described before. A sharp drop in viral load occurs within the first two weeks of ART, determined mainly by the decay rate of productively infected activated CD4+T cells (T2). Afterwards the viral load keeps declining, but at a much slower rate (decay rate of latently infected CD4+T cells). The threshold of 50 plasma HIV-1 RNA copies/mL is reached after 2 months, but can be adjusted depending on the family of antiretroviral drugs used. Viral persis-tence at a level of about 2 plasma HIV-1 RNA copies/mL (considered for this particular exam-ple) is set in approximately 1 to 1.5 years after treatment initiation.
The grey dashed-dotted line in the left-hand side graph ofFig 4represents the evolution of the viral load when the persistent low level viremia adjustment to the HIV-D model is ignored. The second-phase decline then takes the viral load to unreliable levels, demonstrating the need for explicit persistent low viremia modeling.
Primary Treatment Regimen
Adherence to Therapy. Using the binary first-order autoregressive adherence model,Fig 5shows there is not only a strong correlation between the theoretical desired average adherence and the final observed simulated average adherence, but there is also a relationship between the longer treatment interruption and the observed average adherence, quantitatively and qualita-tively comparable to the one found in Parienti et al. (2010) [45]. The simulation is based on a random sample of 100 hypothetical individuals followed for over a 1-year time period, with Fig 4. Evolution of plasma HIV-1 RNA levels and CD4+ T cell counts in a treated subject.Left: plasma HIV-1 RNA levels as a function of time, simulated by the HIV-D model with drug effect, when persistent (black line) and non-persistent (grey dashed-dotted line) low level viremia are considered. The horizontal grey dashed line corresponds to the common viral load detection threshold of 50 plasma HIV-1 RNA copies/mL, whereas the horizontal grey dotted line corresponds to a theoretically imputed persistent low level viremia of 2 plasma HIV-1 RNA copies/mL (considered for this particular example). Right: corresponding CD4+ T cell counts. Simulated treatment with hypothetical continuous drug potencyε= 100% starting at 8 years after seroconversion.
theoretical average adherence distribution: 30% with adherence below 80%; 20% with adher-ence between 80% and 90%; and 50% with adheradher-ence above 90% [45].
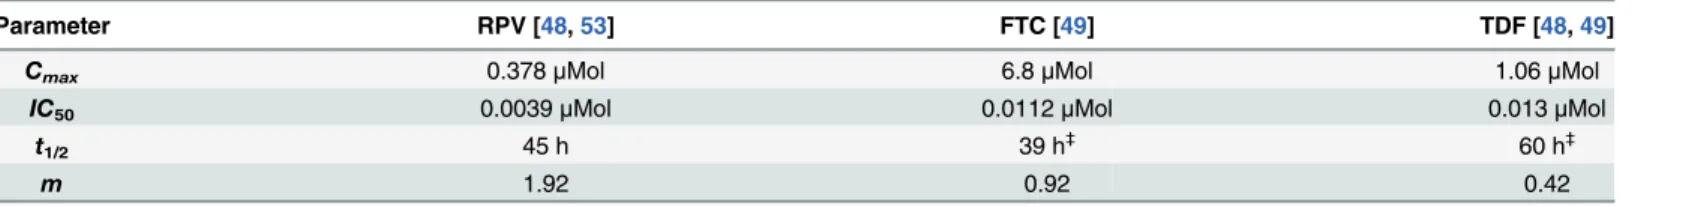
PK/PD Modeling. The results presented below focus on a once-daily, triple combination therapy with coformulated rilpivirine 25mg (RPV), emtricitabine 200mg (FTC) and tenofovir DF 245mg (TDF) and are based on PK parameters fromTable 7.
The logarithmic measure of inhibition (Fwt), was calculated as a function of drug concentra-tion (log-scale percentage of maximum concentraconcentra-tion,Fig 6) for RPV, FTC and TDF. At clini-cal concentrations, immediately to the left of the verticlini-cal grey dashed line, neither of the individual drugs attains a value larger than 5, suggested as a minimum threshold for successful HAART [46]. Predictions are also presented for the combined inhibition effect of RPV+FTC +TDF by the Bliss independence, Loewe additivity andDImodel. For theDImodel, a hypo-thetical index 0.5 of degree of independence was assumed. Intermediate inhibition can be defended for NNRTI-NRTI interactions [49]. For the Bliss independence andDImodel predic-tions, inhibition values are above 5. For the Loewe additivity model predicpredic-tions, inhibition val-ues are mainly driven by the NNRTI component (RPV) of the ART regimen.
On the right-hand side ofFig 6, corresponding logarithmic measures of inhibition are pre-sented as a function of days, for an EPICE-HIV simulated patient, 100% adherent to therapy, except for a treatment interruption of 15 days, starting at day 50. During this treatment inter-ruption, inhibition is seen to drop fast, ultimately approaching the level of 50% inhibition (hor-izontal grey dashed line), suggesting an increase in viral replication. At the end of the
treatment interruption, the decline in inhibition effect seems to slow down slightly, owing Fig 5. Simulated average adherence and treatment interruption duration.Left: Correlation between the theoretical average adherence and simulated observed average adherence, obtained with the first-order binary autoregressive adherence model, for a random sample of 100 hypothetical individuals followed for a 1-year time-period. Theoretical average adherence distribution: 30% with adherence below 80%; 20% with adherence between 80% and 90%; 50% with adherence above 90%. Right: Relationship between simulated observed average adherence and corresponding longer treatment interruption, for the same random sample.
doi:10.1371/journal.pone.0149007.g005
Table 7. PK/PD modeling parameters for RPV, FTC and TDF.
Parameter RPV [48,53] FTC [49] TDF [48,49]
Cmax 0.378μMol 6.8μMol 1.06μMol
IC50 0.0039μMol 0.0112μMol 0.013μMol
t1/2 45 h 39 h
‡
60 h‡
m 1.92 0.92 0.42
‡
Intracellular
mainly to the lower slope parametersmof the NRTI. As can be seen further, after the reintro-duction of therapy, it takes about another 15 days for the inhibition effect to converge back to its periodic orbit, prolonging the impact of the treatment interruption on inhibition.
Jilek et al. (2012) [49] further investigated the correlation between clinical outcomes of RCT and IIP values of different drugs and drug combinations, suggesting that for ART regimens with low IIP, the percentage of patients with plasma HIV-1 RNA levels below 50 copies/mL at 48 weeks is correlated to the estimated IIP of the considered regimen. For ART regimens with high IIP, on the other hand, it is argued that little correlation with outcome can be detected, suggesting that at high IIP levels, viral replication is mostly halted and outcomes depend mainly on adherence to therapy.
Combining the Adherence, PK/PD and HIV-D Models. To demonstrate the interaction of the first-order binary autoregressive adherence model with the PK/PD model and HIV-D model within EPICE-HIV, a simulated patient was considered, starting coformulated RPV/ FTC/TDF 8 years after seroconversion and followed-up for 2 years. For the purpose of this par-ticular simulation, a theoretical persistent low level viremia of 10 plasma HIV-1 RNA copies/ mL was considered and an index of degree of independenceDIof 0.5 was assumed. During the first year of therapy the patient was simulated to be 100% adherent, allowing for RPV/FTC/ TDF to be successful in controlling plasma HIV-1 RNA levels below 50 copies/mL (Fig 7).
After the first year of therapy, adherence was allowed to be driven by the first-order binary autoregressive adherence model. During the second year of therapy, the patient demonstrated an average adherence of 76%, leading to two major continuous treatment interruptions (Fig 7, black squares). The first occurred just before 9.6 years, with a duration of 15 days. The second occurred around 9.9 years, with a duration of 24 days. The 15 day treatment interruption leads to drug concentrations that allow for viral replication, showing a small increase in plasma HIV-1 RNA levels (Figs6and7). The treatment interruption is not long enough though, to warrant detection at a 50 copies/mL threshold. The 24 day interruption, on the other hand, is long enough for plasma HIV-1 RNA levels to rise not only above 50 copies/mL, but also above 400 copies/mL. Furthermore, several days after the reintroduction of treatment, viral load levels remain detectable by the 50 copies/mL threshold, owing to the time it takes for viral inhibition to converge back to its desired levels.
Fig 6. Drug inhibition as a function of drug concentration and time.Left: Logarithmic measure of inhibition (Fwt) as a function of drug concentration (percentage of maximum concentration, log10-scale), for drugs RPV, FTC and TDF alone (green lines) and predictions of the combined effect of RPV+FTC +TDF by the Bliss, Loewe and DI model. For the DI model, a hypothetical index 0.5 of degree of independence was assumed. The vertical grey dashed line represents the inhibition potential at maximum concentration for all three drugs. Right: Logarithmic measure of inhibition (Fwt) as a function of days, based on the Bliss, Loewe and DI model combined effect predictions. Simulations are representative of triple combination ART initiation with RPV+FTC+TDF, for a patient 100% adherent to therapy, except for a treatment interruption of 15 days, starting at day 50. After 15 days, a level of only 50% inhibition, represented by the horizontal grey dashed line, starts being approached.
A previous logistic model has estimated a90% probability of virologic rebound (plasma HIV-1 RNA400 copies/mL) associated to treatment interruptions of 24 days for NNRTI-based ART with comparable follow-up, making results observed at the end of the simulated two-year treatment period inFig 7more than plausible [54]. For treatment interruptions of 15 days, the estimated probability of virologic rebound was 50%.
Further simulations have shown that if persistent levels of viremia are set higher (e.g.: closer to 40 copies/mL), a similar adherence pattern leads to plasma HIV-1 RNA levels above 50 copies/ mL at the end of a 15 day treatment interruption. This highlights the importance of correct modeling of low level viremia. Even with lower levels of persistent viremia, if several small, closely interspaced treatment interruptions would precede the longer 15 day treatment interruption, plasma HIV-1 RNA levels would likely be low, but uncontrolled before the start of the 15 day interruption, augmenting the probability of virologic rebound at the end of the interruption. This suggests that not only the duration of treatment interruptions, but also their inter-location is important. Both situations occur in a natural way within EPICE-HIV, making virologic rebound at 400 copies/mL plausible for a 15 day treatment interruption, under the right circumstances.
Using the STaR Trial for External Model Validation
The main results comparing the simulated 96-week percentages of virologically suppressed EPICE-HIV simulated patients initiating first-line ART with RPV/FTC/TDF to the corre-sponding percentages observed in the STaR study [33], can be found inTable 8.
STaR trial data comprises the full analysis set (FAS) and a modified analysis set (MAS), excluding patients with missing data at 96 weeks. The FAS population consists of the 394 patients randomized to and treated with RPV/FTC/TDF. Because our model provides exhaus-tive virologic information (no missing data) MAS results are also considered for comparability reasons. EPICE-HIV simulations are based on the adherence distribution from the STaR study (‘Base Case’) and an alternative adherence distribution (‘Alternative’, details below) to account for potential bias arising from self-reported adherence.
Fig 7. Treatment interruptions and viral response.Left: Plasma HIV-1 RNA levels as a function of time, simulated by the HIV-D model with drug effect modeled by the primary treatment regimen module of EPICE-HIV. The treatment considered is RPV/FTC/TDF, starting at 8 years after seroconversion with a theoretically imputed persistent low viremia level of 10 plasma HIV-1 RNA copies/mL. For comparability with Parienti et al. [45,54] during the first year of therapy, 100% adherence was assumed, allowing for plasma HIV-1 RNA levels to be controlled (below 50 copies/mL). After that, adherence to therapy is driven by the first-order binary autoregressive adherence model. In the second year of therapy, the patient demonstrated 76% of adherence. Right: Close-up of the last half year of therapy, demonstrating two large treatment interruptions, represented by black squares: one of 15 days (around 9.6 years) and another of 24 days (around 9.9 years). The horizontal grey dashed and dotted lines correspond to viral load detection thresholds of 50 and 400 plasma HIV-1 RNA copies/mL, respectively. Though the 15 day interruption leads to drug concentrations that allow for viral replication, it is not long enough for plasma HIV-1 RNA levels to rise above the detection thresholds. The 24 day interruption leads to plasma HIV-1 RNA levels above 400 copies/mL. Several days after reintroduction of treatment, levels remain detectable by the 50 copies/mL threshold.
Comparing the EPICE-HIV estimates in the base case with the MAS results of the STaR study, most of the observed differences are a direct consequence of a slightly lower rate of viro-logic failure in the simulated data. At week 96, a smaller percentage of simulated cases had viral loads50 copies/mL than in the STaR study (0.3% vs 1.6%). Similarly, discontinuations due to lack of efficacy showed a smaller percentage in the simulated population (1.0%) than in the STaR population (4.1%). Furthermore, also a smaller percentage of patients discontinuing due to other reasons had uncontrolled viral loads in the simulated data (2.7%) as compared to the STaR study (3.9%).
Overall, a virologic success rate of 82.7%, a virologic failure rate of 4.0% and a rate of absence of virologic data of 13.3% was simulated, compared to the rates of 79.3%, 9.6% and 11.1% in the MAS STaR trial data, respectively. The largest difference observed is with respect to the rate of virologic failure and is the only one reaching statistical significance (risk differ-ence: -5.5%; 95%CI [-8.5%;-2.6%]) (Table 9).
These observed differences might be related to multiple factors, an important one of which may be adherence. Adherence in the STaR study was determined through the Medication Adherence Self Report Inventory (MASRI) questionnaire, completed by study subjects. Studies on the relationship between self-reported adherence, electronically monitored adherence and virologic success [17,18,55] have suggested that self-reported adherence is generally higher than electronically monitored adherence and the likelihood of achieving virologic success is greater if electronically monitored adherence is high than if self-reported adherence is high. Differences of over 20% in average adherence when comparing self-reported to electronically monitored adherence can be found in the literature.
Though in a clinical trial setting, with a population less representative of the general popula-tion, this effect might be attenuated, it should not be ignored all together when simulating. Adherence in the STaR study was generally very high (average 96.8%) even after 96 weeks of treatment, with few patients demonstrating adherence levels below 80%. To test the hypothesis of the effect of the adherence distribution on the EPICE-HIV results, a second scenario was set up, considering an alternative distribution with an average 5% decrease in adherence as com-pared to the adherence data observed in the STaR study (Table 8).
Table 8. Week 96 snapshot analysis for the RPV/FTC/TDF arm of the STaR study [33] and the simulated population in the EPICE-HIV model: detailed results.
STaR Trial Data EPICE-HIV Simulation
FAS MAS Base Case Alternative
Virologic Success at Week 96 77.9% 79.3% 82.7% 78.6%
HIV-1 RNA<50 copies/mL 77.9% 79.3% 82.7% 78.6%
Virologic Failure at Week 96 9.4% 9.6% 4.0% 8.5%
HIV-1 RNA50 copies/mL 1.5% 1.6% 0.3% 0.7%
Discontinued study drug due to lack of efficacy 4.1% 4.1% 1.0% 5.1%
Discontinued study drug due to other reasons and last available HIV-1 RNA50 copies/mL 3.8% 3.9% 2.7% 2.7%
No Virologic Data in Week 96 Window 12.7% 11.1% 13.3% 12.9%
Discontinued study drug due to AE or death 3.0% 3.1% 3.3% 3.3%
Discontinued study drug due to other reasons and last available HIV-1 RNA<50 copies/mL 7.9% 8.0% 10.0% 9.7%
Missing data during window but on study drug 1.8% 0.0% 0.0% 0.0%
FAS: Full analysis set;MAS: Modified analysis set (excludes patients on treatment, but with missing data during 96 week window;Base case: Simulations performed with the adherence distributions observed in the STaR study;Alternative: Simulations performed with alternative hypothetical adherence distributions, adjusting for possible bias in self-reported adherence.
The results suggest a higher rate of virologic failure as compared to the base case scenario, relating better to the results observed in the MAS population (Table 9). Individual differences can be interpreted as an effect of timing in treatment interruptions. Overall, 5.7% of the STaR population (MAS) suffered treatment failure (discontinuing study drug due to lack of efficacy, or50 plasma HIV-1 RNA copies/mL) at week 96. For the simulated population, the alterna-tive scenario would result in an estimate of 5.8%, closer to observed values than the 1.3% esti-mated in the base case.
In conclusion, using a fine-tuned multi-paradigm micro-simulation model, we were able to approximate the 96 week outcomes of subjects treated with coformulated RPV/FTC/TDF in the randomized STaR study.
Practical Implications
With EPICE-HIV, we have argued and demonstrated that adherence to ART is an important driver of clinical and therapeutic outcomes in HIV-1 infected individuals. For optimal out-comes, high levels of adherence are required. Suboptimal adherence levels can have serious clinical, economic and epidemiologic implications.
Systematic lack of adherence to ART may lead to an increase in viral replication, especially–
but not only–for therapies with short PK half-lives. On the one hand, increased viral replication is associated with reduced immunological response of patients, impacting the economic burden of the disease, quality of life and mortality. On the other hand, it also increases the risk of dis-ease transmission, posing a clear public health issue. Consequently, from a health policy per-spective, EPICE-HIV may be valuable in assessing and identifying optimal HIV-1 health care strategies—particularly those related to improving adherence—in a very comprehensive way. EPICE-HIV further demonstrates that even small changes to adherence can affect clinical and economic outcomes, not only on the short-term, but also on the long-term, potentially changing the relative value of different therapy options. Given the difference in adherence typi-cally observed between clinical practice and clinical trials, from a health technology assessment and cost-effectiveness perspective, EPICE-HIV may aid in defining the real-world clinical and economic value of different ART regimens for decision makers.
In the light of this, validation of EPICE-HIV against observational study data, which are more representative than randomized controlled trial data for the analysis of real-world clinical settings, should further strengthen the external validation of the model. This limitation to the current paper will be addressed in future work.
Table 9. Week 96 snapshot analysis for the RPV/FTC/TDF arm of the STaR study [33] and the simulated population in the EPICE-HIV model: risk differences between simulated and observed results.
STaR Trial Data EPICE-HIV Simulation
MAS Base Case Alternative
Virologic Success at Week 96 79.3% 82.7% 78.6%
Risk difference—% (95% CI) 3.3% [-0.7%;7.4%] -0.7% [-4.8%;3.3%]
Virologic Failure at Week 96 9.6% 4.0% 8.5%
Risk difference—% (95% CI) -5.5% [-8.5%;-2.6%] -1.1% [-4.0%;1.9%]
No Virologic Data in Week 96 Window 11.1% 13.3% 12.9%
Risk difference—% (95% CI) 2.2% [-1.0%;5.4%] 1.8% [-1.3%;5.0%]
MAS: Modified analysis set (excludes patients on treatment, but with missing data during 96 week window;Base case: Simulations performed with the adherence distributions observed in the STaR study;Alternative: Simulations performed with alternative hypothetical adherence distributions, adjusting for possible bias in self-reported adherence.
Acknowledgments
The authors would like to acknowledge Gilead Sciences for making STaR study data available for external model validation. The authors would further like to thank the reviewers for their valuable comments.
Author Contributions
Conceived and designed the experiments: BV JML JJP AU RC CS AM JF. Performed the exper-iments: BV. Analyzed the data: BV JML JJP AU RC CS AM. Contributed reagents/materials/ analysis tools: BV DF JF. Wrote the paper: BV JML JJP AU RC CS AM DF JF.
References
1. Bhaskaran K, Hamouda O, Sannes M, Boufassa F, Johnson AM, Lambert PC, et al. Changes in the Risk of Death After HIV Seroconversion Compared With Mortality in the General Population. JAMA. 2008; 300(1):51–9. doi:10.1001/jama.300.1.51PMID:18594040
2. Collaboration of Observational HIVEREiE, Lewden C, Bouteloup V, De Wit S, Sabin C, Mocroft A, et al. All-cause mortality in treated HIV-infected adults with CD4>/ = 500/mm3 compared with the general population: evidence from a large European observational cohort collaboration. International journal of epidemiology. 2012; 41(2):433–45. doi:10.1093/ije/dyr164PMID:22493325
3. Rodger AJ, Lodwick R, Schechter M, Deeks S, Amin J, Gilson R, et al. Mortality in well controlled HIV in the continuous antiretroviral therapy arms of the SMART and ESPRIT trials compared with the general population. Aids. 2013; 27(6):973–9. doi:10.1097/QAD.0b013e32835cae9cPMID:23698063
4. Cohen CJ, Andrade-Villanueva J, Clotet B, Fourie J, Johnson MA, Ruxrungtham K, et al. Rilpivirine ver-sus efavirenz with two background nucleoside or nucleotide reverse transcriptase inhibitors in treat-ment-naive adults infected with HIV-1 (THRIVE): a phase 3, randomised, non-inferiority trial. The Lancet. 2011; 378(9787):229–37.
5. Cohen CJ, Wohl D, Arribas JR, Henry K, Van Lunzen J, Bloch M, et al. Week 48 results from a random-ized clinical trial of rilpivirine/emtricitabine/tenofovir disoproxil fumarate vs. efavirenz/emtricitabine/teno-fovir disoproxil fumarate in treatment-naive HIV-1-infected adults. Aids. 2014; 28:989–97. doi:10. 1097/QAD.0000000000000169PMID:24508782
6. Daar ES, Tierney C, Fischl MA, Sax PE, Mollan K, Budhathoki C, et al. Atazanavir Plus Ritonavir or Efa-virenz as Part of a 3-Drug Regimen for Initial Treatment of HIV-1. Annals of Internal Medicine. 2011; 154:445–56. doi:10.7326/0003-4819-154-7-201104050-00316PMID:21320923
7. DeJesus E, Rockstroh JK, Henry K, Molina J, Gathe J, Ramanathan S, et al. Co-formulated elvitegravir, cobicistat, emtricitabine, and tenofovir disoproxil fumarate versus ritonavir-boosted atazanavir plus co-formulated emtricitabine and tenofovir disoproxil fumarate for initial treatment of HIV-1 infection: a ran-domised, double-blind, phase 3, non-inferiority trial. Lancet. 2012; 379:2429–38. doi: 10.1016/S0140-6736(12)60918-0PMID:22748590
8. van Lunzen J, Maggiolo F, Arribas JR, Rakhmanova A, Yeni P, Young B, et al. Once daily dolutegravir (S/GSK1349572) in combination therapy in antiretroviral-naive adults with HIV: planned interim 48 week results from SPRING-1, a dose-ranging, randomised, phase 2b trial. The Lancet Infectious Dis-eases. 2011; 12(2):111–8. doi:10.1016/S1473-3099(11)70290-0PMID:22018760
9. Society EAC. Guidelines version 7.1. 2014.
10. Young B, Debes R, Buchacz K, Scott M, Palella F, Brooks J, editors. HIV viral load monitoring fre-quency and risk of treatment failure among immunologically stable HIV-infected patients prescribed ART. 20th International AIDS Conference; 2014 July 20–25, 2014; Melbourne, Australia.
11. Programs DoHaS. HIV Care and Treatment Service Utilization: 2012 Year End Report. 2014 April 2014. Report No.
12. Goujard C, Bernard N, Sohier N, Peyramond D, Lançon F, Chwalow J, et al. Impact of a Patient Educa-tion Program on Adherence to HIV MedicaEduca-tion: A Randomized Clinical Trial. J Acquir Immune Defic Syndr. 2003; 34(2):191–4. PMID:14526208
13. Broadheada RS, Heckathornb DD, Alticec FL, van Hulsta Y, Carbonec M, Friedlandc GH, et al. Increas-ing drug users’adherence to HIV treatment:results of a peer-driven intervention feasibility study. Social Science & Medicine. 2002; 55:235–46.
15. Pradier C, Bentz L, Spire B, Tourette-Turgis C, Morin M, Souville M, et al. Efficacy of an Educational and Counseling Intervention on Adherence to Highly Active Antiretroviral Therapy: French Prospective Controlled Study. HIV Clin Trials. 2003; 4(2):121–31. PMID:12671780
16. Rawlings MK, Thompson MA, Farthing CF, Brown LS, Racine J, Scott RC, et al. Impact of an educational program on efficacy and adherence with a twice-daily lamivudine/zidovudine/abacavir regimen in under-represented HIV-infected patients. J Acquir Immune Defic Syndr. 2003; 34(2):174–83. PMID:14526206
17. Bangsberg DR, Hecht FM, Charlebois ED, Zolopa AR, Holodniy M, Sheiner L, et al. Adherence to pro-tease inhibitors, HIV-1 viral load, and development of drug resistance in an indigent population. Aids. 2000; 14:357–66. PMID:10770537
18. Arnsten JH, Demas PA, Farzadegan H, Grant RW, Gourevitch MN, Chang C, et al. Antiretroviral Ther-apy Adherence and Viral Suppression in HIV-Infected Drug Users: Comparison of Self-Report and Electronic Monitoring. Clin Infect Dis. 2001; 33:1417–23. PMID:11550118
19. Liu H, Golin CE, Miller LG, Hays RD, Beck CK, Sanandaji S, et al. A comparison study of multiple mea-sures of adherence to HIV protease inhibitors. Ann Intern Med. 2001; 134(10):968–77. PMID:11352698
20. Mannheimer S, Friedland G, Matts J, Child C, Chesney M. The Consistency of Adherence to Antiretro-viral Therapy Predicts Biologic Outcomes for Human Immunodeficiency Virus–Infected Persons in Clin-ical Trials. HIV/AIDS. 2002; 34:1115–21.
21. Howard AA, Arnsten JH, Lo Y, Vlahova D, Richc JD, Schumand P, et al. A prospective study of adher-ence and viral load in a large multi-center cohort of HIV-infected women. Aids. 2002; 16(16):2175–82. PMID:12409739
22. Sax PE, Meyers JL, Mugavero MJ, Davis KL. Adherence to antiretroviral treatment and correlation with risk of hospitalization among comercially insured HIV patients in the United States. PloS one. 2012; 7 (2):e31591. doi:10.1371/journal.pone.0031591PMID:22384040
23. Raffi F, Yazdanpanah Y, Fagnani F, Laurendeau C, Lafuma A, Gourmelen J. Persistence and adher-ence to single-tablet regimens in HIV treatment: a cohort study from the French National Healthcare Insurance Database. J Antimicrob Chemother. 2015; doi:10.1093/jac/dkv083
24. Gardner EM, Burman WJ, Steiner JF, Anderson PL, Bangsberg DR. Antiretroviral medication adher-ence and the development of class-specific antiretroviral resistance. Aids. 2009; 23(9):1035–46. doi: 10.1097/QAD.0b013e32832ba8ecPMID:19381075
25. Bangsberg DR. Preventing HIV antiretroviral resistance through better monitoring of treatment adherence. The Journal of infectious diseases. 2008; 197 Suppl 3:S272–8. doi:10.1086/533415PMID:18447613
26. Frentz D, van de Vijver D, Abecasis A, Albert J, Hamouda O, Jorgensen L, et al. Patterns of transmitted HIV drug resistance in Europe vary by risk group. PloS one. 2014; 9(4):e94495. doi:10.1371/journal. pone.0094495PMID:24721998
27. Walensky RP, Ross EL, Kumarasamy N, Wood R, Noubary F, Paltiel AD, et al. Cost-Effectiveness of HIV Treatment as Prevention in Serodiscordant Couples. N Engl J Med. 2013; 369(18):1715–25. doi: 10.1056/NEJMsa1214720PMID:24171517
28. Braithwaite RS, Shechter S, Chang C- CH, Schaefer A, Roberts MS. Estimating the Rate of Accumulating Drug Resistance Mutations in the HIV Genome. Value Health. 2007; 10(3):204–13. PMID:17532813
29. Kessler J, Myers JE, Nucifora KA, Mensah N, Kowalski A, Sweeney M, et al. Averting HIV Infections in New York City: A Modeling Approach Estimating the Future Impact of Additional Behavioral and Bio-medical HIV Prevention Strategies. PloS one. 2013; 8(9):e73269. doi:10.1371/journal.pone.0073269 PMID:24058465
30. Phillips AN, Sabin C, Pillay D, Lundgren JD. HIV in the UK 1980–2006: reconstruction using a model of HIV infection and the effect of antiretroviral therapy. HIV Med. 2007; 8:536–46. PMID:17944687
31. Phillips AN, Pillay D, Garnett G, Bennett D, Vitoria M, Cambiano V, et al. Effect on transmission of HIV-1 resistance of timing of implementation of viral load monitoring to determine switches from first to sec-ond-line antiretroviral regimens in resource-limited settings. Aids. 2011; 25(6):843–50. doi:10.1097/ QAD.0b013e328344037aPMID:21192233
32. Schmid BV, Kretzschmar M. Determinants of sexual network structure and their impact on cumulative network measures. PLoS computational biology. 2012; 8(4):e1002470. doi:10.1371/journal.pcbi. 1002470PMID:22570594
33. Cohen C, Wohl C, Cavassini C, Henry K, Bloch M, Towner W, et al., editors. STaR Study: Single-Tablet Regimen Rilpivirine/Emtricitabine/Tenofovir DF Is Non-Inferior Compared to Efavirenz/Emtricitabine/ Tenofovir DF and Improves Patient Reported Outcomes through Week 96. ICAAC; 2014 September 5–9, 2014; Washingtion DC, USA.
35. Rong L, Perelson AS. Modeling HIV persistence, the latent reservoir, and viral blips. J Theor Biol. 2009; 260(2):308–31. doi:10.1016/j.jtbi.2009.06.011PMID:19539630
36. Weiss RA. How Does HIV Cause AIDS? Science. 1993; 260:1273–9. PMID:8493571
37. Connor RI, Mohri H, Cao Y, Ho DD. Increased Viral Burden and Cytopathicity Correlate Temporally with CD4+ T-Lymphocyte Decline and Clinical Progression in Human Immunodeficiency Virus Type 1-Infected Individuals. Journal of Virology. 1993; 67(4):1772–7. PMID:8095306
38. Siliciano RF, Greene WC. HIV Latency. Cold Spring Harb Perspect Med. 2011; 1(1):a007096–a. doi: 10.1101/cshperspect.a007096PMID:22229121
39. Ramkissoon S, Mwambi HG, Matthews AP. Modelling HIV and MTB Co-Infection Including Combined Treatment Strategies. PloS one. 2012; 7(11):e49492. doi:10.1371/journal.pone.0049492PMID: 23209581
40. Palmer S, Wiegand AP, Maldarelli F, Bazmi H, Mican JM, Polis M, et al. New Real-Time Reverse Tran-scriptase-Initiated PCR Assay with Single-Copy Sensitivity for Human Immunodeficiency Virus Type 1 RNA in Plasma. J Clin Microbiol. 2003; 41(10):4531–6. PMID:14532178
41. Maldarelli F, Palmer S, King MS, Wiegand A, Polis MA, Mican J, et al. ART suppresses plasma HIV-1 RNA to a stable set point predicted by pretherapy viremia. PLoS pathogens. 2007; 3(4):e46. PMID: 17411338
42. Bonora S, Nicastri E, Calcagno A, Gonzalez de Requena D, D'Ettorre G, Sarmati L, et al. Ultrasensitive assessment of residual HIV viraemia in HAART-treated patients with persistently undetectable plasma HIV-RNA: a cross-sectional evaluation. J Med Virol. 2009; 81(3):400–5. doi:10.1002/jmv.21405PMID: 19152404
43. Callaway D. HIV-1 Infection and Low Steady State Viral Loads. Bull Math Biol. 2002; 64(1):29–64. PMID:11868336
44. WHO. Consolidated guidelines on the use of antiretroviral drugs for treating and preventing HIV infec-tion. 2013.
45. Parienti JJ, Ragland K, Lucht F, de la Blanchardiere A, Dargere S, Yazdanpanah Y, et al. Average adherence to boosted protease inhibitor therapy, rather than the pattern of missed doses, as a predictor of HIV RNA replication. Clinical infectious diseases: an official publication of the Infectious Diseases Society of America. 2010; 50(8):1192–7.
46. Gras G, Schneider MP, Cavassini M, Lucht F, Loilier M, Verdon R, et al. Patterns of adherence to ralte-gravir-based regimens and the risk of virological failure among HIV-infected patients: the RALTECAPS cohort study. J Acquir Immune Defic Syndr. 61(3):265–9. doi:10.1097/QAI.0b013e31826cc592PMID: 22895438
47. Krakovska O, Wahl LM. Optimal drug treatment regimens for HIV depend on adherence. J Theor Biol. 2007; 246(3):499–509. PMID:17320115
48. Shen L, Peterson S, Sedaghat AR, McMahon MA, Callender M, Zhang H, et al. Dose-response curve slope sets class-specific limits on inhibitory potential of anti-HIV drugs. Nature medicine. 2008; 14 (7):762–6. doi:10.1038/nm1777PMID:18552857
49. Jilek BL, Zarr M, Sampah ME, Rabi SA, Bullen CK, Lai J, et al. A quantitative basis for antiretroviral ther-apy for HIV-1 infection. Nat Med. 2012; 18(3):446–51. doi:10.1038/nm.2649PMID:22344296
50. Vercauteren J, Beheydt G, Prosperi M, Libin P, Imbrechts S, Camacho R, et al. Clinical evaluation of Rega 8: an updated genotypic interpretation system that significantly predicts HIV-therapy response. PloS one. 2013; 8(4):e61436. doi:10.1371/journal.pone.0061436PMID:23613852
51. Lewden C, Chene G, Morlat P, Raffi F, Dupon M, Dellamonica P, et al. HIV-Infected Adults With a CD4 Cell Count Greater Than 500 Cells/mm3 on Long-Term Combination Antiretroviral Therapy Reach Same Mortality Rates as the General Population. Acquir Immune Defic Syndr. 2007; 46(1):72–7.
52. Fauci A. Immunopathogenic Mechanisms of HIV Infection. Ann Intern Med. 1996; 124:654–63. PMID: 8607594
53. Administration DoHaA-TG. Australian Public Assessment Report for Rilpivirine. Australian Govern-ment, 2012 March 2012. Report No.
54. Parienti JJ, Das-Douglas M, Massari V, Guzman D, Deeks SG, Verdon R, et al. Not all missed doses are the same: sustained NNRTI treatment interruptions predict HIV rebound at low-to-moderate adher-ence levels. PloS one. 2008; 3(7):e2783. doi:10.1371/journal.pone.0002783PMID:18665246
![Fig 2. Stock and flow diagram of the basic HIV-1 dynamics model, modified from Rong et al [35]](https://thumb-eu.123doks.com/thumbv2/123dok_br/18343291.352230/4.918.62.684.564.945/fig-stock-diagram-basic-dynamics-model-modified-rong.webp)