www.hydrol-earth-syst-sci.net/19/3387/2015/ doi:10.5194/hess-19-3387-2015
© Author(s) 2015. CC Attribution 3.0 License.
Relating seasonal dynamics of enhanced vegetation index to the
recycling of water in two endorheic river basins in north-west China
M. A. Matin1and C. P.-A. Bourque1,2
1Faculty of Forestry and Environmental Management, University of New Brunswick, New Brunswick, Canada 2School of Soil and Water Conservation, Beijing Forestry University, Beijing, PR China
Correspondence to:C. P.-A. Bourque (cbourque@unb.ca)
Received: 5 January 2015 – Published in Hydrol. Earth Syst. Sci. Discuss.: 26 January 2015 Revised: 7 July 2015 – Accepted: 9 July 2015 – Published: 3 August 2015
Abstract. This study associates the dynamics of enhanced vegetation index in lowland desert oases to the recycling of water in two endorheic (hydrologically closed) river basins in Gansu Province, north-west China, along a gradient of ele-vation zones and land cover types. Each river basin was sub-divided into four elevation zones representative of (i) oasis plains and foothills, and (ii) low-, (iii) mid-, and (iv) high-mountain elevations. Comparison of monthly vegetation phe-nology with precipitation and snowmelt dynamics within the same basins over a 10-year period (2000–2009) suggested that the onset of the precipitation season (cumulative % pre-cipitation >7–8 %) in the mountains, typically in late April to early May, was triggered by the greening of vegetation and increased production of water vapour at the base of the mountains. Seasonal evolution of in-mountain precipitation correlated fairly well with the temporal variation in oasis-vegetation coverage and phenology characterised by monthly enhanced vegetation index, yielding coefficients of deter-mination of 0.65 and 0.85 for the two basins. Convergent cross-mapping of related time series indicated bi-directional causality (feedback) between the two variables. Comparisons between same-zone monthly precipitation amounts and en-hanced vegetation index provided weaker correlations. Start of the growing season in the oases was shown to coincide with favourable spring warming and discharge of meltwater from low- to mid-elevations of the Qilian Mountains (zones 1 and 2) in mid-to-late March. In terms of plant requirement for water, mid-seasonal development of oasis vegetation was seen to be controlled to a greater extent by the production of rain in the mountains. Comparison of water volumes associ-ated with in-basin production of rainfall and snowmelt with that associated with evaporation seemed to suggest that about
90 % of the available liquid water (i.e. mostly in the form of direct rainfall and snowmelt in the mountains) was recycled locally.
1 Introduction
River basins not connected to oceans (endorheic basins; Meybeck, 2003) occupy about 13 % of the total land surface of the earth (Meybeck et al., 2001) and generate about 2.3 % of global runoff (Shiklomanov, 1998). Most of these basins are located in water-limited regions of the world, generally in the middle of continents remote from oceanic sources of atmospheric moisture or blocked by mountain ranges (Mey-beck et al., 2001; Warner, 2004). Rivers associated with en-dorheic basins in north-west China are typically sourced by precipitation forming in mountains. These rivers commonly terminate in deserts as a result of strong evaporation (X. Li et al., 2013). Endorheic basins are extremely sensitive to land cover and climate variability (Meybeck, 2003). Therefore, understanding the water cycle in these areas is extremely im-portant for the long-term sustainability (Pilgrim et al., 1988) of desert oases in north-west China.
Tibet-Qinghai Plateau
India
China Hexi Corridor
Taklamakan Desert
Tian Mountains
Gansu
Alpine Meadow Coniferous Forest Bare Ground Desert Crops
Snow/Ice Deciduous Shrub Dense Grass Sparse Grass/Shrub
Zhangye Oasis
Liangzhou Oasis
Minqin Oasis
Hei River Basin
Shiyang River Basin Badain Jaran Desert
Figure 1.The Shiyang and Hei river basins with distribution of dominant land cover classes, classified with a decision-tree classifier and categorisation thresholds summarised in Table A1 (Appendix). The inset shows the location of the study area along the north-eastern flank of the Qinghai–Tibet Plateau.
Based on geologic, isotopic, and atmospheric-circulation studies, aridification of north-west China has been theorised to have started about 12 Ma (mega-annum or million years ago) following (i) withdrawal of the Paratethys Sea from cen-tral Asia, resulting in the loss of a major source of moisture; (ii) building of the Himalayas and south-central Qinghai– Tibet Plateau, obstructing moisture-carrying air masses from oceanic source areas in the south (i.e. south-east Asian mon-soon); and (iii) outward expansion of the northern fringe of the Qinghai–Tibet Plateau and subsequent growth of the Tian Shan and Pamir mountain ranges to the north-west of the plateau (Kent-Corson et al., 2009; Zhuang et al., 2011), giv-ing rise to the vast Taklamakan Desert (Tarim Basin, Xin-jiang Province; inset in Fig. 1). Regional climate along the northern fringe of the Qinghai–Tibet Plateau, particularly along the Hexi Corridor of west-central Gansu Province (in-set, Fig. 1), is mostly controlled by the dry central Asian air mass (Kent-Corson et al., 2009). Westerly airflow associated with this air mass interacts with numerous mountain ranges between the Caspian Sea to the Tian Shan Mountains in the west of the Hexi Corridor (Warner, 2004). These interactions cause the moisture in the air to progressively lessen as the air mass continues to track eastward towards the Hexi Corri-dor and Qilian Mountains (Fig. 1). External contribution of moisture to the Hexi Corridor from Europe and western Asia (Warner, 2004; van der Ent et al., 2010) is anticipated to be low and of marginal importance to the localised recycling of water in west-central Gansu.
The Hexi Corridor is renowned for its excessive dryness and large oases along the base of the Qilian Mountains, most notably the Liangzhou, Minqin, and Zhangye oases (Fig. 1). Oases in the area provide important refugia to flora, fauna, and humans alike. Oases in north-west China occupy about 5 % of the total land mass of the region, but give refuge to and feed about 95 % of the growing population of the area (Gao et al., 2004; Chu et al., 2005).
Table 1.List of weather stations, their coordinates, elevation, and mean total annual precipitation based on measurements from 1976 to 2005. Stations are located within or near the Hexi Corridor (Fig. 1).
Station ID Station Latitude (◦N) Longitude (◦E) Elevation (m a.m.s.l.) Precipitation (kg m−2yr−1)
52323 Mazongshan 41.80 97.03 1770 70.6
52418 Dunhuang 40.15 94.68 1140 41.4
52424 Guazhou 40.50 95.92 1177 51.7
52436 Yumen 40.27 97.03 1527 66.5
52446 Dingxin 40.40 99.80 1158 54.7
52447 Jinta 39.82 98.90 1372 62.4
52533 Suzhou 39.77 98.48 1478 85.6
52546 Gaotai 39.37 99.82 1332 110.1
52557 Linze 39.16 100.16 1454 111.7
52652 Zhangye∗ 38.93 100.43 1483 129.8
52679 Wuwei 37.92 102.67 1534 170.7
52681 Minqin 38.63 103.08 1367 112.9
∗Stations in bold are those found in the Zhangye and Liangzhou oases, refer to Fig. 1.
production of precipitation and ice- and snow-thawed water in recharging the lowland oases of the area.
Long-term mean recharge in low-lying areas north of the Qinghai–Tibet Plateau (Fig. 1) is assessed to be about 0.9– 2.5 kg m−2yr−1(∼1–2 % of mean annual total precipitation) based on chloride mass balance and isotopic assessments (Ma et al., 2008, 2009; Gates et al., 2008a, b), indicating that most of the surface and shallow-subsurface water generated in the mountains and flowing to the oases is eventually lost to the atmosphere as a result of evaporation. Lack of recharge of groundwater and excessive extraction of the resource for agricultural and other domestic uses has led to salinisation and desertification of the land surface in west-central Gansu (Zong et al., 2011; Aarnoudse et al., 2012; Currell et al., 2012).
All of these studies and others available in the scientific lit-erature (e.g. Kang et al., 1999; Gates et al., 2008a; Huo et al., 2008; Li et al., 2008; Jia et al., 2011; Ma et al., 2009, 2013; Pang et al., 2011; Zhuang et al., 2011) make reference to the importance of orographic rainout and the role of oasis vegeta-tion in supporting the water cycle in the Hexi Corridor. How-ever, none of these studies explicitly connects in-mountain production of precipitation to the seasonal evolution of oasis vegetation.
Non-geochemical assessments of regional water fluxes are complicated by the scarcity of land and climate data in arid regions of the world. In general, arid and mountainous re-gions of the world, including north-west China, have few to no monitoring stations. Pilgrim et al. (1988) found that the effective density of hydrometric stations in an arid region of Australia is one station per 10 000 km2, compared to one sta-tion per 2300 km2 overall. Quality of data is also compro-mised in arid regions, due to difficulties in maintaining the stations.
Remote sensing and distributed modelling techniques are often used to supplement our understanding of
eco-hydrometeorological processes at large spatial extents (e.g. hundreds of thousands km2) at resolutions suitable to ad-dress issues of sustainable development (<500 m). Inte-grating remote sensing data with distributed modelling pro-vides us with an efficient way of examining localised eco-hydrometeorological processes without resorting to a few point measurements and potentially imprecise methods of interpolation (Matin and Bourque, 2013a), except possibly in the calibration and confirmation of biophysical surfaces derived from remote-sensing-based characterisations of re-gional fluxes.
The objective of this paper is to investigate the relative in-fluence of oasis vegetation on water recycling and the genera-tion of in-mountain precipitagenera-tion in two large endorheic river basins in north-west China over a 10-year period (i.e. 2000– 2009), based partially on a correlational and cause-and-effect examination (by way of convergent cross-mapping; Sugi-hara et al., 2012) of relevant hydrological variables. Spatio-temporal variation in oasis-vegetation coverage and phenol-ogy is characterised by a chronological series of monthly Moderate Resolution Imaging Spectroradiometer (MODIS)-based images of enhanced vegetation index (Huete et al., 2002) and land cover-specific thresholds. Hydrological com-ponents essential to the study involve existing, independently developed monthly surfaces of (i) evaporation and precip-itation, prepared from remote sensing data (Table 2), and (ii) snowmelt and mountain return flow, generated from dis-tributed hydrological modelling (see Matin and Bourque, 2013a, b, 2015). All surfaces were later validated against field data collected at a limited number of climate and hy-drometric stations in the Hexi Corridor.
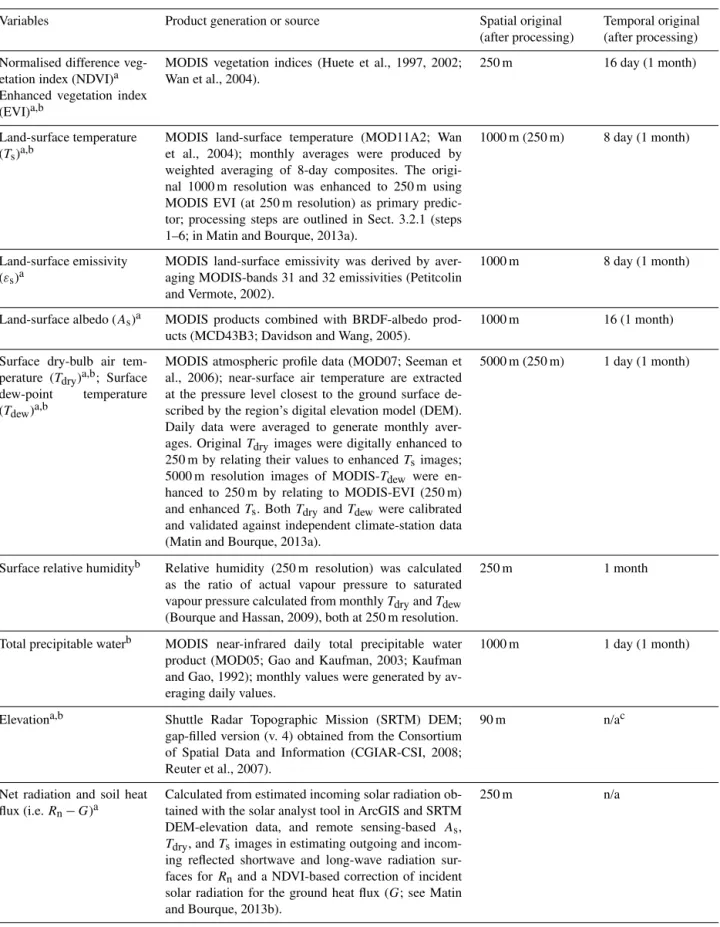
Table 2.Input variables and their image-data sources relevant to the generation of evaporation, precipitation, and snowmelt surfaces addressed in this study, including their spatio-temporal resolutions (columns 3 and 4) before and after spatial enhancement. Bracketed values are not given in cases where spatial enhancement or temporal aggregation were not used (modified after Matin and Bourque, 2013a).
Variables Product generation or source Spatial original
(after processing)
Temporal original (after processing)
Normalised difference veg-etation index (NDVI)a Enhanced vegetation index (EVI)a,b
MODIS vegetation indices (Huete et al., 1997, 2002; Wan et al., 2004).
250 m 16 day (1 month)
Land-surface temperature (Ts)a,b
MODIS land-surface temperature (MOD11A2; Wan et al., 2004); monthly averages were produced by weighted averaging of 8-day composites. The origi-nal 1000 m resolution was enhanced to 250 m using MODIS EVI (at 250 m resolution) as primary predic-tor; processing steps are outlined in Sect. 3.2.1 (steps 1–6; in Matin and Bourque, 2013a).
1000 m (250 m) 8 day (1 month)
Land-surface emissivity (εs)a
MODIS land-surface emissivity was derived by aver-aging MODIS-bands 31 and 32 emissivities (Petitcolin and Vermote, 2002).
1000 m 8 day (1 month)
Land-surface albedo (As)a MODIS products combined with BRDF-albedo prod-ucts (MCD43B3; Davidson and Wang, 2005).
1000 m 16 (1 month)
Surface dry-bulb air tem-perature (Tdry)a,b; Surface dew-point temperature (Tdew)a,b
MODIS atmospheric profile data (MOD07; Seeman et al., 2006); near-surface air temperature are extracted at the pressure level closest to the ground surface de-scribed by the region’s digital elevation model (DEM). Daily data were averaged to generate monthly aver-ages. OriginalTdryimages were digitally enhanced to 250 m by relating their values to enhancedTsimages; 5000 m resolution images of MODIS-Tdew were en-hanced to 250 m by relating to MODIS-EVI (250 m) and enhancedTs. BothTdryandTdew were calibrated and validated against independent climate-station data (Matin and Bourque, 2013a).
5000 m (250 m) 1 day (1 month)
Surface relative humidityb Relative humidity (250 m resolution) was calculated as the ratio of actual vapour pressure to saturated vapour pressure calculated from monthlyTdryandTdew (Bourque and Hassan, 2009), both at 250 m resolution.
250 m 1 month
Total precipitable waterb MODIS near-infrared daily total precipitable water product (MOD05; Gao and Kaufman, 2003; Kaufman and Gao, 1992); monthly values were generated by av-eraging daily values.
1000 m 1 day (1 month)
Elevationa,b Shuttle Radar Topographic Mission (SRTM) DEM;
gap-filled version (v. 4) obtained from the Consortium of Spatial Data and Information (CGIAR-CSI, 2008; Reuter et al., 2007).
90 m n/ac
Net radiation and soil heat flux (i.e.Rn−G)a
Calculated from estimated incoming solar radiation ob-tained with the solar analyst tool in ArcGIS and SRTM DEM-elevation data, and remote sensing-based As, Tdry, andTsimages in estimating outgoing and incom-ing reflected shortwave and long-wave radiation sur-faces forRnand a NDVI-based correction of incident solar radiation for the ground heat flux (G; see Matin and Bourque, 2013b).
250 m n/a
the Qilian Mountains and return flow to the oases. These back and forth transfers of water (in both its gaseous and liquid state) assure the long-term self-maintenance of desert oases in north-west China. Disruption in the lowland pro-duction of water vapour by affecting vegetation growth and coverage through land conversion could potentially result in irreparable damage to the self-supporting mechanisms of the oases by promoting desertification of the area (Warner, 2004; Bourque and Hassan, 2009).
2 Study area
The study area consists of the Shiyang and Hei river basins in west-central Gansu Province, north-west China (Fig. 1). The Shiyang River basin is an endorheic river basin (F. Li et al., 2013) located in the eastern Hexi Corridor. The Shiyang River originates from the Qilian Mountains and flows about 300 km north-eastward (Gao et al., 2006) before terminat-ing in the Minqin lake district, borderterminat-ing the Tengger and Badain Jaran deserts (Li et al., 2007; Fig. 1). The basin area is roughly 49 500 km2. Elevation in the Shiyang River basin varies from 1284 to 5161 m above mean sea level (a.m.s.l.), with an average elevation of 1871 m a.m.s.l. The Shiyang River system has eight main branches, including the Xida, Donga, Xiying, Jinta, Zamusi, Huangyang, Gulang, and Da-jing Rivers (F. Li et al., 2013; Wonderen et al., 2010).
The Hei River also originates from the Qilian Moun-tains, north-west of the headwaters of the Shiyang River net-work, and flows north-westward through the oases and termi-nates in the Badain Jaran Playa (Akiyama et al., 2007). The Hei River basin, with a land-surface area of approximately 128 000 km2, is the second largest endorheic river basin in north-west China (Gu et al., 2008). The Hei River basin includes the Zhangye sub-basin, with a total land area of about 31 100 km2. Elevation in the Zhangye sub-basin varies from 1287 to 5045 m a.m.s.l., with an average elevation of 2679 m a.m.s.l.
Long-term average data (1950–2000) show that precipi-tation and potential evaporation in the deserts are approx-imately 80–150 and 2300–2600 kg m−2yr−1, based on an application of the Penman–Monteith equation (Monteith, 1965). Precipitation increases in the mountains from 300 to 600 kg m−2yr−1, while potential evaporation decreases to about 700 kg m−2yr−1(Akiyama et al., 2007; Wang and
Zhao, 2011; Zang et al., 2012). Most of the precipitation occurs during June to August; about 94 % of water deliv-ered from the mountains to lowland oases is through surface runoff. Average annual runoff in the Shiyang River is about 15.8×10⁸m3yr−1, whereas in the Hei River it is about 37.7×10⁸m3yr−1(Kang et al., 2009).
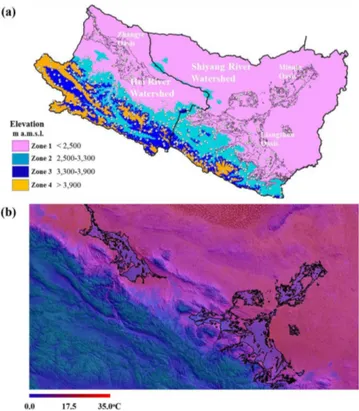
Figure 2. Division of study area according to four elevation
zones (a; legend) and mean July air temperature distribution (b) used in the computational fluid-flow dynamics modelling of sur-face wind velocity (m s−1)and wind direction (◦from true north, N). Open circles in (a) give the randomly selected point loca-tions where enhanced vegetation index (non-dimensional), evapora-tion (kg m−2month−1), and precipitation (kg m−2month−1)were sampled.
3 Methods
3.1 Land cover types, zones, and regional sampling Based on vegetation site preferences (Appendix), the study area was subdivided into four main elevation zones (Fig. 2a), defined by elevations: (i)<2500 (oasis plains and foothills; zone 1); (ii) 2500–3300 (low-mountain elevations; zone 2), (iii) 3300–3900 (mid-mountain elevations; zone 3), and (iv) >3900 m a.m.s.l. (high-mountain elevations; zone 4). Different land cover types in these elevation zones were then identified based on enhanced vegetation index and slope ori-entation (Table A1, Appendix; Fig. 1). To advance the analy-sis, within-zone enhanced vegetation index, evaporation, and precipitation were sampled randomly in a geographic infor-mation system (for sampling point layout, see Fig. 2a).
3.2 Vegetation phenology
0 0.1 0.2 0.3 0.4 0.5 0 0.1 0.2 0.3 0.4 0.5
J F M A M J J A S O N D J F M A M J J A S O N D J F M A M J J A S O N D J F M A M J J A S O N D
M
ean
M
on
thly
E
VI
Month
(i) (ii) (iii) (iv)
(v) (vi) (vii) (viii)
January February March
April May June
July August September
October November December
0.15 0.49 0.82 (a)
(b)
0.15 0.49 0.82
Shiyang River Basin
Hei River Basin
Zone 1 Zone 2 Zone 3 Zone 4
Figure 3.Ten-year average distribution of monthly enhanced vegetation index (EVI≥0.15; non-dimensional) according to time of year(a) and spatially averaged time series of monthly EVI over the course of individual years for 2000–2009 (b; shown in different colours). Letters along thexaxis of plots in(b)coincide with month, January (J) through to December (D). Vertical red lines denote the approximate month of the onset (first line) and cessation of the growing season (second line) in the Shiyang and Hei river basins, respectively.
hydrological cycle in river basins (Martinez and Gilabert, 2009). Study of land-surface phenology is also important to understand the causes of vegetation growth-pattern changes (Fisher and Mustard, 2007; Myneni et al., 1997). Satellite-based analysis of land-surface phenology addresses the de-velopment patterns in photosynthetic biomass by means of derived vegetation indices (e.g. Fig. 3a; Ahl et al., 2006) in an area that can potentially support many species. Ground-based analysis of land-surface phenology, in contrast, focusses on a single plant species at a time.
Typical measures of phenology are (i) onset of greening, (ii) onset of senescence, (iii) peak development during the growing season, and (iv) length of the growing season (Hud-son et al., 2010). Various methods have been adopted to as-sess phenology from space. Hudson et al. (2010) classified these into four groups, namely (i) threshold-, (ii) derivative-, (iii) smoothing-derivative-, and (iv) model-based methods. Among these methods, the threshold-based method is the simplest and most commonly used (Hudson et al., 2010).
With the threshold-based method, a single value of vege-tation index is specified as the threshold. The values of veg-etation index are plotted against time of year. The time when the threshold value is passed in the upward direction is iden-tified as the start of the growing period and when the same value is passed in the downward direction, the time is iden-tified as the end of the growing period (Karlsen et al., 2006; e.g. Fig. 3b). Methods of selecting the threshold vary among studies. Some authors use single arbitrary thresholds, e.g. 0.17 (Fischer, 1994), 0.09 (Markon et al., 1995), and 0.099 (Lloyd, 1990), whereas some use threshold specifiers like the long-term average (Karlsen et al., 2006) or % peak amplitude of vegetation indices (Jonsson and Eklundh, 2002).
hanced vegetation index. Zonal averages of the mean en-hanced vegetation index were calculated for each land cover type for each month of the year. These values were plotted against time to generate separate time-versus-vegetation in-dex plots for each land cover type. The threshold values were specified at the time when mean enhanced vegetation index had maximum positive curvature when moving in the upward direction (Fig. 3b). Values generated were 0.09 for crops and sparse grass, 0.17 for coniferous forest and meadow, and 0.12 for other vegetation types.
3.3 Onset, cessation, and duration of the precipitation season
Most methods used in establishing the onset and cessation of the precipitation season usually aim to determine the ef-fective planting date of crops (Adejuwon et al., 1990; Ade-juwon and Odekunle, 2006; Benoit, 1977; Ilesanmi, 1972). In these methods, the onset and end of the precipitation sea-son is equated to the onset and end of the growing seasea-son (Benoit, 1977; Odekunle et al., 2005). These methods do not help clarify the relationship between the onset of the growing and precipitation seasons, when the seasons are not entirely synchronised. Cumulative % precipitation (Ilesanmi, 1972) is the most widely used indicator of the onset and cessation of the precipitation season independent of other climatic and vegetation factors (Adejuwon et al., 1990; Adejuwon and Odekunle, 2006; Odekunle, 2006). In this method, daily % precipitation data are processed to generate 5-day means. Us-ing these means, cumulative precipitation is plotted against time of year. On these plots, the point of maximum positive curvature is defined as the onset of the precipitation season, whereas the point of maximum negative curvature is defined as the cessation of the season. Points of onset typically hap-pen at the time when cumulative % precipitation is between 7–8 %, while times of cessation are when cumulation reaches about 90 % (Ilesanmi, 1972). In our analysis, we apply Ile-sanmi’s (1972) approach to monthly data. Spatial averages of monthly precipitation calculated for the different eleva-tion zones were used to generate cumulative % precipitaeleva-tion curves for each zone as a function of time of year.
3.4 Correlation and causality
Pearson’s correlation describes the statistical co-variation between two variables (Gotelli and Ellison, 2013); it does not address matters of cause and effect. Correlation is em-ployed in this study primarily to establish the strength of as-sociation between paired combinations of state variables to help form an initial description of potentially relevant eco-hydrometeorological relationships.
Recent advances in dynamic-systems analysis have re-sulted in the development of innovative methods for identify-ing causality in time series data (Sugihara et al., 2012). One such method, convergent cross-mapping, is a model-free
ap-January February Marc
April May Jun
July August Septembe
October November Decembe
January February March
April May June
July August September
October November December
90
0 45
Evaporation (kg m-2 month-1)
Figure 4. Ten-year average distribution of monthly evaporation (kg m−2month−1)as a function of time of year.
proach that helps identify causality and direction of causality in dynamically evolving systems. Time series variables are considered causally connected if both are derived from the same dynamic system. Convergent cross-mapping checks for causation by measuring the extent historical registrations in one variable (i.e. time series one) can consistently approx-imate the state in a second variable (time series two). The method is able to provide reliable description of causality even in the presence of system feedback and confoundedness (Sugihara et al., 2012). Moreover, convergent cross-mapping involves convergence, an important methodological attribute that differentiates causation from ordinary correlation (Ma-her and Hernandez, 2015). In general, non-causal relation-ships are illustrated as flat curves of predictive skill, based on calculations of Pearson’s correlation between predictions and actual observations, with respect to variations in time series length. Causation is suggested when convergence is present and Pearson’s correlation at the point of convergence is greater than zero. It is always possible to get bi-directional convergence when variables are strongly forced by an exter-nal third variable, resulting in synchrony between variables being assessed. Synchrony should be tested for convergent cross-mapping to determine bi-directional pairing (Sugihara et al., 2012; Clark et al., 2015). When synchrony exists, it can sometimes be minimised by processing the “first differ-ence” of cross-correlated variables by subtracting previous observations (at timet−1) from current observations (att )
evapo-ration in the oases, and (ii) evapoevapo-ration in the oases and pro-duction of precipitation in the high mountains, most notably in zone 4 (Fig. 2a).
4 Results and discussion
4.1 Vegetation development timing
Onset of greening occurs mostly in early April, except in some parts of the study area, where the growing season is slightly advanced (i.e. initiating in late March; Fig. 3). In the forest and meadow areas of the mountains, the grow-ing season commences in May, and in some parts, in June. Early changes in vegetation development patterns (changes in monthly enhanced vegetation index) in the upper moun-tains of the river basins may occur as a result of localised melting of the snowpack during a time when atmospheric temperatures are favourable for plant growth. Vegetation growth reaches its peak in July–August and dies back in all areas of the study area in November, except in the high mountains of the Hei River basin, where vegetation senes-cence is observed to occur in October.
4.2 Oasis enhanced vegetation index development vs. evaporation
Average regional evaporation (Fig. 4) as a function of av-erage enhanced vegetation index (Fig. 3) over the growing season (April through October) suggests that regional evap-oration has the strongest positive correlation with vegetation in the oases, with very highr2values when crops and dense grass were considered; i.e. 0.85, 0.83 and 0.84, 0.73 for the Shiyang and Hei river basins, respectively. Correlation with land cover types in the mountains is also present, but at a much reduced level (Table 3).
Convergent cross-mapping of oases time series data of en-hanced vegetation index with evaporation indicates feedback (bi-directional causality) between the two variables (p val-ues<0.05; Fig. 5a and b), with plant-mediated evaporation providing marginally stronger control over plant growth, i.e. Pearson’s correlation coefficient at the point of convergence (i.e. at the largest record length) for “B causes A” is greater than that for “A causes B”, where A represents changes in en-hanced vegetation index and B, changes in oasis evaporation (Fig. 5b). Figure 5a and b give the results with respect to the original, unprocessed time series data and “first differencing” of the original data, respectively. Both are provided because convergence illustrated in Fig. 5a does not completely guar-antee bi-directional causality, because of the possibility of synchrony between the two variables.
Bi-directional causality between the seasonal evolution of oasis vegetation and evaporation (transpiration) is not sur-prising, as the transpiration process is central to moving water-soluble nutrients vital to plant growth from the soil to the various parts of the plant (Kimmins, 1997) and in
Figure 5.Predictive-skill curves based on Pearson’s correlation co-efficients for convergent cross-mapping of enhanced vegetation in-dex (EVI) with evaporation in the oases(a, b)and evaporation in the oases with precipitation production in zone 4(c, d). Plots(a) and(c)are based on the original time series data, whereas plots(b) and(d) are based on the “first differencing” of the original data. Dotted lines on either side of the predictive-skill curves represent the±standard error of estimate assessed from bootstrapping based on 3000 iterations. Convergent cross-mapping is based on proce-dures written in the R-programming language initially developed by Clark et al. (2015). The feature that assures causality in vari-ables is the convergence in the predictive curves as record length increases. Lack of convergence with low Pearson’s correlation co-efficients indicates lack of causality. The variable with the highest Pearson’s correlation coefficients indicates the stronger controlling variable. When curves for both variables are convergent (as is the case here), bi-directional causality and, thus, feedback is indicated. Analyses are based on embedded dimensions and time delays of 4 and 1, respectively (Sugihara et al., 2012).
Table 3.Regression fits (y=mx+b;m=slope andb=yintercept) and their associated coefficients of determination (r2)for comparisons between basin-level monthly evaporation over a 10-year period (2000–2009) as a function of same-month enhanced vegetation index for different vegetated-cover types (subset of land cover types in Table A1 and Fig. 1). Vegetated-cover types are ordered according to their position in the basins (Fig. 1), starting with vegetation types in zone 1 (<2500 m a.m.s.l.).
Land cover type Shiyang River basin Hei River basin
m b r2 m b r2
Crops 175.87 −6.92 0.85 157.47 −3.5 0.84
Dense grass in oases 175.84 −8.32 0.83 170.06 −7.78 0.73
Sparse grass and/or shrubs 218.23 −2.97 0.54 214.39 −1.1 0.49
Alpine meadow 83.80 16.18 0.32 90.57 12.82 0.41
Coniferous forest 74.77 22.58 0.27 97.46 15.57 0.39
Deciduous shrubs 46.26 23.81 0.12 79.21 16.56 0.42
Table 4.Coefficients of determination (r2)for comparisons between zone-specific precipitation (zones associated with column 1) with same-month, same-zone, or oasis enhanced vegetation index (EVI) and evaporation (E; zones associated with row 1) for the Shiyang and Hei river basins, respectively. Cells associated with comparisons that were not addressed in the analysis, are marked with a “–”. Values ofr2that are in bold are derived for comparisons between zone-specific precipitation with same-month, same-zone EVI andE; values not in bold, are for comparisons between zone-specific precipitation with same-month oasis EVI andE.
Elevation zone∗ River basin 1 2 3 4
EVI E EVI E EVI E EVI E
1 Shiyang River 0.44 0.41 – – – – – –
Hei River 0.51 0.39 – – – – – –
2 Shiyang River 0.54 0.52 0.61 0.34 – – – –
Hei River 0.68 0.56 0.62 0.34 – – – –
3 Shiyang River 0.61 0.55 – – 0.52 0.20 – –
Hei River 0.78 0.68 – – 0.69 0.43 – –
4 Shiyang River 0.65 0.57 – – – – 0.44 0.18
Hei River 0.85 0.77 – – – – 0.75 0.47
∗Zones are classified according to elevation bands:<2500 m (zone 1), 2500–3300 m (zone 2), 3300–3900 m (zone 3), and
>3900 m a.m.s.l. (zone 4).
(e.g. Fig. 2b), promoting improved growing conditions for the vegetation during the hotter part of the growing season. 4.3 Evaporation in the oases vs. precipitation in the
high mountains
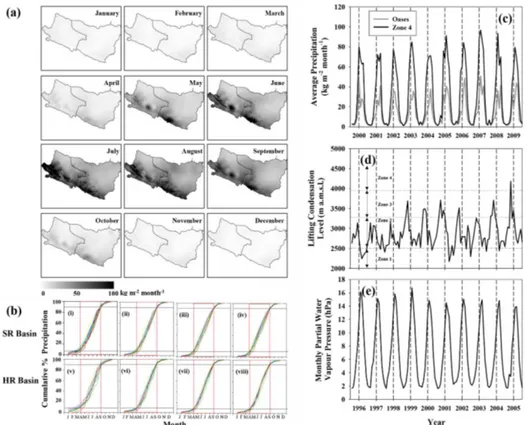
The precipitation season for the most part starts in late April to early May (Fig. 6a through c) and ends in September with nominal interannual variation in timing. The greatest interan-nual variation in cumulative % amounts is observed to occur in the lowlands (zone 1) of both river basins, and the least in the mountains (e.g. zones 3 and 4; Fig. 6b). Interannual variation in the lowlands is most likely associated with the convective nature of locally generated precipitation (Zhang et al., 2010).
Pairwise correlations within individual river basins reveal that within-zone vegetation is weakly associated with pre-cipitation generated locally (i.e. within the same zone), but precipitation in the mountains has the strongest correlation
Figure 6.Ten-year average distribution and time series of monthly precipitation (kg m−2month−1)according to time of year(a, c)and spatially averaged cumulative curves of % precipitation over the course of individual years for 2000–2009(b). Letters along thexaxis of plots in (b)coincide with month, January (J) through to December (D). Vertical red lines denote the approximate time of the onset (first line) and cessation of the precipitation season (second line) in the Shiyang (SR Basin; i–iv) and Hei river basins (HR Basin; v– vii), respectively. Plots(i)through(iv)and(v)through(vii)represent the cumulative % precipitation in the two river basins for zone 1 through zone 4. Panels(d)and(e)give the monthly mean lifting condensation level (LCL) and actual water vapour content of air at the base of the Qilian Mountains (i.e. Wuwei City; Table 1) over a different 10-year period (1996–2005). Values of LCL are calculated from (Tdry−Tdew)/(Ŵdry−Ŵdew)×1000 m+elevation at base of Qilian Mountains (i.e. 1534 m at Wuwei City), whereTdryandTdeware the monthly surface dry-bulb and dew-point temperature (both in◦C), andŴdryandŴdeware the dry adiabatic and dew-point temperature lapse rates,∼10 vs.∼2◦C per 1000 m, respectively (Warner, 2004; Aguado and Burt, 2013). Vertical dashed lines in(c)to(e)represent the middle of the year.
Convergent cross-mapping of time series data of oasis evaporation with precipitation in the high mountains of both river basins also correctly points to bi-directional causality (feedback) between the two variables (pvalues<0.05 for all instances, except one; Fig. 5c and d), with the lowland pro-duction of water vapour providing the stronger control be-tween the two variables (Fig. 5d). Rainwater generated in the high mountains eventually returns to the oases during the same growing season. This source of water is, in turn, used to promote continued vegetation growth in the oases and the production of water vapour during the growing pe-riod (see Sect. 4.2), intensifying the production of precipi-tation in the mountains. During the non-growing part of the year (i.e. November through February of the following year), in-mountain precipitation amounts are observed to be consis-tently lower than the rest of the year (Fig. 6a and c). This is mainly due to the fact that vegetation growth (Fig. 3), evap-oration (Fig. 4), and water vapour content at the base of the
mountains (Fig. 6e) are their smallest and least effective dur-ing this time of year. This trend was also observed in an ear-lier study examining the level and coverage of snow (as a passive tracer) in the mountains in the same area during the non-growing part of the year replicated in simulations with process models and assessed as part of an analysis of remote sensing optical (MODIS) and passive microwave data (e.g. Advanced Microwave Scanning Radiometer-Earth Observ-ing System; Bourque and Matin, 2012; Matin and Bourque, 2013a).
to be slightly greater in the Shiyang River basin than in the Hei River basin (Table 3). The Hei River basin may at times receive water vapour from the Shiyang River basin, but the possibility of that occurring is significantly reduced, given that winds from the east to east-north-east sector are quite uncommon (<5 % of the time; Fig. 7a) and mountains in the Shiyang River basin may cause water vapour content of the affected air to be reduced by orographic lifting. Small oases west of Zhangye Oasis (e.g. Jinta and Jiuguan oases) are not geographically in position for the prevailing winds of the area (i.e. north-west to north-north-west winds) to contribute sig-nificant amounts of water vapour to the upper portion of the Hei River basin.
Asynchrony in the start of the oasis growing and in-mountain precipitation seasons (Figs. 3 and 6), suggests that the amount of water vapour sufficient to trigger the precip-itation season in the Qilian Mountains requires on average at least 1 month of active plant growth to ensue (Fig. 8). Commencement of the growing season in the oases is gov-erned to a large extent by the warming atmosphere during early spring (i.e. with the accrual of sufficient growing degree days) and accessibility to adequate soil water. A vital source of water to support initial vegetation growth in the oases is surface water generated by snowmelt in the plain and lower-mountain positions (<3300 m a.m.s.l.) during the March– April period of each year (Fig. 8). Meltwater production in the lower mountains of both river basins is about the same (i.e. 250×106m3in the Shiyang vs. 223×106m3in the Hei river basins, respectively), whereas it is substantially greater in the mid- to high-mountain portions of the Hei River basin (i.e. 299×106m3in the Shiyang vs. 1129×106m3 in the Hei river basins), as a result of differences in respective land-surface area at high elevations, i.e. 2979 vs. 10 328 km2for the Shiyang and Hei river basins. Delivery of this snowmelt water to the oases occurs until August, when air temperatures in the high mountains begin to drop (Fig. 8c and d).
4.4 Zone-specific water yield
Comparisons between annual cumulative water volumes as-sociated with the sum of rainfall and snowmelt with those of evaporation for corresponding elevation zones and for the total river basin show that annual water volumes as-sociated with evaporation (E) exceeds those of rainfall (P)+snowmelt (S) in the oases (i.e. P+S−E <0 and
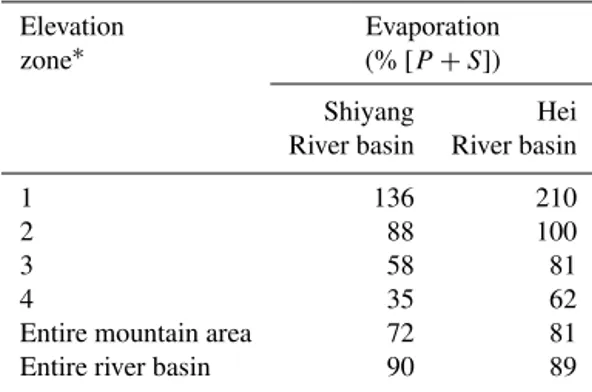
E /(P+S)>100 %), with the opposite being true in the mountains (i.e.P+S−E >0 andE /(P+S)<100 %; Ta-ble 5). Volume ratios in the mountains [i.e.E /(P+S)] tend to decrease with increased elevation because of correspond-ing increases in rainfall and snowmelt (to a certain elevation threshold; see Matin and Bourque, 2015) and decreases in evaporation. Total water volume associated with rainfall and snowmelt collectively is about equal to that of evaporation at the river basin level, i.e. 90 and 89 % for the Shiyang and Hei river basins, respectively (Table 5). Given the importance of
Table 5. Evaporation as a percentage of the annual sum of
di-rect rainfall (P) and snowmelt volumes (S) for individual elevation zones and mountain area within the Shiyang and Hei river basins and for the entire river basin, respectively. Percentages are based on 10-year sums.
Elevation Evaporation
zone∗ (% [P+S])
Shiyang Hei
River basin River basin
1 136 210
2 88 100
3 58 81
4 35 62
Entire mountain area 72 81
Entire river basin 90 89
∗Zones are classified according to elevation bands, i.e.<2500 m
(zone 1), 2500–3300 m (zone 2), 3300–3900 m (zone 3), and
>3900 m a.m.s.l. (zone 4).
in-mountain production of precipitation to the local hydro-logical cycle, this suggests that a significant fraction of pre-cipitation originating in the mountains and returning to the oasis as surface and shallow-subsurface runoff is likely to re-turn to the mountains as evaporated water. Given the right wind directions (Fig. 7), water vapour generated by the oa-sis can travel across boundaries of river basins and contribute to the production of precipitation in the mountains of neigh-bouring basins. Once deposited, surface water is mostly con-fined to the basin that precipitation was formed in. These re-sults and all other rere-sults in preceding sections are consistent with a hydrologically closed system.
Recycling ratios for the study area are expected to be sig-nificantly greater that those reported in the global moisture-recycling analysis by van der Ent et al. (2010) (i.e. <5 % for north-west China, based on their Fig. 5, contrasted with potentially as high as 90 %, for this study). Since regional re-cycling ratios are scale dependent (van der Ent et al., 2010), these differences are not to be unexpected. The grid cell size (scale) used in the current study (250 m×250 m) may have allowed for the capture of information that was effectively in-visible to the global analysis, based on a 1.5◦latitude×1.5◦ longitude scale (van der Ent et al., 2010).
5 Conclusions
(a)
N
E
S
W 20 20
20
20
15 15
15
15
10 10
10
10
5 5
5
5 N
E
S
W 20 20
20
20
15 15
15
15
10 10
10
10
5 5
5
5
Zhangye Oasis (Zhangye)
Liangzhou Oasis (Wuwei)
48.1%
61.3%
(b)
Zhangye
Wuwei
Shiyang River Watershed
Hei River Watershed
Figure 7.Wind direction frequency roses for Zhangye and Liangzhou oases(a)and calculated wind velocity and direction using a computa-tional fluid-flow dynamics model (b; Lopes, 2003) for prevailing wind directions from the north-east (upper diagrams) and north-west (lower diagram) and July peak near-surface air temperatures (Fig. 2b). Percent values in(a)represent the portion of the time during the growing season that prevailing winds are in directions that will lead to the production of orographic precipitation in the Qilian Mountains (i.e. winds from the north-west to east-south-east directions).
Figure 8.Ten-year mean monthly snowmelt generated within the
different elevation zones(a, b)and mean monthly contribution of rainwater and snowmelt to the monthly river runoff from the Qil-ian Mountains (based on previous work by Matin and Bourque, 2015) and corresponding monthly enhanced vegetation index for the Shiyang(c)and Hei river basins(d)for the 2000–2009 period.
Appendix A: Land cover types
Vegetation distribution in the study area (Fig. 1 of the main text) has a unique preferential association with elevation, slope, and slope direction (Jin et al., 2008). For instance,
<2500 m a.m.s.l., the growing environment for spring wheat (prominent crop grown in the study area) and dense grass is limited to the desert oases (Zhao et al., 2005; Fig. 1). North-facing slopes of the Qilian Mountains support alpine meadows at elevations between 2500 and 3300 m a.m.s.l. At elevations>3300 m a.m.s.l., deciduous shrubs represent the most dominant vegetation type. Isolated patches of conifer forests in the Qilian Mountains (mostly consisting of Qing-hai spruce,Picea crassifolia) are found to grow best at ele-vations between 2500 and 3300 m a.m.s.l. (Carpenter, 2001). Seasonal vegetation density and growth vary as a function of both vegetation type and elevation.
The MODIS-based annual global land cover map currently available, as of 2012, is produced from seven spectral maps, bi-directional reflectance distribution function adjusted re-flectance, land-surface temperature, enhanced vegetation in-dex, and an application of supervised classification using ground data from 1860 field sites (Friedl et al., 2010). As-sessments of the product have shown that this map is not en-tirely realistic for zones of steep transition, particularly in mountainous areas (Liang and Gong, 2010). Improved
land-Table A1.Land cover type definition as a function of elevation zone, enhanced vegetation index (EVI), and slope orientation.
Zone∗ Land cover type Classification thresholds
1 Desert Maximum growing-season EVI<0.113
Crop Maximum growing-season EVI>0.27 and minimum growing-season EVI<0.113
Dense grass Maximum growing-season EVI<0.27 and minimum growing season EVI>0.113
Sparse grass and/or shrub Maximum growing-season EVI between 0.113 and 0.27 and mean growing season EVI>0.113 Bare ground Maximum growing-season EVI between 0.113 and 0.27 and mean growing season EVI<0.113
2 Alpine meadow Maximum growing-season EVI>0.27 and on north-facing slopes
Coniferous forest Maximum growing-season EVI>0.27, but not on north-facing slopes Sparse grass and/or shrub Maximum growing season EVI between 0.113 and 0.27
Bare ground Maximum growing-season EVI<0.113
3 Deciduous shrub Maximum growing-season EVI>0.27
Bare ground Maximum growing-season EVI<0.27
4 Sparse shrub Maximum growing-season EVI>0.113
Snow and/or ice Maximum growing-season EVI<0.113
∗Zones are classified according to elevation bands:<2500 m (zone 1), 2500–3300 m (zone 2), 3300–3900 m (zone 3), and>3900 m a.m.s.l. (zone 4).
cover definition at regional or local scales with supervised classification usually involves much greater amounts of ground data that are normally available for most regions. Re-cently, decision-tree-based classifications have been applied to remote sensing data and have been shown to produce better results than other classification systems, based on maximum likelihood or unsupervised clustering and labelling (Friedl and Brodley, 1997). One benefit of decision-tree-based clas-sification is that it is able to use local knowledge of vege-tation characteristics together with other pertinent informa-tion, such as terrain characteristics, in its evaluation. In the current study, chronological sequences of MODIS-based en-hanced vegetation index and digital terrain information of the study area (e.g. slope orientation, elevation) are used to clas-sify land cover with a decision-tree classifier.
Acknowledgements. This study was jointly funded by (i) Lanzhou Regional Climate Centre of the Gansu Provincial Meteorological Bureau (GMB), Lanzhou, China (National Natural Science Foun-dation of China, grant no. 40830957); (ii) the Natural Science and Engineering Research Council of Canada (NSERC) through a Discovery Grant to CPAB; and (iii) the Faculty of Forestry and Environmental Management, University of New Brunswick, New Brunswick, Canada, with its financial support of MAM in the form of graduate student research and teaching assistantships. We would like to acknowledge the USA National Aeronautics and Space Administration and Geological Survey for providing MODIS and SRTM v. 4 DEM data free of charge. Finally, we are grateful for the suggestions provided by two reviewers of the initial manuscript.
Edited by: M. Hrachowitz
References
Aarnoudse, E., Bluemling, B., Wester, P., and Qu, W.: The role of collective groundwater institutions in the implementation of di-rect groundwater regulation measures in Minqin County, China, Hydrogeol. J., 20, 1213–1221, doi:10.1007/s10040-012-0873-z, 2012.
Adejuwon, J. O. and Odekunle, T. O.: Variability and the severity of the “Little Dry Season” in southwestern Nigeria, J. Climate, 19, 483–493, doi:10.1175/jcli3642.1, 2006.
Adejuwon, J. O., Balogun, E. E., and Adejuwon, S. A.: On the annual and seasonal patterns of rainfall fluctuations in sub-saharan West Africa, Int. J. Climatol., 10, 839–848, doi:10.1002/joc.3370100806, 1990.
Aguado, E. and Burt, J. E.: Undertstanding Weather and Climate, 6th Edn., Pearson Education Inc., NY, 552 pp., 2013.
Ahl, D. E., Gower, S. T., Burrows, S. N., Shabanov, N. V., Myneni, R. B., and Knyazikhin, Y.: Monitoring spring canopy phenology of a deciduous broadleaf forest using MODIS, Remote Sens. En-viron., 104, 88–95, doi:10.1016/j.rse.2006.05.003, 2006. Akiyama, T., Sakai, A., Yamazaki, Y., Wang, G., Fujita, K.,
Nakawo, M., Kubota, J., and Konagaya, Y.: Surfacewater-groundwater interaction in the Heihe River Basin, Northwest China, Bull. Glaciol. Res., 24, 87–94, 2007.
Benoit, P.: The start of the growing season in Northern Nigeria, Agr. Meteorol., 18, 91–99, doi:10.1016/0002-1571(77)90042-5, 1977.
Bourque, C. P.-A. and Hassan, Q. K.: Vegetation control in the long-term self-stabilization of the Liangzhou Oasis of the up-per Shiyang River watershed of westcentral Gansu, Northwest China, Earth Interact., 13, 1–22, doi:10.1175/2009ei286.1, 2009. Bourque, C. P.-A. and Matin, M. A.: Seasonal snow cover in the Qilian Mountains of Northwest China: Its dependence on oasis seasonal evolution and lowland production of water vapour, J. Hydrol., 454–455, 141–151, 2012.
Carpenter, C.: Montane grasslands and shrublands, available at: https://www.worldwildlife.org/ecoregions/pa1015 (last access: 26 July 2015), 2001.
CGIAR-CSI: SRTM 90-m digital elevation data, available at: http: //srtm.csi.cgiar.org/ (last access: 26 July 2015), 2008.
Chu, P. C., Lu, S., and Chen, Y.: A numerical modeling study on desert oasis self-supporting mechanisms, J. Hydrol., 312, 256– 276, 2005.
Clark, A. T., Ye, H., Isbell, F., Deyle, E. R., Cowles, J., Tilman, G. D., and Sugihara, G.: Spatial “convergent cross mapping” to detect causal relationships from short time-series, Ecology, 96, 1174–1181, doi:10.1890/14-1479.1, 2015.
Currell, M. J., Han, D. M., Chen, Z. Y., and Cartwright, I.: Sustainability of groundwater usage in northern China: de-pendence on palaeowaters and effects on water quality, quan-tity and ecosystem health, Hydrol. Process., 26, 4050–4066, doi:10.1002/Hyp.9208, 2012.
Davidson, A. and Wang, S. S.: Spatiotemporal variations in land surface albedo across Canada from MODIS observations, Can. J. Remote Sens., 31, 377–390, 2005.
Ding, H. and Zhang, J.: Relationships between sustainable develop-ment and water resources in arid oases area – an example of Hexi Corridor, J. Arid Land Resour. Environ., 18, 50–55, 2004. Fischer, A.: A model for the seaonal-variations of vegetation
indexes in coarse resolution data and its inversion to ex-tract crop parameters, Remote Sens. Environ., 48, 220–230, doi:10.1016/0034-4257(94)90143-0, 1994.
Fisher, J. I. and Mustard, J. F.: Cross-scalar satellite phenology from ground, Landsat, and MODIS data, Remote Sens. Environ., 109, 261–273,
doi10.1016/j.rse.2007.01.004, 2007.
Friedl, M. A. and Brodley, C. E.: Decision tree classification of land cover from remotely sensed data, Remote Sens. Environ., 61, 399–409, 1997.
Friedl, M. A., Sulla-Menashe, D., Tan, B., Schneider, A., Ra-mankutty, N., Sibley, A., and Huang, X. M.: MODIS collec-tion 5 global land cover: algorithm refinements and characteri-zation of new datasets, Remote Sens. Environ., 114, 168–182, doi:10.1016/j.rse.2009.08.016, 2010.
Gao, B. C. and Kaufman, Y. J.: Water vapor retrievals using moder-ate resolution imaging spectroradiometer (MODIS) near-infrared channels, J. Geophys. Res.-Atmos., 108, ACH4.1–ACH4.10, doi:10.1029/2002jd003023, 2003.
Gao, Y., Chen, Y., and Lu, S.: Numerical simulation of the critical scale of oasis maintenance and development in the arid regions of northwest China, Adv. Atmos. Sci., 21, 113–124, 2004. Gao, Y., Wang, G., Liu, H., Liu, Z., Lin, W., and Wang, J.:
Land-form effects the distribution and circular mode on groundwater in Shiyang River basin, Beijing, China, available at: http://en.cgs. gov.cn/Achievement/The34thCongress/Evolutional/18050.htm (last access: 26 July 2015), 2006.
Gates, J. B., Edmunds, W. M., Darling, W. G., Ma, J. Z., Pang, Z. H., and Young, A. A.: Conceptual model of recharge to southeastern Badain Jaran Desert groundwater and lakes from environmental tracers, Appl. Geochem., 23, 12, 3519–3534, doi:10.1016/j.apgeochem.2008.07.019, 2008a.
Gates, J. B., Edmunds, W. M., Ma, J. Z., and Scanlon, B. R.: Estimating groundwater recharge in a cold desert environment in northern China using chloride, Hydrogeol. J., 16, 893–910, 2008b.
Gotelli, N. J. and Ellison, A. M.: A Primer of Ecological Statistics, Sinauer Associates, Inc., Sunderland, MA, USA, 510 pp., 2013. Granger, C. W. J. and Newbold, P.: Spurious regressions in
Gu, J., Li, X., and Huang, C. L.: Land cover classification in Heihe River Basin with time series MODIS NDVI data. Fifth Interna-tional Conference on Fuzzy Systems and Knowledge Discovery, Vol. 2, Proceedings, 477–481, doi:10.1109/Fskd.2008.517, 2008. Huang, L. J. and Wen, X. F.: Temporal variations of atmospheric water vaporδD andδ18O above an arid artificial oasis cropland in the Heihe River Basin, J. Geophys. Res.-Atmos., 119, 11456– 11476, 2014.
Hudson, I. L., Keatley, M. R., Beurs, K., and Henebry, G.: Spatio-temporal statistical methods for modelling land surface phenol-ogy, in: Phenological Research, edited by: Hudson, I. L. and Keatley, M. R., Springer Netherlands, 177–208, 2010.
Huete, A. R., Litu, H. Q., Batchily, K., and Leeuwen, W. V.: A comparison of vegetation indices over a global set of TM im-ages for EOS-MODIS, Remote Sens. Environ., 59, 440–451, doi:10.1016/S0034-4257(96)00112-5, 1997.
Huete, A. R., Didan, K., Miura, T., Rodriguez, E. P., Gao, X., and Fereira, L. G.: Overview of the radiometric and biophysical per-formance of the MODIS vegetation indices, Remote Sens. Envi-ron., 83, 195–213, doi:10.1016/S0034-4257(02)00096-2, 2002. Huo, Z. L., Feng, S. Y., Kang, S. Z., Li, W. C., and Chen, S. J.:
Effect of climate changes and water-related human activities on annual stream flows of the Shiyang river basin in and North-West China, Hydrol. Process., 22, 3155–3167, doi:10.1002/Hyp.6900, 2008.
Ilesanmi, O. O.: Empirical formulation of onset, advance, and re-treat of rainfall in Nigeria, J. Trop. Geogr., 34, 17–24, 1972. Ji, X. B., Kang, E. S., Chen, R. S., Zhao, W. Z., Zhang, Z.
H., and Jin, B. W.: The impact of the development of wa-ter resources on environment in arid inland river basins of Hexi region, Northwestern China, Environ. Geol., 50, 793–801, doi:10.1007/s00254-006-0251-z, 2006.
Jia, L., Shang, H., Hu, G., and Menenti, M.: Phenological response of vegetation to upstream river flow in the Heihe Rive basin by time series analysis of MODIS data, Hydrol. Earth Syst. Sci., 15, 1047–1064, doi:10.5194/hess-15-1047-2011, 2011.
Jin, X. M., Zhang, Y. K., Schaepman, M. E., Clevers, J. G. P. W., and Su, Z.: Impact of elevation and aspect on the spatial dis-tribution of vegetation in the qilian mountain area with remote sensing data, The International Archives of the Photogramme-try, Remote Sensing and Spatial Information Sciences, XXXVII, Part B7, 2008.
Jonsson, P. and Eklundh, L.: Seasonality extraction by function fit-ting to time-series of satellite sensor data, IEEE T. Geosci. Re-mote, 40, 1824–1832, doi:10.1109/Tgrs.2002.802519, 2002. Kang, E. S., Cheng, G. D., Lan, Y. C., and Jin, H. J.: A model
for simulating the response of runoff from the mountainous watersheds of inland river basins in the arid area of north-west China to climatic changes, Sci. China Ser. D, 42, 52–63, doi:10.1007/Bf02878853, 1999.
Kang, S. Z., Su, X. L., Tong, L., Shi, P. Z., Yang, X. Y., Abe, Y. K., Du, T. S., Shen, Q. L., and Zhang, J. H.: The impacts of human activities on the water-land environment of the Shiyang River basin, an arid region in northwest China, Hydrolog. Sci. J., 49, 413–427, doi:10.1623/hysj.49.3.413.54347, 2009.
Karlsen, S. R., Elvebakk, A., Hogda, K. A., and Johansen, B.: Satellite-based mapping of the growing season and bioclimatic zones in Fennoscandia, Glob. Ecol. Biogeogr., 15, 416–430, doi:10.1111/j.1466-822x.2006.00234.x, 2006.
Kimmins, J. P.: Forest Ecology: A Foundation for Sustainable Man-agement, Prentice Hall, NJ, 596 pp., 1997.
Kaufman, Y. J. and Gao, B. C.: Remote sensing of water vapor in the near IR from EOS/MODIS, IEEE T. Geosci. Remote, 30, 871– 884, doi:10.1109/36.175321, 1992.
Kent-Corson, M. L., Ritts, B. D., Zhuang, G. S., Bovet, P. M., Gra-ham, S. A., and Chamberlain, C. P.: Stable isotopic constraints on the tectonic, topographic, and climatic evolution of the north-ern margin of the Tibetan Plateau, Earth Planet. Sc. Lett., 282, 158–166, 2009.
Li, F., Zhu, G., and Guo, C.: Shiyang River ecosystem
problems and countermeasures, Agr. Sci., 4, 72–78,
doi:10.4236/as.2013.42012, 2013.
Li, X., Cheng, G., Liu, S., Xiao, Q., Ma, M., Jin, R., Che, T., Liu, Q., Wang, W., Qi, Y., Wen, J., Li, H., Zhu, G., Guo, J., Ran, Y., Wang, S., Zhu, Z., Zhou, J., Hu, X., and Xu, Z.: Heihe water-shed allied telemetry experimental research (HiWATER): Scien-tific objectives and experimental design, B. Am. Meteorol. Soc., 94, 1145–1160, doi:10.1175/BAMS-D-12-00154.1, 2013. Li, X. Y., Xiao, D. N., He, X. Y., Chen, W., and Song, D.
M.: Factors associated with farmland area changes in arid re-gions: a case study of the Shiyang River Basin, Northwest-ern China, Front. Ecol. Environ., 5, 139–144, doi:10.1890/1540-9295(2007)5[139:Fawfac]2.0.Co;2, 2007.
Li, Z. L., Xu, Z. X., Li, J. Y., and Li, Z. J.: Shift trend and step changes for runoff time series in the Shiyang River Basin, Northwest China, Hydrol. Process., 22, 4639–4646, doi:10.1002/Hyp.7127, 2008.
Liang, L. and Gong, P.: An assessment of MODIS collection 5 global land cover product for biological conservation studies. Eighteen International Conference on Geoinformatics, 2010. Lloyd, D.: A phenological classification of terrestrial vegetation
cover using shortwave vegetation index imagery, Int. J. Remote Sens., 11, 2269–2279, 1990.
Lopes, A. M. G.: WindStation – a software for the simulation of atmospheric flows over complex topography, Environ. Model. Softw., 18, 81–96, doi:10.1016/s1364-8152(02)00024-5, 2003. Lu, A., Ding, Y., Pang, H., Yuan, L., and He, Y.: Impact of global
warming on water resource in arid area of northwest China, J. Mt. Sci., 2, 313–318, 2005.
Ma, J. Z., Ding, Z. Y., Gates, J. B., and Su, Y.: Chloride and the envi-ronmental isotopes as the indicators of the groundwater recharge in the Gobi Desert, northwest China, Environ. Geol., 55, 1407– 1419, 2008.
Ma, J. Z., Ding, Z. Y., Edmunds, W. M., Gates, J. B., and Huang, T. M.: Limits to recharge of groundwater from Tibetan plateau to the Gobi desert, implications for water management in the moun-tain front, J. Hydrol., 364, 128–141, 2009.
Ma, J. Z., Zhang, P., Zhu, G. F., Wang, Y. Q., Edmunds, W. M., Ding, Z. Y., and He, J. H.: The composition and distribution of chemicals and isotopes in precipitation in the Shiyang River sys-tem, northwestern China, J. Hydrol., 436–437, 92–101, 2012. Ma, J. Z., Chen, L. H., He, J. H., Zhang, Y. R., Li, X. H., and
Maher, M. C. and Hernandez, R. D.: CauseMap: fast infer-ence of causality from complex time series, Peer J, 3, e824, doi:10.7717/peerj.824, 2015.
Markon, C. J., Fleming, M. D., and Binnian, E. F.: Characteristics of vegetation phenology over the Alaskan landscape using time-series data, Polar Rec., 31, 179–190, 1995.
Matin, M. A. and Bourque, C. P.-A.: Intra- and inter-annual vari-ations in snow-water storage in data sparse desert-mountain re-gions assessed from remote sensing, Remote Sens. Environ., 139, 18–34, doi:10.1016/j.rse.2013.07.033, 2013a.
Matin, M. A. and Bourque, C. P.-A.: Assessing spatiotemporal vari-ation in actual evapotranspirvari-ation for semi-arid watersheds in northwest China: Evaluation of two complementary-based meth-ods, J. Hydrol., 486, 455–465,
doi10.1016/j.jhydrol.2013.02.014, 2013b.
Matin, M. A. and Bourque, C. P.-A.: Mountain-river runoff components and their role in the seasonal development of desert-oases in northwest China, J. Arid Environ., 122, 1–15, doi:10.1016/j.jaridenv.2015.05.011, 2015.
Martinez, B. and Gilabert, M. A.: Vegetation dynamics from NDVI time series analysis using the wavelet transform, Remote Sens. Environ., 113, 1823–1842, doi:10.1016/j.rse.2009.04.016, 2009. Meng, X., Lu, S., Zhang, T., Ao, Y., Li, S., Bao, Y., Wen, L., and Luo, S.: Impacts of inhomogeneous landscapes in oasis interior on the oasis self-maintenance mechanism by integrating numeri-cal model with satellite data, Hydrol. Earth Syst. Sci., 16, 3729– 3738, doi:10.5194/hess-16-3729-2012, 2012.
Meng, X., Lu, S., Gao, Y., and Guo, J.: Simulated effects of soil moisture on oasis self-maintenance in a surround-ing desert environment in Northwest China, Int. J. Climatol., doi:10.1002/joc.4271, 2015.
Meng, X. H., Lu, S. H., Zhang, T. T., Guo, J. X., Gao, Y. H., Bao, Y., Wen, L. J., Luo, S. Q., and Liu, Y. P.: Numerical simulations of the atmospheric and land conditions over the Jinta oasis in north-western China with satellite-derived land surface parameters, J. Geophys. Res., 114, D06114, doi:10.1029/2008JD010360, 2009. Meybeck, M.: Global analysis of river systems: from Earth system controls to anthropocene syndromes, Philos. T. R. Soc. B, 358, 1935–1955, doi:10.1098/rstb.2003.1379, 2003.
Meybeck, M., Green, P., and Vorosmarty, C.: A new typol-ogy for mountains and other relief classes: An applica-tion to global continental water resources and populaapplica-tion distribution, Mt. Res. Dev., 21, 34–45, doi:10.1659/0276-4741(2001)021[0034:Antfma]2.0.Co;2, 2001.
Monteith, J. L.: Evaporation and environment, Sym. Soc. Exp. Biol., 19, 205–234, 1965.
Myneni, R. B., Keeling, C. D., Tucker, C. J., Asrar, G., and Nemani, R. R.: Increased plant growth in the northern high latitudes from 1981 to 1991, Nature, 386, 698–702, doi:10.1038/386698a0, 1997.
Odekunle, T. O.: Determining rainy season onset and retreat over Nigeria from precipitation amount and number of rainy days, Theor. Appl. Clim., 83, 193–201, doi:10.1007/s00704-005-0166-8, 2006.
Odekunle, T. O., Balogun, E. E., and Ogunkoya, O. O.: On the pre-diction of rainfall onset and retreat dates in Nigeria, Theor. Appl. Clim., 81, 101–112, doi:10.1007/s00704-004-0108-x, 2005.
Pang, Z. H., Kong, Y. L., Froehlich, K., Huang, T. M., Yuan, L. J., Li, Z. Q., and Wang, F. T.: Processes affecting isotopes in precipitation of an arid region, Tellus, 63B, 352–359, 2011. Petitcolin, F. and Vermote, E.: Land surface reflectance,
emissiv-ity and temperature from MODIS middle and thermal infrared data, Remote Sens. Environ., 83, 112–134, doi:10.1016/S0034-4257(02)00094-9, 2002.
Pilgrim, D. H., Chapman, T. G., and Doran, D. G.: Problems of rainfall-runoff modeling in arid and semiarid regions, Hydrolog. Sci. J., 33, 379–400, doi:10.1080/02626668809491261, 1988. Reuter, H. I., Nelson, A., and Jarvis, A.: An evaluation of
void-filling interpolation methods for SRTM data, Int. J. Geogr. Inf. Sci., 21, 983–1008, 2007.
Roe, G. H.: Orographic precipitation, Ann. Rev. Earth Planet. Sc., 33, 645–671, 2005.
Seeman, S. W., Borbas, E. E., Li, J., Menzel, W. P., and Gumley, L. E.: MODIS atmospheric profile retrieval, algorithm theoriti-cal basis document, ver. 6, Reference Number ATBD-MOD07, Cooperative Institute for Meteorological Satellite Studies, Madi-son, WI, available at: http://modis.gsfc.nasa.gov/data/atbd/atbd_ mod07.pdf (last access: 26 July 2015), 2006.
Shiklomanov, I. A.: World water resources: A new appraisal and assessment for the 21st Century, UNESCO, avail-able at: http://www.ce.utexas.edu/prof/mckinney/ce385d/Papers/ Shiklomanov.pdf (last access: 26 July 2015), 1998.
Sugihara, G., May, R., Ye, H., Hsieh, C. H., Deyle, E., Fogarty, M., and Munch, S.: Detecting causality in complex ecosystems, Science, 338, 496–500, 2012.
van der Ent, R. J., Savenjie, H. H. G., Schaefli, B., and Steele-Dunne, S. C.: Origin and fate of atmospheric mois-ture over continents, Water Resour. Res., 46, W09525, doi:10.1029/2010WR009127, 2010.
Wan, Z., Zhang, Y., Zhang, Q., and Li, Z. L.: Qual-ity assessment and validation of the MODIS global land surface temperature, Int. J. Remote Sens., 25, 261–274, doi:10.1080/0143116031000116417, 2004.
Wang, J. S., Feng, J. Y., Yang, L. F., Guo, J. Y., and Pu, Z. X.: Runoff-denoted drought index and its relationship to the yields of spring wheat in the arid area of Hexi Cor-ridor, Northwest China, Agr. Water Manage., 96, 666–676, doi:10.1016/j.agwat.2008.10.008, 2009.
Wang, X. and Zhao, C.: Analysis of temporal trends in poten-tial evapotranspiration over Heihe River basin. Presented at the 2011 International Symposium on Water Resource and En-vironmental Protection (ISWREP), Xi’an, 20–22 May 2011, doi:10.1109/iswrep.2011.5893130, 2011.
Warner, T. T.: Desert Meteorology. Cambridge University Press, Cambridge, NY, 595 pp., 2004.
Wen, X. H., Lu, S. H., and Jin, J. M.: Integrating remote sensing data with WRF for improved simulations of oasis effects on local weather processes over an arid region in northwestern China, J. Hydrometeorol., 13, 573–587, 2012.
Wonderen, J. V., Moore, D., Wardlaw, R., Zhongjing, W., Litang, H., and Qingling, S.: Water resources and modelling in the Shiyang River Basin, Presented at the BHS Third International Symposium, Managing Consequences of a Changing Global En-vironment, Newcastle, 2010.
un-der natural conditions in inland river basins in Northwest China, Hydrol. Earth Syst. Sci., 16, 2859–2870, doi:10.5194/hess-16-2859-2012, 2012.
Zhang, B. Z., Kang, S. Z., Li, F., and Zhang, L.: Comparison of three evapotranspiration models to Bowen ratio energy balance method for a vineyard in an arid desert region of northwest China, Agr. Forest Meteorol., 148, 1629–1640, 2008.
Zhang, C. J., Bourque, C. P.-A., Sun, L. D., and Hassan, Q. K.: Spatiotemporal modeling of monthly precipitation in the upper Shiyang River watershed in west central Gansu, northwest China, Adv. Atmos. Sci., 27, 185–194, 2010.
Zhao, C., Nan, Z., and Cheng, G.: Methods for estimating irrigation needs of spring wheat in the middle Heihe Basin, China, Agr. Water Manage., 75, 54–70, doi:10.1016/j.agwat.2004.12.003, 2005.
Zhu, Y. H., Wu, Y. Q., and Drake, S.: A survey: obstacles and strate-gies for the development of ground-water resources in arid inland river basins of Western China, J. Arid Environ., 59, 351–367, doi:10.1016/j.jaridenv.2003.12.006, 2004.
Zhuang, G. S., Hourigan, J. K., Koch, P. L., Ritts, B. D., and Kent-Corson, M. L.: Isotopic constraints on intensified aridity in Cen-tral Asia around 12 Ma, Earth Planet. Sc. Lett., 312, 152–163, 2011.