© Author(s) 2012. CC Attribution 3.0 License.
Sciences
Tracing the spatial propagation of river inlet water into an
agricultural polder area using anthropogenic gadolinium
J. Rozemeijer1, C. Siderius2, M. Verheul1, and H. Pomarius3
1Deltares, Subsurface and Groundwater department, Utrecht, The Netherlands 2Alterra, Wageningen University and Research Centre, Wageningen, The Netherlands 3Water Board Rivierenland, Tiel, The Netherlands
Correspondence to:J. Rozemeijer ([email protected])
Received: 20 December 2011 – Published in Hydrol. Earth Syst. Sci. Discuss.: 30 January 2012 Revised: 22 June 2012 – Accepted: 28 June 2012 – Published: 2 August 2012
Abstract.Diverting river water into agricultural areas or na-ture reserves is a frequently applied management strategy to prevent fresh water shortage. However, the river water might have negative consequences for chemical and ecological wa-ter quality in the receiving wawa-ter bodies. This study aimed to obtain a spatial image of the diverted river water propagation into a hydrologically complex polder area, the polder Quar-les van Ufford in The Netherlands. We used anthropogenic gadolinium (Gd-anomaly) as a tracer for river water that was diverted into the polder. A clear reduction in the river water contribution was found between very dry conditions on 5 Au-gust 2010 and very wet conditions on 22 October. Despite the large river water impact on 5 August, the diverted river wa-ter did not propagate up into the small agricultural headwawa-ter ditches. Gadolinium proved to be an effective tracer for di-verted river water in a polder system. We applied our results to upgrade the interpretation of water quality monitoring data and to validate an integrated nutrient transport model.
1 Introduction
Local governments invest heavily in the identification and mitigation of water quality problems. In many agricultural ar-eas and nature reserves worldwide, the inlet of diverted river water influences the chemical and ecological water quality of the receiving water bodies. Agricultural areas often depend on river water inlet for irrigation and groundwater recharge (e.g. FAO, 2003). In wetland nature reserves, the introduc-tion of diverted river water is an increasingly applied man-agement tool to compensate for water shortage in summer or
to counteract salinization (e.g. Roelofs, 1991; Runhaar et al., 1996; Delaune et al., 2005). In the Netherlands, for exam-ple, water inlet from the Meuse and Rhine rivers influences more than 60 % of the surface water system in dry periods (Roelofs, 1991).
In both agricultural areas and nature reserves, the inlet of river water might have major negative consequences for wa-ter quality. In some arid areas, the available river discharge largely consists of untreated urban sewage effluent (Ryan et al., 2006; Srinivasan and Reddy, 2009). Using this water for irrigation obviously brings risks for human health through infection by pathogens and through accumulation of heavy metals in the food chain. In more temperate climates, pol-lutant concentrations in river discharge may also increase in dry periods due to less dilution of industrial spills and (par-tially treated or untreated) sewage effluent. Van Vliet and Zwolsman (2008) reported a general deterioration of the wa-ter quality of the Meuse river (France, Belgium, The Nether-lands) during droughts with respect to many elements includ-ing nutrients and heavy metals.
Diverted river water often causes direct or indirect eu-trophication in the receiving surface waters. In the coastal wetlands of Louisiana (US), for example, water inlet from the Mississippi is used to counteract the increasing salt-water intrusion due to ongoing land subsidence (Delaune et al., 2005). Miao et al. (2011) reported the possible negative con-sequences of introducing nitrogen-rich Mississippi water into an N-limited wetland ecosystem. The inlet of alkaline (HCO3
and SO4-rich) river water may also enhance the release of
“internal eutrophication” process caused the disappearance of Stratiotes aloides L. (Water soldier) from a mire complex in The Netherlands. Runhaar et al. (1996) gave several other examples of negative ecological consequences of water inlet into nature reserves.
Considering the possible negative consequences of river water inlet, information on the spatial propagation of the di-verted river water is important for water quality and nature reserve management. The impact of diverted river water rel-ative to other sources of water and contaminants is often assessed through water and mass balance studies (e.g. Van den Eertwegh et al., 2006; Kieckbusch and Schrautzer, 2007; Antonopoulos, 2008). However, this approach deals with the watershed as one “black box” reservoir and does not pro-vide any insight into the spatial propagation of the diverted river water within the reservoir. Whether the diverted river water remains within the main channels or whether it also penetrates into the smaller ditches remains unknown. This information could be obtained from more detailed water and mass balances or from process-based hydrological water and solute transport modeling. These models, however, are typ-ically calibrated towards an optimal representation of water levels or fluxes at specific monitoring locations (Gallart et al., 2007). Their performance in reproducing correct spatial pat-terns of diverted river water proportions is not known, due to the absence of appropriate measurements for calibration and validation.
The objectives of this study were (1) to obtain a spatial image of the contribution of diverted river water to the water composition in the channels and ditches of a hydrologically complex polder system and (2) to apply this information for the interpretation of chemical water quality monitoring data and for the evaluation of an integrated water and solute trans-port model. We introduce gadolinium as an effective tracer for the detection of areas affected by river water. This first time application of gadolinium for this purpose was a part of an extensive monitoring and modeling study of the agri-cultural polder Quarles van Ufford in The Netherlands. In addition to the monthly and weekly nutrient concentration measurements, we sampled 22 monitoring locations twice for analysis of gadolinium and other Rare Earth Elements (REE). One sampling run was conducted after a dry period in summer on 5 August 2010 and the second run took place after a wet period in autumn on 22 October 2010. Through these measurements, we successfully measured the impact of diverted river water at the sampled locations during distinct hydrological conditions. These results enabled us to improve our interpretation of the water quality monitoring data and to evaluate the spatial performance of our water and solute transport model.
2 Methods 2.1 Study area
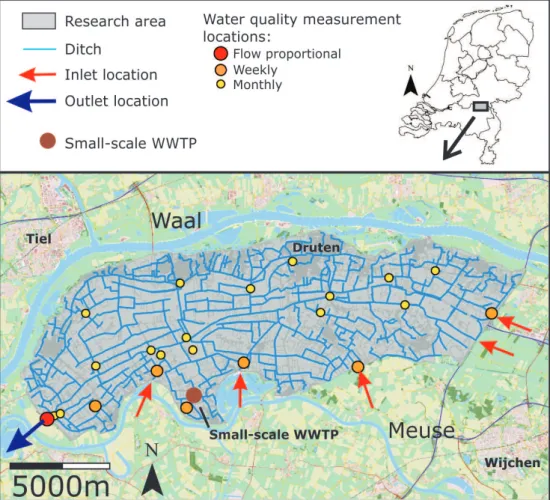
This study focuses on the 120 km2polder area Quarles van Ufford in The Netherlands (Fig. 1) (51◦50′N, 5◦35′E). An extensive description of the study site was given in Soppe et al. (2005). The polder is located between the rivers Meuse (south) and the main Rhine branch called Waal (north). Sur-face elevations in the relatively flat area range from 3 to 7 m above sea level from west to east. About 80 % of the area is in agricultural land use, of which 71 % is grassland, 15 % is maize, 7 % is fruit orchard, and 7 % is arable land with other crops. 16 % of the total area is urban and some small patches of forest cover 4 % of the polder. The shallow subsurface mainly consists of Holocene fluvial flood basin deposits (clay and silt) with an average thickness of 3–6 m. Locally, sandy channel bed deposits and inland aeolian dune sand reach the surface. The deeper subsurface consists of Pleistocene fluvial and aeolian deposits (sand and gravel).
The polder Quarles van Ufford has a semi-humid sea cli-mate with an average yearly precipitation of 800 mm and an average yearly estimated evaporation of 550 mm, resulting in an average estimated yearly recharge of 250 mm. The surface water system consists of a dense artificial network of chan-nels and ditches with a total length of 850 km (Fig. 1). The spacing between the ditches averages 200 m. Inlet of water is possible through five human controlled inlet locations, as in-dicated in Fig. 1. The two western inlets directly divert water from the river Meuse into the polder. The other inlets in the east bring water from the neighboring polder Bloemers. This water is a mixture of diverted river water from the Meuse and local agricultural and urban drainage water from polder Bloemers. There are no inlet structures that make it possible to divert river water from the Waal into the polder.
Excess water from Quarles van Ufford drains towards the river Meuse at one outlet location at the western side of the polder (Fig. 1). The overall surface water flow direction is from east to west. Locally, the flow directions are complex and only marginally known. The local flow directions depend on the precedent weather conditions, weir crest levels, and on the intermittent influence of several small-scale pumping stations. During wet conditions, the flow is directed from the smaller headwaters towards the main channels. During dry periods opposite flow directions may occur, as diverted river water is distributed through main channels and possibly pen-etrates into the smaller headwater ditches.
Fig. 1.Study area Quarles van Ufford with the inlet locations and the outlet, the main ditches, a small-scale waste water treatment plant (WWTP), and the water quality monitoring locations.
2.2 Research activities
The study area, Quarles van Ufford, is one of four pilot catch-ments in the research project Catchment Monitoring. This project aims to monitor the impact of the Dutch manure leg-islation on the nutrient concentrations at the catchment-scale (Woestenburg and Van Tol-Leenders, 2011). Nutrient sources and pathways in the pilot catchments were studied by com-bining detailed water quality monitoring with process-based models of catchment-scale nutrient transport.
In Quarles van Ufford, 22 water quality monitoring loca-tions were sampled from 2003–2010 (Fig. 1). The monitor-ing network was designed to provide a good spatial cover-age over the polder and to include main channels, smaller ditches, the inlet locations, and the catchment outlet. 15 lo-cations were sampled monthly and 6 lolo-cations were sampled weekly. A continuous flow proportional sampler was situated at the catchment outlet. The samples were, among other pa-rameters, analyzed forPtot,Ntot, NO−3-N, SO
−2
4 , pH, and EC.
The integrated water and nutrient transport model consists of four coupled submodels for water flow in the subsurface (SWAP, Kroes et al., 2008), nutrient transport in the
subsur-face (ANIMO, Groenendijk et al., 2005), water flow in the surface water system (SWQN, Smit et al., 2009), and nutrient transport in the surface water system (NUSWAlite, Siderius et al., 2009). Supplement 1 gives a more detailed description of our integrated water and nutrient transport model.
Precipitation data for this research were derived from a nearby precipitation measurement station of the Royal Dutch Meteorological Institute (KNMI) in Megen. For estimating evapotranspiration, the Makkink relation (Makkink, 1957) was applied using temperature and net incoming radiation data from the main KNMI weather station in De Bilt.
2.3 Tracer method: gadolinium
(Gd-DTPA) as a contrast agent in magnetic resonance imag-ing (MRI) in hospitals. Patients are injected with the Gd com-plex prior to their MRI-scan. After the research, the comcom-plex is excreted and transported conservatively through sewage systems and WWTPs towards the surface water system. As a consequence, rivers and other surface water bodies down-stream of populated areas generally show REE patterns with positive Gd anomalies (M¨oller et al., 2000). This study is the first to apply REE patterns and Gd anomalies to trace the propagation of diverted river water into a polder area.
To quantify the Gd-anomaly, it is common practice to first normalize the measured REE concentrations against the av-erage natural REE composition of the earth’s upper crust (e.g. Rabiet et al., 2009). Here, we used the REE compo-sition of the North American Shale Composite (NASC, Han-nigan and Sholkovitz, 2001) as a reference standard. The Gd-anomaly is calculated from the shale-normalized concen-trations of Gd and its neighboring REE elements Samarium (Sm) and Terbium (Tb):
Gdano=
GdN
(0.33·SmN+0.67·TbN)
(1) where GdN is the shale-normalized Gd concentration, SmN is the shale-normalized Sm concentration, and TbN is the shale-normalized Tb concentration (e.g. Petelet-Giraud et al., 2009). Gd-anomalies larger than 1 suggest elevated Gd con-centrations relative to the other REE elements. Rabiet et al. (2009) considered Gd-anomalies lower than 1.4 uncon-taminated by anthropogenic sources as Gd-anomalies up to 1.3 have been found in natural waters. In WWTP effluents, Gd-anomalies up to 1680 have been reported in literature (Bau and Dulski, 1996). In rivers, Gd-anomalies may vary in time and space and depend on the number of MRI patients and on the contribution of effluent from WWTPs to the to-tal discharge. For the German rivers Weser, Ems, and Elbe, Kulaksiz and Bau (2007) reported Gd anomalies around 5.
2.4 Sampling timing, locations, and procedures
We sampled the surface water monitoring locations for REE analysis on 5 August and 22 October 2010. These two sam-pling moments represented two extremes in the hydrological situation. On 5 August, hydrological conditions were very dry and we anticipated a relatively large impact of river wa-ter inlet on the local surface wawa-ter composition throughout the polder. The total precipitation deficit during the preceding two months was 118 mm (101 mm precipitation and 219 mm evapotranspiration). The volume of water inlet during these months was 5.3×10⁶m3(50 mm). On 22 October, in con-trast, hydrological conditions were very wet. We expected local drainage of excess rainfall water to dominate the lo-cal surface water composition and a much lower impact of diverted river water compared to 5 August. The total pre-cipitation excess during the two months before 22 October was 184 mm (275 mm precipitation and 91 mm
evapotran-spiration). Water inlet during these months was 2.7×10⁶m3 (25 mm).
Both on 5 August and 22 October 2010, surface water was sampled at 22 locations in the polder Quarles van Ufford. The locations were selected from the regular water quality sampling program. We included the five inlet locations, the catchment outlet, some main channels, and some small agri-cultural ditches. In addition, we selected a sampling loca-tion where we expected the minimum influence of diverted river water. This location was chosen in the first part of a ditch draining a slightly elevated field, situated on an old river sand dune.
The samples were taken using a peristaltic pump and fil-tered through 0.45 µm polyethersulfon filters. We collected the samples in pre-washed 100 ml HDPE bottles. The sam-ples were acidified with 1 % ultra pure HNO3 and stored
at 4◦C until analysis. The samples were analyzed using
an innovative ICP-MS setup (Inductively Coupled Plasma Mass Spectrometry, Thermo Fisher Scientific, X-series 2, Waltman, MA, USA). Very accurate measurements of low REE-concentrations (<0.001 ppb) were produced by cou-pling the ICP-MS with an MP2 micro-peripump, a FAST precision pump, and an APEX desolvation nebulizer (all El-emental Scientific, Omaha, NE, USA), which improved the ionization efficiency of the pre-dry particles. This setup en-abled accurate measurements (with a reproducibility limit of ca. 10 %) without the frequently applied labor-intensive pre-concentration procedure.
3 Results
3.1 Gd-anomalies
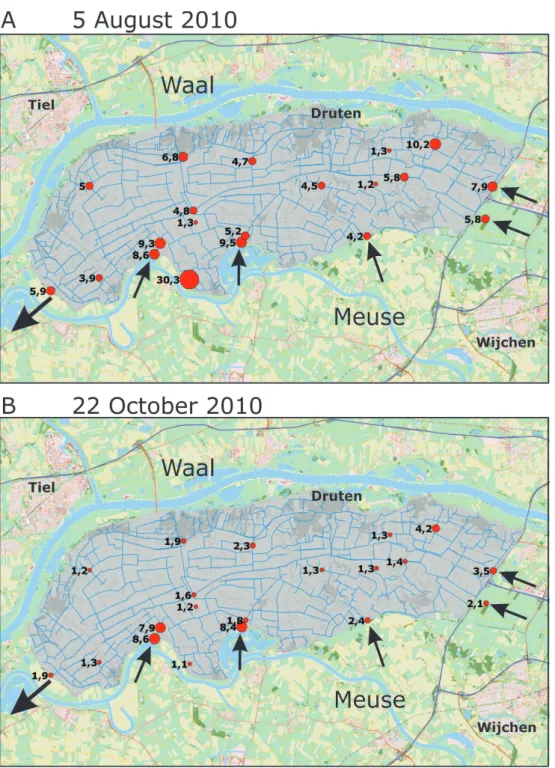
The Gd-anomalies calculated from the REE measurements of 5 August and 22 October 2010 are shown in Fig. 2. The full shale-normalized REE concentration patterns are given in Supplement 2. On 5 August, the Gd-anomalies of the di-verted Meuse water at the two direct inlet locations were 8.6 and 9.5 (Fig. 2a). The other inlets that bring water from the neighboring polder Bloemers showed lower Gd-anomalies of 4.2, 5.8, and 7.9. This water partly consists of diverted river water from the Meuse and partly of local agricultural and ur-ban drainage water. The relatively high Gd-anomaly of 7.9 is probably caused by the short and direct flow route from the Meuse water inlet of polder Bloemers towards this location. Less mixing with locally drained water occurred compared to the two other inlet locations from polder Bloemers.
Fig. 2.Measured Gd-anomalies on(a)5 August and(b)22 October 2010. The arrows indicate the inlets and the outlet.
indicate that no diverted river water penetrates up into these small ditches.
In most larger channels, Gd-anomalies on 5 August ranged between 3.9 and 6.8. These values indicate that this wa-ter consists of a mixture of diverted river wawa-ter and locally drained water. We found one very high Gd-anomaly of 30.3 in the south. This location is in a small ditch near the small-scale WWTP that discharges its effluent into the local
Table 1.Results of the non-parametric Kolmogorov-Smirnov tests on the difference between the solute concentrations in local drainage and diverted river water.
Difference M50 local M50 diverted KS-test significant drainage river water statistic p (p <0.05)?
Ptot 0.26 mg l−1 0.10 mg l−1 0.61 <2.2e-16 yes
Ntot 1.8 mg l−1 3.1 mg l−1 0.32 1.5e-9 yes
NO3 0.025 mg l−1 2.3 mg l−1 0.62 <2.2e-16 yes SO4 35 mg l−1 53 mg l−1 0.55 4.3e-4 yes
pH 7.4 7.9 0.62 <2.2e-16 yes
EC 72 mS m−1 55 mS m−1 0.65 <2.2e-16 yes
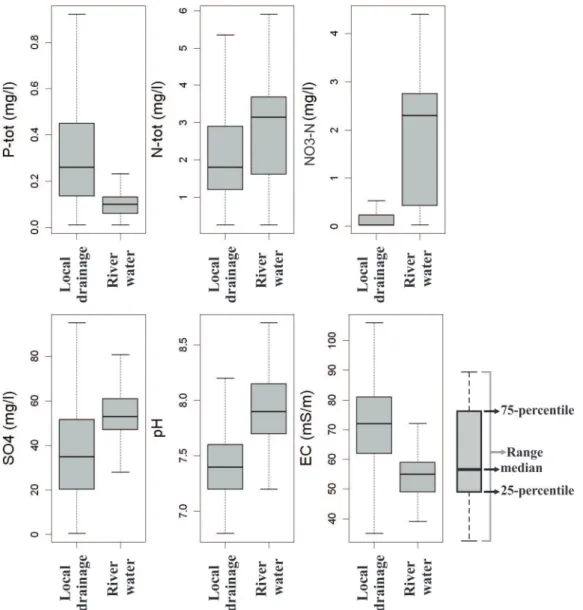
Fig. 3.Boxplots summarizing the 2003–2010 water quality monitoring data. The left-side boxplots represent the low Gd-anomaly
explanation of this high value is the influence of a nearby sewer overflow.
On 22 October, the Gd-anomalies for the two direct Meuse water inlet locations of 8.6 and 8.4 were similar to those measured on 5 August. However, the Gd-anomalies of the inlet locations from polder Bloemers were lower on 22 Oc-tober (2.4, 2.1, and 3.5). In addition, all other monitoring lo-cations within Quarles van Ufford also showed much lower Gd-anomalies compared to 5 August. These results indicate a decrease in the proportion of diverted Meuse water in the polder and a larger influence of locally drained water.
At the monitoring location near the WWTP, the Gd-anomaly decreased from 30.3 on 5 August to 1.1 on 22 Oc-tober. Possibly, the effluent of the WWTP does not spread out through the sub-catchment during wet conditions and therefore does not influence the water quality at this lo-cation on 22 October. Another possible explanation is that no MRI-patients have contributed Gd to this small-scale sewage WWTP at the time of the second measurement round. The Gd-anomaly at the location in the northeast decreased from 10.2 on 5 August to 4.2 on 22 October. Still, the rel-atively high value relative to the other locations indicates that the unknown local source of Gd is also active during wet conditions.
3.2 Surface water quality measurements
The consequence of the spatial propagation of diverted river water within the polder depends on the difference between the composition of the diverted river water and the position of the locally drained water. Therefore, we com-pared the water quality data from the 2003–2010 regular monitoring program of the locations that were most affected by diverted river water with the locations that were not or only marginally affected. In Fig. 3, the left-side boxplots summarize the measured concentrations at the two moni-toring locations with the lowest Gd-anomalies (≤1.3). The right-side boxplots give the results for the three locations near the direct inlets with Gd-anomalies ranging from 7.9 to 9.5. Table 1 gives the results of a non-parametric test (Kolmogorov-Smirnov) on the difference in solute concen-trations between the diverted river water locations and the local drainage locations.
Figure 3 shows clear differences in water composition be-tween the locations that were most affected by diverted river water and those that represent locally drained water. Table 1 shows that all these differences are statistically significant. The locally drained water of Quarles van Ufford is charac-terized by a significantly higherPtot concentration and EC,
a significantly lower pH, and significantly lower concentra-tionsNtot, NO3-N, and SO4(Fig. 3 and Table 1).
Ptotconcentrations were significantly higher in the locally
drained water dominated locations. The concentrations at the diverted river water dominated locations are around the max-imum allowable concentration (MAC) value of 0.15 mg l−1.
In the local drainage dominated locations, this MAC-value is generally exceeded and concentrations up to 0.9 mg l−1were
measured. The high concentrations in the locally drained wa-ter are caused by the leaching of phosphorus from the agri-cultural fields (Siderius et al., 2011).
The concentrations ofNtotwere significantly higher at the
diverted river water dominated locations. The MAC-value of 2.8 mg l−1is exceeded in more than 50 % of the diverted river water samples. The higherNtotconcentrations in the diverted
river water dominated locations can mainly be attributed to the higher NO3-N concentrations (Fig. 3). The low NO3-N
concentrations in locally drained water are probably caused by denitrification and uptake of NO3-N in biomass (Siderius
et al., 2011).
The significantly higher EC in the local drainage domi-nated locations can be attributed to the leaching of salts from manure and fertilizer from the agricultural fields. The SO4
concentrations and pH-values were significantly higher in the diverted river water dominated locations. The diverted river water from the Meuse is more alkaline than the local drainage water, which is more directly influenced by precipi-tation water. The inlet of this alkaline Meuse river water may enhance the release of phosphorus from sediments (Smolders et al., 2006).
In general, the direct inlet of Meuse water leads to higher
Ntotconcentrations and lowerPtotconcentrations in the sur-face waters of Quarles van Ufford. The direct inlet of Meuse water may therefore enhance N-limited algal growth, but at the same time reduce P-limited algal growth. The reduction of Ptot may, however, be counterbalanced by the enhanced release of phosphorus from sediments, caused by the higher alkalinity of the Meuse diverted river water. The nutrient con-centrations in Quarles van Ufford can be influenced by in-creasing the inlet from the neighboring polder Bloemers and reducing the direct inlet of Meuse water via the two western inlet locations (see Fig. 1). This measure would increasePtot
concentrations and reduceNtotconcentrations in the Quarles
van Ufford surface water system (Siderius et al., 2011).
3.3 Modeled proportions of diverted river water
Fig. 4.Modeled proportions of diverted river water in the main ditches and channels on 5 August and 22 October 2010.
small-scale pumping station or an incorrect weir crest level. In the slightly elevated northern part, ditches not reached by diverted river water sometimes run dry in summer. However, the extent of this seems to be overestimated by the model. An incomplete parameterization of the manual control of small-scale pumping stations and weir crest levels under dry con-ditions are likely to be the cause.
The model results for 22 October show much lower di-verted river water proportions. During very wet conditions, the large amounts of locally drained water control the chemi-cal composition of most channels. Near the active inlet
loca-tions, some channels still have a large proportion of diverted river water on 22 October.
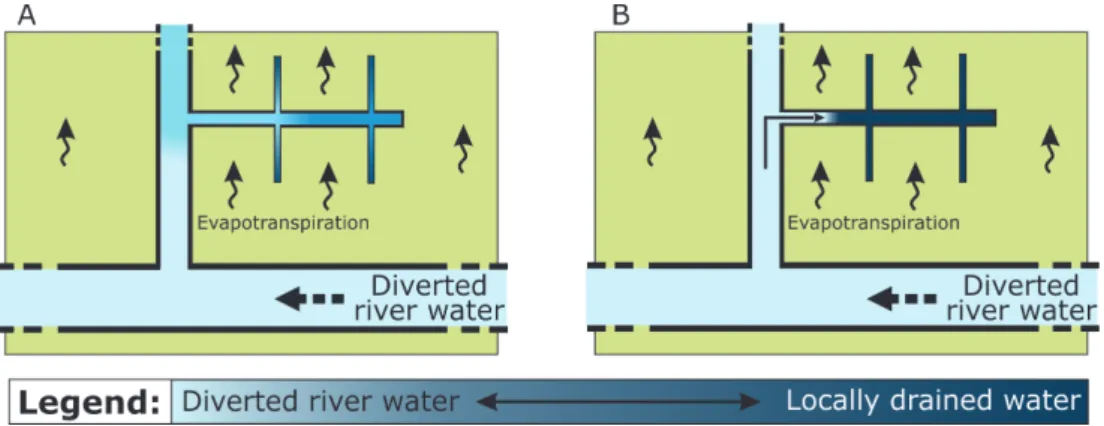
Fig. 5.Visualization of the two conceptual models of the spatial propagation of diverted river water into a polder system. The results of this study indicate that the diverted river water did not propagate up into the small headwater ditches as was expected(A). Instead, the local drainage water is pushed back into the headwater ditches by the diverted river water(B).
4 Discussion and conclusions
In this study, we obtained a spatial image of the propagation of diverted river water into a hydrologically complex polder system during dry and wet conditions. We applied this infor-mation for the interpretation of chemical water quality mon-itoring data and for the evaluation of an integrated water and solute transport model.
The spatial image of diverted river water propagation was based on gadolinium-anomalies that were measured dur-ing very dry conditions (August 2010) and very wet con-ditions (November 2010). Sampling during hydrologically distinct conditions has also been carried out in several free-flowing catchments by Rabiet et al. (2009), Petelet-Giraud et al. (2009), and Lawrence and Bariel (2010). Similar to our results, these studies report low variability in the Gd-anomalies of surface waters unaffected by wastewater. For example, Petelet-Giraud et al. (2009) reported Gd-anomalies of 1.24±0.05 in 20 samples taken during June 2005 to July 2006 from the Run-catchment. Larger temporal vari-ability in Gd-anomalies is reported for surface waters that are affected by wastewater. In this study, we reported a de-crease in the Gd-anomalies from dry conditions in August to wet conditions in November. Although less distinct, a similar difference was reported by Rabiet et al. (2009) for the lower part of the H´erault catchment. Rabiet et al. (2009) attributed this seasonal change to the lower river flows in summer and the larger relative contribution of wastewater effluent. The highest Gd-anomalies and the highest short-scale variability in Gd-anomalies were found in WWTP effluents (Bau and Dulski, 1996; Lawrence and Bariel, 2010). The diverted river water Gd-anomalies in Quarles van Ufford did not change significantly between August and November 2010. Probably, most of the short-scale variability is lost due to the mixing of Gd-sources in the Meuse catchment.
Several previous studies reported on the adverse effects the inlet of diverted river water on surface water quality
The improved understanding of water and nutrient sources in Quarles van Ufford helps to identify appropriate water quality mitigation options. A reduction of Ntot
concentra-tions in the polder could be established by reducing the river water inlet volumes or by reducing the diverted river water
Ntot concentrations. A reduction of Ptot concentrations can
be obtained by reducing the leaching from the agricultural fields or by increasing the water inlet which enhances the flushing of the polder. A complicating aspect of changing the inlet volumes is that this may affect the residence time of wa-ter within the polder system. Stopping the wawa-ter inlet would lead to a dominance of locally drained water and to longer residence times, especially during dry periods. It is unclear whether the increased residence time will lead to a building up of even higher concentrations ofPtotand other agrochem-icals or that a longer residence time will increase the effect of biochemical processes that reduce the concentrations.
Gd proved to be an excellent tracer to study the spa-tial propagation of diverted river water into a hydrologically complex polder system. As suggested before by M¨oller et al. (2000), the occurrence of very stable Gd-DTPA complex in the effluent of WWTPs brings new opportunities for hy-drological research. The Gd-DTPA complex shows minimal chemical interaction with its surroundings under natural con-ditions and has a high residence time in the water system, which makes it a good tracer to study the mixing of water from different sources. Gd-anomalies can also be used as an indication for urban wastewater influence and the possible occurrence of pollutants and pathogens.
Supplementary material related to this article is
available online at: http://www.hydrol-earth-syst-sci.net/ 16/2405/2012/hess-16-2405-2012-supplement.zip.
Acknowledgements. The Dutch Ministry of Economic Affairs, Agriculture and Innovation and the Ministry of Ministry of Infras-tructure and the Environment are acknowledged for funding this research. The authors also acknowledge the field and laboratory workers of Water Board Rivierenland and Deltares who did an excellent job in collecting and analyzing all water quality samples. Three anonymous reviews and the review of G. A. P. H. Van den Eertwegh greatly improved the manuscript.
Edited by: S. Thompson
References
Antonopoulos, V. Z.: Modeling of water and nitrogen balance in the ponded water of rice fields, Paddy Water Environ., 6, 387–395, 2008.
Bau, M. and Dulski, P.: Anthropogenic origin of positive gadolin-ium anomalies in river waters, Earth Planet. Sci. Lett., 143, 245– 255, 1996.
DeLaune, R. D., Jugsujinda, A., West, J. L., Johnson, C. B., and Kongchum, M.: A screening of the capacity of Louisiana fresh-water wetlands to process nitrate in diverted Mississippi River water, Ecol. Eng., 25, 315–321, 2005.
Dierberg, F. E., Juston, J. J., DeBusk, T. A., Pietro, K., and Gu, B.: Relationship between hydraulic efficiency and phosphorus removal in a submerged aquatic vegetation-dominated treatment wetland, Ecol. Eng., 25, 9–23, 2005.
FAO: World Agriculture Towards 2015/2030: An FAO Perspective, FAO/Earthscan, Rome/London, 2003.
Gallart, F., Latron, J., Llorens, P., and Beven, K.: Using internal catchment information to reduce the uncertainty of discharge and baseflow predictions, Adv. Water Resour., 30, 808–823, 2007. Groenendijk, P., Renaud, L. V., and Roelsma, J.: Prediction of
Nitro-gen and Phosphorus leaching to groundwater and surface waters; Process descriptions of the animo4.0 model, Alterra-report 983. Alterra, Wageningen, The Netherlands, 2005.
Hannigan, R. E. and Sholkovitz, E. D.: The development of middle Rare Earth Element enrichments in freshwaters: weathering of phosphate minerals, Chem. Geol., 175, 495–508, 2001. Hendriks, R.: Effecten van aanvoer van gebiedsvreemd water op de
waterkwaliteit in een kwelgebied, Staring Centrum Report 100, Wageningen, The Netherlands, 1990 (in Dutch).
Kieckbusch, J. J. and Schrautzer, J.: Nitrogen and phosphorus dy-namics of a re-wetted shallow-flooded peatland, Sci. Total Envi-ron., 380, 3–12, 2007.
Kroes, J. G., Van Dam, J. C., Groenendijk, P. Hendriks, R. F. A., and Jacobs, C. M. J.: SWAP version 3.2, Theory description and user manual, Alterra-report 1649, Wageningen-UR, Alterra, Wa-geningen, The Netherlands, 2008.
Kulaksiz, S. and Bau, M.: Contrasting behavior of anthropogenic gadolinium and natural Rare Earth Elements in estuaries and the gadolinium input into the North Sea, Earth Planet Sci. Lett., 260, 361–371, 2007.
Lawrence, M. G. and Bariel, D. G.: Tracing treated wastewater in an inland catchment using anthropogenic gadolinium, Chemo-sphere, 80, 794–799, 2010.
Makkink, G. F.: Testing the Penman formula by means of lysime-ters, J. Inst. Wat. Engrs., 11, 277–288, 1957.
Miao, S., DeLaune, R. D., and Jugsujinda, A.: Significance of cou-pling of nitrification and nitrate reduction on water quality of a coastal lake that receives nitrate in diverted Mississippi River wa-ter, Aquat. Ecosyst. Health, 9, 351–356, 2011.
M¨oller, P., Dulski, P., Bau, M., Knappe, A., Pekdeger., A., and Sommer-von Jarmersted, C.: Anthropogenic gadolinium as a conservative tracer in hydrology, J. Geochem. Explor., 69-70, 409–414, 2000.
Paudel, R., Min, J. H., and Jawitz, J. W.: Management scenario evaluation for a large treatment wetland using a spatio-temporal phosphorus transport and cycling model, Ecol. Eng., 36, 1627– 1638, 2010.
Petelet-Giraud, E., Klaver, G., and Negrel, P.: Natural versus an-thropogenic sources in the surface- and groundwater dissolved load of the Dommel river (Meuse basin): Constraints by boron and strontium isotopes and gadolinium anomaly, J. Hydrol., 369, 336–349, 2009.
Roelofs, J. G. M.: Inlet of alkaline river water into peaty lowlands: effects on water quality and Stratiotesaloides L. Stands, Aquat. Bot., 39, 267–293, 1991.
Runhaar, J., Van Gool, C. R., and Groen, C. L. G.: Impact of hydro-logical changes on nature conservation areas in the Netherlands, Biol. Conserv., 76, 269–276, 1996.
Ryan, J., Masri, S., and Qadir, M.: Nutrient Monitoring of Sewage Water Irrigation: Impacts for Soil Quality and Crop Nutrition, Commun. Soil Sci. Plan., 37, 2513–2521, 2006.
Siderius, C., Groenendijk, P., Jeuken, M. H. J. L., and Smit, A. A. M. F. R.: Process description of NUSWALITE: a simplified model for the fate of nutrients in surface waters, Alterra-report 1226.2, Wageningen-UR, Alterra, Wageningen, The Nether-lands, 2009.
Siderius, C., Rozemeijer, J., Mulder, H. M., Smit, A. A. M. F. R., Van Tol-Leenders, T. P.: Nutri¨entenhuishouding in de bodem en het oppervlaktewater van Quarles van Ufford. Bronnen, routes en sturingsmogelijkheden, Alterra-report 2221, Wageningen-UR, Alterra, Wageningen, The Netherlands, 2011 (in Dutch). Smit, A. A. M. F. R., Siderius, C., and Van Gerven, L. P. A.:
Process description of SWQN: A simplified hydraulic model, Alterra-report 1226.1, Wageningen-UR, Alterra, Wageningen, The Netherlands, 2009.
der Velde, G., and Roelofs, J. G. M.: Internal eutrophication: How it works and what to do about it – a review, Chem. Ecol., 22, 93–111, 2006.
Soppe, R. W. O., Roelsma, J., Bergersen, E., and Van der Bolt, F. J. E.: Systeemverkenning Quarles van Ufford. Alterra report 970, Wageningen-UR, Alterra, Wageningen, The Netherlands, 2005 (in Dutch).
Srinivasan, J. T. and Ratna Reddy, V.: Impact of irrigation water quality on human health: A case study in India, Ecol. Econ., 68, 2800–2807, 2009.
Van den Eertwegh, G. A. P. H., Nieber, J. L., De Louw, P. G. B., Van Hardeveld, H. A., and Bakkum, R.: Impacts of drainage activities for clay soils on hydrology and solute loads to surface water, Irrig. Drain., 55, 235–245, 2006.
Van Vliet, M. T. H. and Zwolsman J. J. G.: Impact of summer droughts on the water quality of the Meuse river, J. Hydrol., 353, 1–17, 2008.