A Multiscale Approach Indicates a Severe
Reduction in Atlantic Forest Wetlands and
Highlights that S
ã
o Paulo Marsh Antwren Is
on the Brink of Extinction
Glaucia Del-Rio1,2¤a
*, Marco Antonio Rêgo2¤a, Luís Fábio Silveira2
1Departamento de Zoologia, Instituto de Biociências, Universidade de São Paulo, São Paulo, São Paulo,
Brazil,2Seção de Aves, Museu de Zoologia da Universidade de São Paulo, São Paulo, São Paulo, Brazil
¤a Current address: Museum of Natural Science, Louisiana State University, Baton Rouge, Louisiana,
United States of America *[email protected]
Abstract
Over the last 200 years the wetlands of the Upper Tietêand Upper Paraíba do Sul basins,
in the southeastern Atlantic Forest, Brazil, have been almost-completely transformed by ur-banization, agriculture and mining. Endemic to these river basins, the São Paulo Marsh
Antwren (Formicivora paludicola) survived these impacts, but remained unknown to
sci-ence until its discovery in 2005. Its population status was cause for immediate concern. In order to understand the factors imperiling the species, and provide guidelines for its conser-vation, we investigated both the species’distribution and the distribution of areas of suitable
habitat using a multiscale approach encompassing species distribution modeling, fieldwork surveys and occupancy models. Of six species distribution models methods used (General-ized Linear Models, General(General-ized Additive Models, Multivariate Adaptive Regression Splines, Classification Tree Analysis, Artificial Neural Networks and Random Forest), Ran-dom Forest showed the best fit and was utilized to guide field validation. After surveying 59 sites, our results indicated thatFormicivora paludicolaoccurred in only 13 sites, having
nar-row habitat specificity, and restricted habitat availability. Additionally, historic maps, distribu-tion models and satellite imagery showed that human occupadistribu-tion has resulted in a loss of more than 346 km2 of suitable habitat for this species since the early twentieth century, so that it now only occupies a severely fragmented area (area of occupancy) of 1.42 km2, and it should be considered Critically Endangered according to IUCN criteria. Furthermore, av-eraged occupancy models showed that marshes with lower cattail (Typha dominguensis)
densities have higher probabilities of being occupied. Thus, these areas should be priori-tized in future conservation efforts to protect the species, and to restore a portion of Atlantic Forest wetlands, in times of unprecedented regional water supply problems.
OPEN ACCESS
Citation:Del-Rio G, Rêgo MA, Silveira LF (2015) A Multiscale Approach Indicates a Severe Reduction in Atlantic Forest Wetlands and Highlights that São Paulo Marsh Antwren Is on the Brink of Extinction. PLoS ONE 10(3): e0121315. doi:10.1371/journal. pone.0121315
Academic Editor:Francisco Moreira, Institute of Agronomy, University of Lisbon, PORTUGAL
Received:August 11, 2014
Accepted:January 30, 2015
Published:March 23, 2015
Copyright:© 2015 Del-Rio et al. This is an open access article distributed under the terms of the
Creative Commons Attribution License, which permits unrestricted use, distribution, and reproduction in any medium, provided the original author and source are credited.
Data Availability Statement:All relevant data are within the paper and its Supporting Information files.
Introduction
Wetlands have always attracted humans, especially for occupation, due principally to their fertile soils and high productivity, with many of the great historic civilizations having arisen in and near river floodplains [1]. They are one of the most productive habitats on Earth, supporting many kinds of life [1]. Their food web is composed largely of invertebrates that feed on decaying plants, with vertebrates such as fish, reptiles, mammals and birds occupying the highest trophic levels [1].
Within the São Paulo metropolitan region, rivers and wetlands used to comprise a substan-tial portion of the landscape [2]. Reports and historic maps show that within the city limits alone, there were once more than 80 km of wetlands extending along the Tietê, Pinheiros and Tamanduateí Rivers [2]. According to Jorge [2], these areas used to shelter brocket deer, otters, rails and many types of fish. Today, this region has one of the highest human concentrations in the world, with almost 20 million people [3]. Development has generally been disorderly, and its environmental impacts are numerous [2]. These wetlands are part of a mosaic of different landscape formations with distinct ecological borders that together form the Atlantic Forest domain: a principal biodiversity hotspot, and one of the most endangered domains in the world [4], [5]. This is the result of a history of intense exploitation involving wood extraction, mining, agriculture, industrialization and urbanization [6], [7], [8], [9]. However, of all the for-mations, wetlands are one of the most neglected and least studied and their biodiversity is now in great danger [2].
The São Paulo Marsh Antwren (Formicivora paludicola) (Thamnophilidae) [10] is an exam-ple of this. It is a passerine endemic to the wetlands of the São Paulo state, yet it remained un-known to science until its discovery in the early twenty-first century. It is the only bird species and one of the few vertebrates endemic to this region [11].Formicivora paludicolaoccurs ex-clusively in wetlands, especially those dominated by cattail (Typha dominguensis). Thamnophi-lids are not attractive for hunting or for pet trade, and the main threat facingF.paludicolais habitat destruction [12].
Today, the species only occurs in marshes in the Upper Tietê and Upper Paraíba do Sul ba-sins. The localities are few and sparsely distributed. In general, natural areas in this region are few and disconnected. For wetlands, the situation is even worse, considering their delicate dy-namics and neglect by authorities and lay population. Nevertheless, there are still some wet-lands that have not yet been urbanized although they all are encircled by pastures, mining, plantations and industrial activities [2], [13]. The conservation status ofF.paludicolais there-fore of concern. However, due to its recent discovery almost every aspect of its natural history has not been studied, including its distribution [14].
Predicting a species’distribution plays a significant component in planning conservation ef-forts, and has other important applications in ecology [15], [16], [17], [18], [19], [20], [21]. The main objective is to convert point information of a species’distribution into predictive maps, using climatic, topographic, and edaphic data [22]. For species with records from only a few lo-calities, Species Distribution Models (SDMs) may be useful for providing a description of areas climatically similar to the ones in which the species is known to occur, helping to improve field surveys [23], [24]. Furthermore, ecologists recognize the necessity of focusing conservation ef-forts on species with higher risks of population decline, and have worked to identify priority groups, habitats, and areas that are in greatest need of conservation [25], [26], [27]. Such prior-itization should be based on environmental features that benefit the maintenance of biodiversi-ty. Occupancy models can then be used with the intent of relating species presence/absence to the characteristics of the sampling locations [28].
Integrating distribution models (i.e. species-climate envelope models), field surveys and oc-cupancy models, we applied a novel multiscale approach, that could be applied for threatened Competing Interests:The authors have declared
species worldwide, to assess the threat profile for a species and of its environment. With a com-pilation of systematized information for this species, its habitat requirements, and the status of São Paulo’s wetlands, we define the prioritization strategies for conservation activities in these Atlantic Forest Wetlands.
Methods
Distribution Models
In order to find climatic suitable areas for the species along its biome, we generated distribution models and predictive maps using all 15 known localities (15 marshes) ofF.paludicola
(S1 Table). Climate and altitude data for each location were extracted from the WorldClim database (Tile 34—encompassing most of Atlantic Forest latitudes) [29] at a resolution of 30 arc-seconds (approximately 1 km). For eliminating spatially correlated variables (from all 19 climate variables from WorldClim database) prior to the modeling process, we used the“ Cor-relation”tool in ENM Tools 1.3 software [30]. We analyzed the Pearson correlation coefficient for every pair-wise comparison of raster files, and retained the five least correlated climate variables (Pearson’s<0.7). The variables used were: isothermality (mean diurnal range/
temperature annual range), temperature seasonality, temperature annual range, precipitation of driest month and precipitation seasonality. We also used two variables related to hydrology: height above the nearest drainage channel [31] and drainage channel density (obtained through SRTM: Shuttle Radar Topographic Mission images from the HydroSHEDS project [32], with a resolution of 1 km [33]). Both these were obtained from the Ambdata INPE [34].
Using the BIOMOD [35] framework for the R programming environment [36], we applied six methods to detect the model with the highest accuracy: Generalized Linear Models (GLMs) [37], Generalized Additive Models (GAMs) [38], Multivariate Adaptive Regression Splines (MARS) [39], Classification Tree Analysis (CTA) [40], Artificial Neural Networks (ANN) [41] and Random Forest (RF) [42]. These methods are at the forefront of species distribution modeling [22], [43], [44], [45] and some of them have been shown to be very accurate in stud-ies which dealt with specstud-ies with localized distribution [46], [47]. For further information on the procedures used to run each model see: Thuiller [35] (GLM, GAM, CTA, ANN), Muñoz and Felicísimo [48] (MARS), Breiman and Cutler [49] (RF),S2 TableandS1 Appendix. We chose the number of Pseudo-Absences and the method of Pseudo-Absences selection following guidelines proposed by Barbet-Massin et al. [50]: 10,000 Pseudo-Absences in GLM, GAM, MARS and ANN; and 15 (the same number as presences) in CTA and RF.
The original models were reclassified into binary models of presence/absence using a threshold approach. Because only presence data were available we used a method that maxi-mizes sensitivity and specificity to calculate the threshold levels [51]. Model predictive perfor-mance was evaluated using true skills statistic (TSS) [52], area under the curve (AUC) of receiver operating characteristic (ROC) [53], and Cohen’s kappa statistic [54]. TSS ranges from-1 to +1, where +1 indicates perfect agreement and values of zero or less indicate a perfor-mance no better than random [52]. Regarding AUC, values>0.8 indicate high model accuracy
[55]. Kappa values range from-1 to +1, where values near +1 indicate high performance [54]. We used the best model to generate the predictive map which guided our field surveys.
Validation
performed a false color classification (6, 5, 4—RGB). To obtain a spatial resolution of 15 m, we applied a fusion technique with the panchromatic band (band 8).
We selected 57 areas in 32 different municipalities in São Paulo State and two in Rio de Ja-neiro State (S3 Table). We visited these areas at least twice over the two years from October 2011 to October 2013. Knowing the territorial behavior of the species, we used three playback sessions at each visit to increase its detection probability. Each session included one minute of playback (loudsong and calls of males and females) separated by five minutes of silence (proto-col modified from Bos(proto-colo et al. [57]).
Distribution Range Size
In order to investigate the conservation status of the species, we calculated its extent of occur-rence (EOO) using the minimum convex polygon (MCP) approach [58]. We calculated the suitable area predicted by the SDM within the MCP (Environmental Suitability in Extent of Occurrence ES-EOO) [24]. Additionally, we measured the area of occupancy (AOO) by count-ing the number of occupied cells in a grid of 330 m X 330 m covercount-ing the entire distribution Fig 1. Species Distribution Model results and surveyed areas.Green areas represent Random Forest projections of areas climatically suitable for São
Paulo Marsh Antwren (Formicivora paludicola). Grey shading represents urban areas. Circles represent areas known to possessF.paludicolathat were used in occupancy models. Triangles represent areas visited for the distribution model validation where the species is absent. Diamonds represent areas visited three times for occupancy models surveys where the species is absent. Stars represent new areas discovered to possessF.paludicolathat were used in the occupancy models. Crosses represent areas where the species could be extinct. Some validation localities are not shown on the map.
(according to the average areas occupied size—0.11 km2), and estimating the total area of occu-pied cells [58].
Occupancy Models
Occupancy models allow inference about the distribution of organisms over space, using tem-poral and spatial replication to produce estimates of occupancy and detection probabilities, and their related parameters [59]. We used these models to investigate the manner in which the probability of occupancy ofF.paludicolavaries with the characteristics of the sites. In a more detailed scale than species distribution models, occupancy models were built focused on marshes, to find suitable conditions for the local occurrence of the species, thus testing the ef-fect of several environmental covariates on the occupancy probabilities of the São Paulo Marsh Antwren. To create the occupancy models we used a total of 47 areas. Of the 15 localities where F.paludicolawas known to occur (used in the SDM), we included only nine as five wetlands no longer existed due to human activities and one was under direct influence of mining activities (Fig. 1). To these we added a further 38 marshes that fell within the MCP of the São Paulo Marsh Antwren distribution with a buffer of 30 km [60] that had previously been used in the SDM validation. We systematically visited each area three times, with an interval of~15 days between visits from August to September 2013. We alternated the time of the visits (from 6h A.M. to 11h A.M.), and performed the playback routine described above on every visit. When at least one individual was detected on the first visit, we made positive detections on the next two visits to the same site. Therefore, we considered the detection probability to be constant among visits.
The selected variables were wetland size (m2), presence of native forest matrix adjacent to the marshes, presence of commercial plantations (such asEucalyptus), presence of mining ac-tivities, distance to main highways and roads, distance to urban areas, distance to rivers, and water flow (maximum, average and minimum). We created vectors delimiting the marshes, urban areas and paved roads based on a visual classification of BirdsEye Satellite Imagery in Base Camp, obtaining patch size and minimum distance from the centre of the marshes to urban areas borders and to roads in ArcGIS 10.1. Visually scanning the same images, we were able to indicate presence and absence ofEucalyptusplantation, mining activities and native for-est matrix adjacent to each marsh. In order to obtain hydrological data, we used the Hydrology toolset in Spatial Analyst extension of ArcGIS 10.1 [61]. Based on ASTER GDEM 2 imagery [62], we calculated the water flow direction to obtain the flow accumulation raster and the drainage network. With the delineated drainage network it was possible to calculate the mini-mum distance between marsh centers and water courses displayed in the imagery. We also used average cattailTypha dominguensisdensity and height as covariates in the models. These were collected in the field, at each sample site, by counting cattail stalks in three 1 m2quadrats, randomly distributed in the sample site, for density estimates and then using the sward stick method for vegetal height estimates [63], [64], [65]. These features were assumed to be homo-geneous within each site. The choice of these variables was based on their ability to reflect the intensity of human occupation, the age of the marsh and natural features, i.e. they were used to investigate how human activities and environmental traits might influenceF.paludicola occupancy probabilities.
of generalized logistic regression analysis as there is some uncertainty as to whether an ob-served absence equates to a true absence [59]. While the probability of occupancy varies among sites, the parameters being estimated are theβvalues, or the regression coefficients of each covariate [59]. We built models using the package“unmarked”in the R software [66] (S2 Appendix), and began by fitting candidate single-season models, allowing them to vary with individual or additively combined site-specific covariates. In order to rank candidate models, we used the Akaike Information Criterion (AIC) [67], [68] by calculating the differ-ence between the best model (with the lowest AIC value) and all other models (ΔAIC) as well as using Akaike weights (ωi) (i. e., the conditional probability for each model). We calculated the strength of evidence in favor of one model over another by dividing their Akaike weights to obtain the evidence ratio [69]. We excluded models from our analysis that did not converge. We also examined the confidence intervals for each of the estimated parameters (95%), exclud-ing models with highly inclusive confidence intervals (with negative, zero and positive values). We applied model averaging method to estimate occupancy probability from the multiple models tested [70], we also calculated the relative importance of the model parameters in R package AICmodavg [71].
Field work was undertaken in accordance with Brazilian laws (permit number: 31224 Minis-tério do Meio Ambiente/ Instituto Chico Mendes de Conservação da Biodiversidade/ Sistema de Autorização e Informação em Biodiversidade). Areas accessed were privately owned and we did not sample protected species. The owners of the lands (Suzano Papel e Celulose, and small agricultural producers) gave permission to conduct the study on each site.
Results
Distribution Model and Distribution Range Size
Because of a slight advantage over GAM and GLM, we used the RF (AUC = 1, Kappa = 1 and TSS = 1) results to direct the field work procedure. The RF model showed habitat suitability in a very restricted area around the known distribution localities, and predicted a small westward extension into São Paulo state (Fig. 1). The analysis of variable contribution showed that iso-thermality had a relative contribution of 32% to the model; temperature seasonality, 29%; alti-tude, 25%; and annual temperature range, 14%.
Of the 57 areas surveyed,F.paludicolawas not detected in 54 of the areas, and found in only three new areas. These three sites were predicted to be part of the potential distribution of the species by the outcome of the model. We registered 42 points of absence in areas where the presence had been predicted, resulting in a commission error of 93%. Another 17 true absences were recorded in areas in whichF.paludicolawas predicted to be absent (Fig. 1). The EOO was estimated at 1,268 km2, the ES-EOO at 1,245 km2(Fig. 2) and AOO at 1.42 km2.
Occupancy Models
whereF.paludicolawas recorded (0.23), although this falls within the confidence interval for the estimates.
Discussion
Distribution
The SDM had a high accuracy and indicated a very restricted area of suitable habitat for F.paludicola. This is consistent with Jiménez-Valverde et al. [72] who suggested that modelling the distribution of species that are habitat specialists is more accurate than modelling the distri-bution of generalists [73], [74], [75]. On the other hand, this could also be the result of the small sample size (15 sites), or the narrow range of occurrence points [76], [77]. However, the validation process showed that the real distribution could be even smaller than the potential one (commission error of 93%). We could not find the species outside the polygon that repre-sents its current known distribution (Fig. 2). Based on the validation data, our results indicate that the distribution ofF.paludicolaextends only between the upper Tietê River in Salesópolis, Biritiba-Mirim and Mogi das Cruzes and the upper Paraíba do Sul River in Guararema and São José dos Campos.
Fig 2. Occurrence ofFormicivora paludicola.A) Example of LANDSAT 8 satellite image visually scanned in the search for marshes to be surveyed. Numbers 1 and 2 indicate new areas of occurrenceFormicivora paludicola. B) Circles represent areas of previously known occurrence that still possess the species; Stars represent new areas of occurrence discovered during our field surveys; Numbers 1 and 2 indicate the same areas of A; Green areas represent Random Forest model projections of areas climatically suitable forF.paludicola. The EOO (extent of occurrence) was estimated at 1,268 km2and ES-EOO
(environmental suitability in extent of occurrence) at 1,245 km2.
Within this area, there are only a few marshes occupied by the species. We were able to re-cordF.paludicolain only 10 of the 15 areas previously known to have been occupied [10], and in only three new areas (Figs.1and2). Therefore, some of the localities that were used to run the SDMs no longer possessed the species, and at these it is probably locally extinct. Four of these areas were lost due to the construction of the Paraitinga Reservoir. Between 2006 and 2007 there was an effort to translocate individuals from these populations to new areas but the success of this is still being studied by LFS. Another area is now covered by secondary growth (Ponte Nova Dam), and another still houses the species but belongs to a mining corporation and is currently being drained (Casa Grande Road).
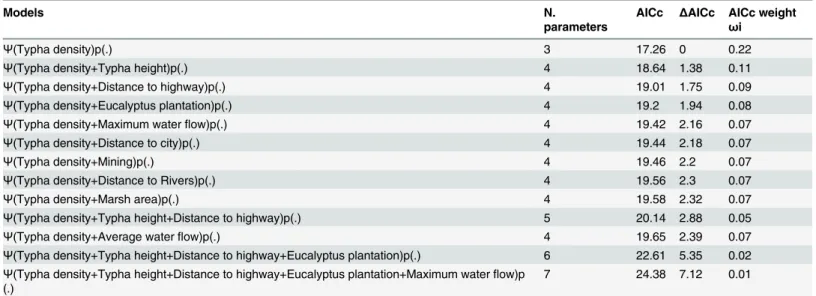
As mentioned above, we found only three additional localities withF.paludicola(Figs. 1and2), and we suggest that the species’distribution could be considered sparse and geo-graphically restricted to a very specific habitat. Such features often characterize rare species. Table 1. 13 best models tested for probabilities of occupancy ofFormicivora paludicola.
Models N.
parameters
AICc ΔAICc AICc weight
ωi
Ψ(Typha density)p(.) 3 17.26 0 0.22
Ψ(Typha density+Typha height)p(.) 4 18.64 1.38 0.11
Ψ(Typha density+Distance to highway)p(.) 4 19.01 1.75 0.09
Ψ(Typha density+Eucalyptus plantation)p(.) 4 19.2 1.94 0.08
Ψ(Typha density+Maximum waterflow)p(.) 4 19.42 2.16 0.07
Ψ(Typha density+Distance to city)p(.) 4 19.44 2.18 0.07
Ψ(Typha density+Mining)p(.) 4 19.46 2.2 0.07
Ψ(Typha density+Distance to Rivers)p(.) 4 19.56 2.3 0.07
Ψ(Typha density+Marsh area)p(.) 4 19.58 2.32 0.07
Ψ(Typha density+Typha height+Distance to highway)p(.) 5 20.14 2.88 0.05
Ψ(Typha density+Average waterflow)p(.) 4 19.65 2.39 0.07
Ψ(Typha density+Typha height+Distance to highway+Eucalyptus plantation)p(.) 6 22.61 5.35 0.02 Ψ(Typha density+Typha height+Distance to highway+Eucalyptus plantation+Maximum waterflow)p
(.) 7 24.38 7.12 0.01
N. parameters = number of parameters estimated by the model; AICc = Akaike Information Criterion value with correction for small samples;
ΔAICc = difference between each model and the best model; AICc weight = Akaike weights (ωi) (the conditional probability for each model).
doi:10.1371/journal.pone.0121315.t001
Table 2. Averaged estimates ofβs for models covariates.
Habitat variables β SE CI 0.025 CI 0.975
Typha density -3.75 1.42 -6.53 -0.97
Typha height 1.3 1.54 -1.73 4.32
Distance to highway 0.76 0.87 -0.93 2.46
Eucalyptus plantation 1.33 2.36 -5.95 3.29
Maximum waterflow 1.52 3.42 -5.18 8.21
Distance to city 0.43 0.88 -1.29 2.16
Mining -1.13 2.73 -6.49 4.23
Distance to rivers 0.26 0.73 -1.18 1.7
Marsh area 0.3 1.08 -1.81 2.41
Average waterflow 0.08 1.03 -1.94 2.1
The values indicate the relationship between variables and the probability of occupancy ofFormicivora paludicola.
Additionally, the marshes inhabited byF.paludicolaare on average 4.5 km apart, while long-term studies of the dispersal ability of its sister species (F.acutirostris) show that the maximum distance traveled by a bird in its entire life was of 180 m (from the place it was born to the site where it established its territory) [78]. In the future, genetic studies could also indicate whether the populations are geographically isolated. Such isolation could be due to the presence of urban and rural development in the 30 km separating both populations, or could be generated by natural processes.
Human occupation
The São Paulo Marsh Antwren has experienced a severe loss of habitat in the last 100 years. Documents and maps from 1889 to 1905 show that in the urban region of São Paulo and be-tween Jacareí and Caçapava in the Upper Paraíba do Sul Basin, there were more than 410 km2 of marshes and wetlands [2], [13], [79]. Current LANDSAT imagery shows that this has been almost completely replaced by mining, agriculture, pastures, industries, and urban develop-ment (Fig. 4). According to results of the Random Forest SDM, 346 out these 410 km2 repre-sented climatically suitable areas for the species. This data indicate thatF.paludicolacould have lost more than 90% of suitable areas. New searches for suitable natural marshes and F.paludicolashould therefore be done using this historical information.
Status
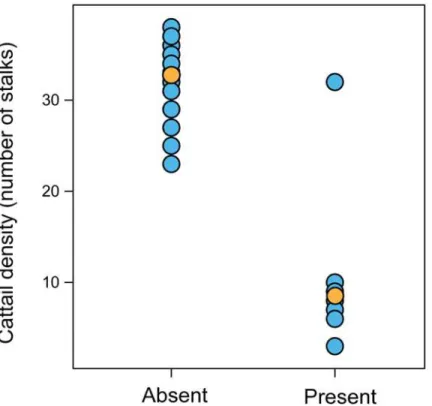
Using the occurrence data, we defined the IUCN Red List category in whichF.paludicola should be considered. After calculating the EOO and ES-EOO, we observed that the potential geographic distribution by Random Forest could indicate unsuitable areas for the species inside Fig 3. Differences between density of cattail (Typha dominguensis) in sites whereFormicivora paludicolais absent or present.Orange dots represent average values.
the EOO (Fig. 2). This result indicates that the extent of occurrence may be even smaller than 1,268 km2(ES-EOO—1 245 km2). Although this EOO could be considered large when com-pared to that of other threatened Brazilian Thamnophilids, such as:Formicivora littoralis (Edangered—EOO: 260 km2) [80],Formicivora erythronotos(Endangered—EOO: 130 km2) Fig 4. The severe reduction of São Paulo’s wetlands.Present (2013) LANDSAT images of São Paulo
State superimposed on the yellow outline that represents the extent of wetlands and marshes before urbanization, in 1905, according to the Comissão Geológica e Geográfica de São Paulo. This shows the
extent of human occupation of wetland areas, which have been predominantly replaced by agriculture, urbanization and mining: A) Tietêand B) Paraíba do Sul Basins in the São Paulo Metropolitan Region. Pink
stars represent marshes whereFormicivora paludicolais known to occur.
[81], andMyrmotherula snowi(Critically Endangered—EOO: 150 km2) [82], its AOO is 1.42 km2, almost 10 times smaller than the inferior threshold for considering a species as Critically Endangered (IUCN criteria B2) [61]. This, along with the severe fragmentation of the occupied area (IUCN B2a), its limited dispersal ability, narrow habitat specificity, limited habitat avail-ability, and possible severe population reduction over the last 100 years due to habitat loss (IUCN A2; B2c), show thatF.paludicolashould be classified as Critically Endangered accord-ing to IUCN Red List criteria [58].
Enhancing Protection
Today, the Upper Tietê and Upper Paraíba do Sul basins are together occupied by around 16 million people, around 8% of entire Brazilian population [3]. This huge human presence is re-flected in complex and intensive forms of land transformation and of natural resources use [83]. Marshes are highly vulnerable to the expansion of areas dedicated to agriculture, livestock farming, mining or urbanization. This has resulted in the extensive loss of wetlands in many countries throughout the world [84]. In North America, similar problems have led to a sharp decline of many wetland bird species [85], [86], [87], making these wetlands a primary conser-vation focus [88]. Many other bird species inhabiting the São Paulo wetlands are also consid-ered threatened in regional Red Lists, such as the Lesser Grass-Finch (Emberizoides
ypiranganus), Long-winged Harrier (Circus buffoni), and the Sickle-winged Nightjar ( Hydro-psalis anomala) [14]. Additionally there are several fish species, includingHyphessobrycon dur-agenys,Hyphessobrycon flammeus,Spintherobolus papilliferus,Heptapterus multiradiatus, Pseudotocinclus parahybae, and an amphibianCycloramphus semipalmatusthat are endemic to the Upper Tietê and/or Upper Paraíba do Sul Basins, and are threatened according to re-gional lists [89], [90]. If transformation continues at the present rate, São Paulo’s wetlands are destined to be totally destroyed or completely degraded, which would likely result in the loss of their specialist species, includingF.paludicola.
Urgent conservation action is required not only to protect the target species of this project —which could be also considered a flagship species—but the complete biota of São Paulo’s wet-lands. Entire ecological communities are threatened by the disorderly development that contin-ues to transform marshes into urban areas, pastures and mines. This happens because marshes were historically considered areas of lower economical and anthropological value. However, in-tact wetlands are of enormous economic value due to their ability to store floodwaters, protect shorelines, improve water quality, recharge groundwater aquifers, and process nutrients [1], [91], [92], [93]. Therefore, we strongly advise the creation of protected areas and the restora-tion of marshes in the Upper Tietê and Paraíba do Sul basins. We also suggest the crearestora-tion of a protected area, which would include the Mogi Marsh, near the Rio Acima Road, since it is the largest area which sheltersF.paludicola. An even better scenario would be the creation of a re-serve from Mogi das Cruzes to Salesópolis with protected and connected marshes separated by a proper buffer zone between it and the surrounding agriculture and mining activities, to re-duce the contamination of their waters. The protection of a diverse spectrum of wetland types would also mitigate the problem that marshes are often transitory in nature.
Habitat Features and Conservation Priorities
maximum at intermediate levels of biomass in cattail marshes. Therefore it is reasonable to sug-gest that high cattail density is associated with low vegetation heterogeneity [96], [97], [98].
Cattail proliferation may be related to anthropic activities as it is a pioneer species in wet-land colonization [1]. The removal of riverside forests intensifies soil erosion and the produc-tion of sediments that accumulate in the lower parts of the drainage system. This siltaproduc-tion results in the water spreading out, forming environments suitable for the growth of cattail and also exotic plants adapted to saturated soils, such asHedychium coronarium[4]. Cattail also benefits from the eutrophication of aquatic environments and this can result in the cattail dense stands often found near highways, water reservoirs and pastures [98]. However, accord-ing to Keddy [1], dense single species stands are often undesirable for wildlife. Therefore, these areas may not be suitable forF.paludicola. Many of these areas were probably formed compar-atively recently and so there may have insufficient time for them to be colonized due to their distance from the generally isolated marshes inhabited byF.paludicola. Our results show that marshes with higher plant diversity are more suitable for the occurrence ofF.paludicola. Fur-thermore, we present important information for prioritization of areas in conservation efforts. Our results are also consistent with the idea of maintaining marshes with heterogeneous emer-gent vegetation, and other sources of plant diversity such as shrub borders, as an important means of wildlife conservation [99].
Conclusions
The multimodel/field surveys approached helped to indicate the species conservation status and also its environmental requirements in two different scales. We encourage the use of distri-bution models combined with field validation and occupancy models to assess the threatening status of other species and of their environment. This could be applied worldwide, generating reliable data which could guide successful conservation strategies.
In this study we have shown that besides being restricted, the distribution ofF.paludicolais also very sparse, fragmented and habitat-specific. Based on these distribution patterns and the area of occupancy,F.paludicolashould be considered Critically Endangered according to the IUCN Red List criteria. We also recorded a few local extinctions. We therefore encourage the creation of a network of protected areas in the Upper Tietê and Upper Paraíba do Sul basins, prioritizing the protection of older marshes with heterogeneous vegetation. A series of protected wetlands could be an attraction for tourism and environmental education. The protection of these wetlands would also safeguard water supply and quality, recharge aquifers and protect against flooding. Besides benefiting the human population, the conservation ofF.paludicola could help to restore a piece of Atlantic Forest wetlands’and maintain its associated biota.
Supporting Information
S1 Appendix. R Script used to perform species distribution models. (DOCX)
S2 Appendix. R script used to perform occupancy models. (DOCX)
S1 Dataset. Detection history of São Paulo Marsh Antwren in 47 areas (.csv).In column “Detection history”: 1 = detected; 0 = not-detected. In column regarding presence of forest ma-trix, Eucalyptus plantation and mining: 1 = present; 0 = absent. Water flow was measured by a relative raster value (determined by accumulating the weight for all cells of the raster that flow into each downslope cell).
S1 Table. Localities whereFormicivora paludicolahistorically occurred (used for distribu-tion modeling procedures) and localities whereF.paludicolacurrently occurs.
New occurrences.
(DOCX)
S2 Table. Procedures used to run each species distribution model.SDM = Species Distribution Model; GLM = generalized linear model; GAM = generalized additive model; MARS = multivariate adaptive regression; CTA = classification tree analysis; ANN = artificial neural networks; RF = random forest.
(DOCX)
S3 Table. Localities used for validation process and occupancy models in which Formici-vora paludicolawas not detected.
(DOCX)
S4 Table. Detection history of São Paulo Marsh Antwren in 47 areas.In column“Detection history”: 1 = detected; 0 = not-detected. In column regarding presence of forest matrix, Euca-lyptus plantation and mining: 1 = present; 0 = absent. Water flow was measured by a relative raster value (determined by accumulating the weight for all cells of the raster that flow into each downslope cell).
(DOCX)
S5 Table. All occupancy models tested.Density =Typha dominguensisdensity;
matrix = presence of forest matrix adjacent to the marsh; area = marsh size; height =Typha dominguensisheight; minwater = minimum water flow;Eucalyptus= presence ofEucalyptus plantation adjacent to the marsh; mining = presence of mining activities adjacent to the marsh; rivers = distance to rivers; city = distance to urban areas; highways = distance to highways; maxwater = maximum water flow; avewater = average water flow.
(DOCX)
Acknowledgments
We thank all the field work volunteers, Bruno Rennó and Francisco Denés for helpful informa-tion. Gustavo Bravo, Leonardo Wedekin, Natália Mundim Torres, Vagner Cavarzere, Jeremy Dickens, Adrian Barnett, two anonymous reviewers and the editor Francisco Moreira read crit-ically the manuscript improving its quality substantially.
Author Contributions
Conceived and designed the experiments: GDR MAR LFS. Performed the experiments: GDR MAR LFS. Analyzed the data: GDR MAR LFS. Contributed reagents/materials/analysis tools: GDR MAR LFS. Wrote the paper: GDR MAR LFS.
References
1. Keddy PA. Wetland ecology: principles and conservation. Cambridge: Cambridge University Press; 2010.
2. Jorge J. Tietêo rio que a cidade perdeu, São Paulo, 1890–1940. São Paulo: Alameda; 2006.
3. IBGE—Instituto Brasileiro de Geografia e Estatística. Pesquisa Nacional por Amostra de Domicílios. Síntese dos Indicadores de 2009. 2010; Available:http://www.ibge.gov.br/home/estatistica/populacao/ trabalhoerendimento/pnad2009/pnad_sintese_2009.pdf.
4. Iserhagem I, Brancalion PHS, Rodrigues RR, Nave AG, Gandolfi S. Diagnóstico ambiental das áreas a serem restauradas visando a definição de metodologias de retauração florestal. In: Rodrigues RR,
conceitos e ações de restauração florestal. São Paulo: LERF/ESALQ Instituto BioAtlântica; 2009. pp.
87–127.
5. Laurance WF. Conserving the hottest of the hotspots. Biol Cons. 2009; 142: 1137.
6. Coimbra-Filho AF, Câmara IG. Os limites originais do bioma Mata Atlântica na região nordeste do
Brasil. Rio de Janeiro: Fundação Brasileira para a Conservação da Natureza; 1996.
7. Dean W. With broadax and firebrand: the destruction of the Brazilian Atlantic Forest. Berkeley: Univer-sity of California Press. 1995.
8. Fonseca GAB. The vanishing Brazilian Atlantic forest. Biol Cons. 1995; 34: 17–34.
9. Galindo-Leal C, Câmara IG. The Atlantic Forest of South America: biodiversity status, threats, and out-look. Washington DC: Island Press; 2003.
10. Buzzetti DRC, Belmonte-Lopes R, Reinert BL, Silveira LF, Bornschein MR. A new species of Formici-voraSwainson, 1824 (Thamnophilidae) from the state of São Paulo, Brazil. Braz J Ornithol 2013; 21:
269–291.
11. Silveira LF, Uezu A. Checklist das aves do Estado de São Paulo, Brasil. Biota Neotrop. 2011; 11: 2–28.
12. Zimmer KJ, Isler ML. Family Thamnophilidae (Typical Antibirds). In: del Hoyo J, Elliott A, Christie D, edi-tors. Handbook of the Birds of the World, Broadbills to Tapaculos. Barcelona: Lynx Edicions; 2003. pp. 448–681.
13. Coelho VMB. Paraíba do Sul: um rio estratégico. Rio de Janeiro: Casa da Palavra; 2012.
14. Silveira LF, Benedicto GA, Schunck F, Sugieda AM. Aves. In: Bressan PM, Kierulf MC, Sugieda AM, editors. Fauna ameaçada de extinção no Estado de São Paulo: Vertebrados. São Paulo: Fundação
Parque Zoológico de São Paulo e Secretaria do Meio Ambiente; 2009. pp. 87–283.
15. Austin M. Spatial prediction of species distribution: an interface between ecological theory and statisti-cal modelling. Ecol Model. 2002; 157: 101–118.
16. Elith J, Burgman MA. Predictions and their validation: rare plants in the Central Highlands, Victoria, Australia. In: Scott JM, Heglund P, Morrison ML, Raven PH, editors. Predicting Species Occurrences: Issues of Accuracy and Scale. Covelo: Island Press; 2002. pp. 303–314.
17. Franklin J. Predictive vegetation mapping: geographic modelling of biospatial patterns in relation to en-vironmental gradients. Prog Phys Geog. 1995; 19: 474–499.
18. Grahan CH, Ferrier S, Huettman F, Moritz C, Peterson AT. New developments in museum-based infor-matics and applications in biodiversity analysis. Trends Ecol Evol. 2004; 19: 497–503. PMID:16701313
19. Guisan A, Zimmermann NE. Predictive habitat distribution models in ecology. Ecol Model. 2000; 135: 147–186.
20. Ko CY, Lin RS, Ding TS, Hsieh CH, Lee PF. Identifying biodiversity hotspots by predictive models: a case study using Taiwan’s endemic bird species. Zool Stud. 2009; 48: 418–431.
21. Loiselle BA, Howell CA, Graham CH, Goerck JM, Brooks T, Smith KG, et al. Avoiding pitfalls of using species distribution models in conservation planning. Conserv Biol. 2003; 17: 1591–1600.
22. Marmion M, Luoto M, Heikkinen RK, Thuiller W. The performance of state-of-art-modelling techniques depends on geographical distribution of species. Ecol Model. 2009; 220(24): 3512–3520.
23. Engler R, Guisan A, Rechsteiner L. An improved approach for predicting the distribution of rare and en-dangered species form occurrence and pseudo-absence data. J Appl Ecol. 2004; 41: 263–274.
24. Kamino LHY, Siqueira MF, Sánchez-Tapia A, Stehmann JR. Reassessment of the extinction risk of endem-ic species in the Neotropendem-ics: how can modelling tools help us? Braz J Nat Conserv. 2012; 10: 191–198.
25. Grumbine E. Protecting biological diversity through the greater ecosystem concept. Nat Area J. 1990; 10: 114–120.
26. Myers N. Threatened biotas: hotspots in tropical forests. Environmentalist. 1988; 8: 178–208.
27. Petit LJ, Petit DR. Evaluating the Importance of human-modified lands for Neotropical bird conserva-tion. Conserv Biol. 2003; 17(3): 687–694.
28. MacKenzie DI, Bailey LL. Assessing the fit of site-occupancy models. J Agric Biol Envir St. 2004; 9: 300–318.
29. Hijmans RJ, Cameron SE, Parra JL, Jones PG, Jarvis A. Very high resolution interpolated climate sur-faces for global land areas. Int J Climatol. 2005; 25: 1965–1978.
30. Warren DL, Glor RE, TureIli M. ENMTools: a toolbox for comparative studies of environmental niche models. Ecography. 2009; 33: 607–611.
32. Lehner B, Verdin K, Jarvis A. New global hydrography derived from spaceborne elevation data. Eos Trans. 2008; 89(10): 93–94.
33. Ximenes AC. Mapas auto-organizáveis para a identificação de ecorregiões do interflúvio
Madeira-Purus: uma abordagem da biogeografia ecológica. (INPE-15332-TDI/1372). M.Sc. Thesis, Instituto Nacional de Pesquisas Espaciais. 2008. Available:http://urlib.net/sid.inpe.br/mtc-m18@80/2008/08. 18.14.02.
34. Amaral S, Costa CB, Arasato LS, Ximenes AC, Rennó CD. AMBDATA: Variáveis ambientais para Modelos de Distribuição de Espécies (MDEs). In: Ribeiro ML, Santos TG, Sant’Anna SJ, editors. Anais
XV Simpósio Brasileiro de Sensoriamento Remoto. São José dos Campos: Instituto Nacional de
Pes-quisas Espaciais; 2013. pp. 6930–6937.
35. Thuiller W. BIOMOD—optimizing predictions of species distributions and projecting potential future
shifts under global change. Glob Change Biol. 2003; 9: 1353–1362.
36. R Development Core Team. R: a language and environment for statistical computing. R Foundation for Statistical Computing. 2013. Available:www.R-project.org.
37. McCullagh P, Nelder JA. Generalized linear models. Chapman & Hall/CRC. 1989. 38. Hastie TJ, Tibshirani RJ. Generalized additive models. Chapman & Hall/CRC. 1990. 39. Friedman JH. Multivariate adaptive regression splines. The Ann Stat. 1991; 19: 1–67. 40. Breiman L. Classification and regression trees. Chapman & Hall/CRC; 1984.
41. Ripley B. Pattern recognition and neural networks. Cambridge: Cambridge University Press; 1996. 42. Breiman L. Random forests. Mach Learn. 2001; 45: 5–32.
43. Araújo MB, Pearson RG, Thuiller W, Erhard M. Validation of species-climate impact models under cli-mate change. Glob Change Biol. 2005; 11: 1504–1513.
44. Li X, Wang Y. Applying various algorithms for species distribution modelling. Integr Zool. 2013; 8: 124–135.10.1111/1749-4877.12000PMID:23731809
45. Roberts DR, Hamann A. Method selection for species distribution modelling: are temporally or spatially independent evaluations necessary? Ecography. 2012; 35: 792–802.
46. Ledig FT, Rehfeldt GE, Sáenz-Romero C, Flores-López C. Projection of suitable habitat for rare spe-cies under global warming scenarios. Am J Bot. 2010; 97(6): 970–987.10.3732/ajb.0900329PMID:
21622467
47. Lu N, Jia C-X, Lloyd H, Sun Y-H. Species-specific habitat fragmentation assessment, considering the ecological niche requirements and dispersal capability. Biol Cons. 2012; 152: 102–109.
48. Muñoz J, Felicísimo AM. Comparison of statistical methods commonly used in predictive modelling.
J Veg Sci. 2004; 15(2): 285–292.
49. Breiman L, Cutler A. Setting up, using, and understanding Random Forests v4.0. 2003. Available:
http://www.stat.berkeley.edu/users/breiman/rf.html.
50. Barbet-Massin M, Jiguet F, Alberts CH, Thuiller W. Selecting pseudo-absences for species distribution models: how, where, and how many? Methods Ecol Evol. 2012; 3: 327–338.
51. Liu C, White M, Newel G. Selecting thresholds for the prediction of species occurrence with presence-only data. J Biogeograph. 2013; 40: 778–789
52. Allouche O, Tsoar A, Kadmon R. Assessing the accuracy of species distribution models: prevalence, kappa and the true skill statistic (TSS). J Appl Ecol. 2006; 43: 1223–1232.
53. Fielding AH, Bell JF. A review of methods for the assessment of prediction errors in conservation presence/absence models. Environ Conserv. 1997; 24: 38–49.
54. Cohen J. A coefficient of agreement for nominal scales. Educ Psychol Measur. 1960; 20: 37–46.
55. Pearce J, Ferrier S. Evaluating the predictive performance of habitat models developed using logistic regression. Ecol Model. 2000; 133: 225–245.
56. United States Geological Survey Project. Earth Explorer LANDSAT 8. 2013. Available:http:// earthexplorer.usgs.gov.
57. Boscolo D, Metzger JP. Isolation determines patterns of species presence in highly fragmented land-scapes. Ecography. 2011; 34(6): 1018–1029.
58. International Union for Conservation of Nature (IUCN) Standards & Petitions Subcommittee. Guidelines for Using the IUCN Red List Categories and Criteria. Version 9.0. Prepared by the Stan-dards and Petitions Subcommittee. 2014. Availablehttp://www.iucnredlist.org/documents/ RedListGuidelines.pdf.
60. Reside AE, VanDerWal J, Kutt AS. Projected changes in distributions of Australian tropical savanna birds under climate change using three dispersal scenarios. Ecol Evol. 2012; 2: 705–718.10.1002/
ece3.197PMID:22837819
61. McCoy J, Johnston K. Using ArcGISTM Spatial Analyst. California: Environmental Systems Research Institute Inc; 2001.
62. METI/NASA. Global Digital Elevation Model Version 2 (GDEM V2). LP DAAC; 2012.
63. Barthram GT. Experimental techniques: the HFRO sward stick. In: Hill Farming Research Organization, editor. Organization Biennial Report 1984–1985. Edinburgh: HFRO; 1986. pp. 29–30.
64. Goldsmith FB, Harrison CM, Morton AJ. Description and analysis of vegetation. In: Moore PD, Chapman SB, editors. Methods in plant ecology. Oxford: Blackwell Scientific Publications; 1986. pp. 437–519.
65. Sutherland WJ, Green RE. Habitat assessment. In: Sutherland WJ, Newton I, Green RE, editors. Bird ecology and conservation, a handbook of techniques. New York: Oxford University Press; 2004. pp. 251–268.
66. Fiske I, Chandler R. Unmarked: an R package for fitting hierarchical models of wildlife occurrence and abundance. J Stat Softw. 2011; 43: 1–23. PMID:22003319
67. Akaike H. A new look at the statistical model identification. IEEE Trans Autom Control. 1974; 19: 716–723.
68. Burnham KP, Anderson DR. Multimodel inference: understanding AIC and BIC in model selection. Sociol Method. 2004; 33: 261–304.
69. Wagenmakers EJ, Farrel S. AIC model selection using Akaike weights. Psychon B Rev. 2004; 11: 192–196. PMID:15117008
70. Burnham KP, Anderson DR. Model selection and multi-model inference. A practical information-theoretic approach. New York: Springer; 2002.
71. Mazerolle MJ. AICcmodavg: model selection and multimodel inference based on (Q)AIC(c). R package version 1.26. 2012. Available:http://cran.r-project.org/web/packages/AICcmodavg/index.html. 72. Jiménez-Valverde A, Lobo JM, Hortal J. Not as good as they seem: the importance of concepts in
spe-cies distribution modelling. Divers Distrib. 2008; 14: 885–890.
73. Elith J, Grahan CH, Anderson RP, Dudík M, Ferrier S, Guisan A, et al. Novel methods improve predic-tion of species’distributions from occurrence data. Ecography. 2006; 29: 129–151. PMID:16622301
74. McPherson JM, Jetz W. Effects of species’ecology on the accuracy of distribution models. Ecography. 2007; 30: 135–151.
75. Tsoar A, Allouche O, Steinitz O, Rotem D, Kadmon R. A comparative evaluation of presence-only methods for modelling species distribution. Divers Distrib. 2007; 13: 397–405.
76. Phillips SJ, Dudík M. Modeling of species distributions with Maxent: new extensions and a comprehen-sive evaluation. Ecography. 2008; 31: 161–175.
77. Wisz MS, Hijmans RJ, Li J, Peterson AT, Graham CH, Guisan A, et al. Effects of sample size on the performance of species distribution models. Diversity and Distributions. 2008; 14: 763–773.
78. Reinert BL, Bornschein MR, Firkowski C. Distribuição, tamanho populacional, hábitat e conservação
do bicudinho-do-brejo Stymphalornis acutirostris Bornschein, Reinert e Teixeira, 1995 (Thamnophili-dae). Braz J Ornithol. 2007; 15: 493–519.
79. Jorge J. Rios e saúde na cidade de São Paulo, 1890–1940. Hist Perspec 2012; 25: 103–124.
80. BirdLife International. Species factsheet:Formicivora littoralis. 2013. Available:http://www.birdlife.org. 81. BirdLife International. Species factsheet:Formicivora erythronotos. 2013. Available:http://www.
birdlife.org.
82. BirdLife International. Species factsheet:Myrmotherula snowi. 2013. Available:http://www.birdlife.org. 83. Hirata RCA, Ferreira LMR. Os Aquíferos da Bacia Hidrográfica do Alto Tietê: disponibilidade hídrica
e vulnerabilidadeàpoluição. Rev Brasil Geocienc. 2001; 31: 43–50.
84. Mitsch WJ, Gosselink JG. Wetlands. New York: Wiley; 1993.
85. Bolenbaugh JR, Krementz DG, Lehnen SE. Secretive marsh bird species co-occurrences and habitat association across the Midwest, USA. J Fish Wildl Manage. 2011; 2: 29–60.
86. Eddleman WR, Knopf FL, Meanley B, Reid FA, Zembal R. Conservation of North American rallids. Wil-son Bull. 1988; 100: 458–475.
88. North American Bird Conservation Initiative. Bird conservation plans. U.S. North American Bird Conser-vation Initiative Committee. 2009. Available:http://www.nabci-us.org/plans.htm.
89. Garcia PCA, Sawaya RJ, Martins IA, Brasileiro CA, Verdade VK, Jim J, et al. Anfíbios. In: Bressan PM, Kierulf MC, Sugieda AM, editors. Fauna ameaçada de extinção no Estado de São Paulo: Vertebrados.
São Paulo: Fundação Parque Zoológico de São Paulo e Secretaria do Meio Ambiente; 2009. pp.
329–347.
90. Oyakawa OT, Menezes NA, Shibatta OA, Tima FCT, Langeani F, Pavanelli CS, et al. Peixes de Água Doce. In: Bressan PM, Kierulf MC, Sugieda AM, editors. Fauna ameaçada de extinção no Estado de
São Paulo: Vertebrados. São Paulo: Fundação Parque Zoológico de São Paulo e Secretaria do Meio
Ambiente; 2009. pp. 349–424.
91. Daily G. Nature’s services: societal dependence on natural ecosystems. Washington, DC: Island
Press; 1997.
92. Mitsch WJ, Gosselink JG. The value of wetlands: importance of scale and landscape setting. Ecol Econ. 2000; 35: 25–33.
93. Zedler JB, Kercher S. Wetland resources: status, trends, ecosystem services, and restorability. Annu Rev Environ Resour. 2005; 30: 39–74.
94. Auclair AND, Bouchard A, Pajaczkowski J. Plant standing crop and productivity relations in a Scirpus-Equisetumwetland. Ecology. 1976; 57: 94–152.
95. Rejmankova E, Pope KO, Pohl MD, Rey-Benayas JM. Freshwater wetland plant communities of north-ern Belize: implications for paleoecological studies of Maya wetland agriculture. Biotropica. 1995; 27: 28–36.
96. Davis SM. Growth, decomposition, and nutrient retention ofCladium jamaicenseCrantz andTypha domingensisPers. in the Florida Everglades. Aquat Bot. 1991; 40: 203–224.
97. Newman S, Schuette J, Grace JB, Rutchey K, Fontaine T. Factors influencing cattail abundance in the northern Everglades. Aquat Bot. 1998; 60: 265–280.
98. Urban NH, Davis SM, Aumen NG. Fluctuations in sawgrass and cattail densities in Everglades Water Conservation Area 2A under varying nutrient, hydrologic and fire regimes. Aquat Bot. 1993; 46: 203–223.