AR
TIGO ORIGINAL / ORIGINAL AR
TICLE
INTRODUCTION
Infection with hepatitis C virus (HCV) is a leading cause of chronic diseases in the world. Estimated data from the World Health Organization (WHO) show that about 170 million people are infected with HCV, corresponding to 3% of the world population(26, 30, 32, 40).
In Brazil, this number varies according to region, with 1.38% of the population carrying the virus(25)
.
Nutritional evaluation is very important in chronic liver diseases, since inadequate nutritional parameters can be the result of advanced stages of disease or can even influence the progression of the disease. In cirrhosis, protein-energy malnutrition, when
pre-ASSOCIATION OF THE NUTRITIONAL
PROFILE WITH HISTOLOGICAL FINDINGS
OF PATIENTS WITH GENOTYPE 1 CHRONIC
HEPATITIS C INFECTION
Vanessa Aparecida de
SANTIS E SILVA
1, Maria Lucia G
FERRAZ
1,
Roberto de
CARVALHO-FILHO
1, Valeria Pereira
LANZONI
2,
Antonio Eduardo Benedito
SILVA
1and Ivonete S S
SILVA
1Received 27/4/2015 Accepted 24/6/2015
ABSTRACT - Background- Different factors are responsible for the progression of hepatic ibrosis in chronic infection with hepatitis C virus, but the role of nutritional factors in the progression of the disease is not clearly deined. This study aimed to evaluate the nutritional status and dietary proile among patients with chronic hepatitis C who were candidates for treatment and its association with histopathological features. Methods- A crossectional study was conducted on treatment-naïve patients with chronic hepatitis C genotype 1, between 2011 and 2013. The following assessments were performed before treatment: liver biopsy, anthropometric measurements and qualitative/quantitative analysis of food intake. Results- Seventy patients were studied. The majority of patients was classiied as obese (34%) or overweight (20%) according to body mass index [BMI] and as at risk for cardiovascular diseases by waist circumference (79%). Unhealthy food intake was presented by 59% according to qualitative parameters and several pa-tients showed an insuficient intake of calories (59%), excessive intake of protein (36%) and of saturated fat (63%), according to quantitative analysis. With respect to histology, 68% presented activity grade ≥2, 65% had steatosis and 25% exhibited ibrosis stage >2. Comparative analysis between anthropometric parameters and histological features showed that elevated waist circumference was the only variable associated to hepatic steatosis (P=0.05). There was no association between qualitative and quantitative food intake parameters with histological indings. Conclusion- In this study, most of the patients with hepatitis C presented inadequate qualitative food intake and excessive consumption of saturated fat; in addition, excess of abdominal fat was associated to hepatic steatosis. Therefore, nutritional guidance should be implemented prior to treatment in patients with chronic hepatitis C, in order to avoid nutritional disorders and negative impact on the management of patients.
HEADINGS - Liver cirrhosis. Chronic hepatitis C. Fatty liver. Nutritional status. Eating.
Declared conflict of interest of all authors: none Disclosure of funding: no funding received
1 Departamento de Gastroenterologia Clínica, Universidade Federal de São Paulo - UNIFESP, São Paulo, SP, Brasil; 2 Departamento de Patologia da Universidade Federal
de São Paulo - UNIFESP, São Paulo, SP, Brasil.
Correspondence: Vanessa Aparecida de Santis e Silva. Departamento de Gastroenterologia. Universidade Federal de São Paulo. Rua Dr. Bacelar, 719, 101 - CEP: 04026-001 - São Paulo, SP, Brasil. E-mail: [email protected]
sent(7), is the result of metabolic alterations caused by
the disease, as well as of a reduction in food intake related to factors such as anorexia, nausea, vomiting, non-palatable salt-restricted diets for the control of ascites, and dysgeusia caused by zinc and magnesium deiciency, among others(21, 24).
The nutrition status is also involved in the progression of liver disease in patients with chronic hepatitis C, especially, obesity that plays an unfavorable role in the progression of the disease as a consequence of hepatic steatosis(11, 23).
in the adult population is 17,4%(31). This increase is, among
other factors, associated with physical inactivity and with dietary changes that have occurred over the last two decades, with the adoption of a diet rich in saturated fats, sugars and sodium and low in ibers(4). Data from Brazilian Survey on
Family Budgets conducted between 2008 and 2009 showed that carbohydrate intake decreased while the consumption of saturated and monounsaturated fats and proteins of animal origin increased(5).
Although studies evaluating nutritional factors in pa-tients with chronic hepatitis C are scarce, it is reasonable to suggest that adequate quantitative and qualitative food intake and also adequate body weight are particularly im-portant for this population. Therefore, the objective of the present study was to evaluate nutritional status and dietary proile and its association with histopathological features in patients with chronic hepatitis C who were candidates for treatment.
METHODS
Patients and study design
A study was conducted on treatment-naive patients with chronic hepatitis C genotype 1 candidates to antiviral treatment, seen between 2011 and 2013 at the Hepatitis Center of the Department of Clinical Gastroenterology, Federal University of São Paulo-Brazil.
Treatment-naive patients infected with genotype 1 older than 18 years, who had an adequate biopsy for analysis and had not undergone previous nutritional intervention, were included in the study. Patients with decompensated cirrho-sis, co-infected with human immunodeiciency virus (HIV) or hepatitis B virus (HBV), alcoholics, presence of chronic kidney disease or in the absense of liver biopsy, all were excluded from the analysis.
Data were collected after approval of the study by the Research Ethics Committee Federal University of São Paulo-Brazil.
Serological and virological analysis
Anti-HCV antibodies were detected by a third-generation enzyme immunoassay (Abbott Laboratories, Germany) using antigens against the core, NS3 and NS4 regions.
Virological analysis for the detection of HCV RNA was performed by qualitative and quantitative real-time polymerase chain reaction (PCR), with detection limits of 50 and 200 IU/mL, respectively(8, 9). Genomic sequencing of
the 5’-untranslated region (5’UTR) of the PCR products was used to identify HCV genotypes(28).
Histopathological analysis
Histological analysis was used to evaluate activity grade
and ibrosis stage, according to the METAVIR(2) system.
Hepatic steatosis was also evaluated. For comparative analy-sis, patients were divided according to inlammatory activity (A) into grades 0-1 vs 2-3 and according to ibrosis (F) into grades 0-2 vs 3-4.
Assessment of nutritional status
Nutritional assessment was divided into anthropometric evaluation and qualitative/quantitative analysis of food intake.
Anthropometric evaluation
The body mass index (BMI) was evaluated as proposed by the World Health Organization for adults (normal range: 18.5–24.99 kg/m²)(35) and by the Survey on Health, Well-Being
and Aging in Latin America and the Caribbean of the Pan American Health Organization for older adults ≥60 years (normal range: 23-28 kg/m²)(18).
Waist circumference (WC, expressed in cm) was measured with the patient standing, using a tape measure at the midpoint between the anteroposterior iliac crest and the last rib. Patients were classiied according to WHO criteria(34) as being at risk
for cardiovascular diseases (men ≥94 cm and women ≥80 cm). Arm circumference (AC, expressed in cm) was measured with a tape measure on the right arm in a relaxed position, at the midpoint between the acromion and humero-radial joint. Triceps (TST) and subscapular (SST) skinfold thickness was measured with a Lange® caliper and was expressed in mm.
Arm muscle circumference (AMC) was calculated using
the formulae proposed by Frisancho (1990)(13): AMC = AC
– (TST x 0.314), whereas AC = arm circumference and TST = triceps skinfold thickness.
Arm muscle area (AMA) was calculated using the following formulae: AMC2/12.57. Corrected arm muscle area
(CAMA) was calculated from AMA, subtracting a value of 10 cm2 for men and of 6.5 cm2 for women, which corresponds
to the area occupied by bone.
The classiication of AC, TST, SST, AMC and CAMA was based on the values proposed by Frisancho(13). For
com-parison with the histological parameters, all anthropometric variables were categorized into adequate and inadequate (patients above and below the normal range).
Qualitative and quantitative analysis of food intake
Food intake was evaluated before treatment using a 24-hour food recall applied by a nutritionist in weekly visits over a period of one month and calculated mean intake from these data for comparison. The 24-hour recall method was used because of the characteristics of the population, which mainly consisted of illiterate adults with dificulties in illing out the 3-day food diary that was applied at the beginning of the study. Multiple 24-hour recalls are a reasonable choice according to other authors(27). Qualitative analysis was
per-formed according to the Healthy Eating Index, proposed by Fisberg et al.(12) composed by 10 components. For comparison,
diet was classiied as healthy (score ≥65 points) or unhealthy (score <64 points).
The quantitative content of dietary calories, carbohy-drates, proteins and fat was analyzed using the Nutriquanti®
software. The intake of macronutrients was classiied as adequate when it was within the recommended intake levels, or insuficient and excessive; it was based on criteria proposed by DRI, 2002/2005(15). Proteins were also classiied as gram
and saturated fat was classiied according to Brazilian Society of Cardiology (2007)(29). For comparision with the
histologi-cal parameters, all nutrients were divided into two groups: adequate, when they were within the recommended intake levels, or inadequate when they were insuficient or excessive.
Statistical analysis
Numerical variables were expressed as the mean and standard deviation. The results were compared by the chi-squared or Fisher’s exact test, when appropriate. A level of signiicance of 0.05 (a = 5%) was adopted. All analyses were performed with the SPSS v.16 program.
RESULTS
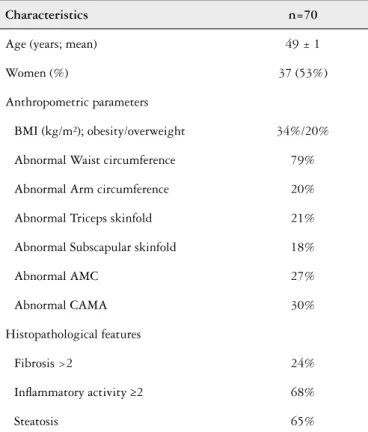
Seventy patients with genotype 1 chronic hepatitis C, who were candidates for treatment were studied. The mean age of the patients was 49±1.22 years and there was a predominance (53%) of women. A liver biopsy was available for 69 patients. Advanced ibrosis (F3-4), more intense activity grade (A2-3) and hepatic steatosis were seen, respectively in 25%, 68% and 65% of patients.
The mean of BMI was 27±3.93 kg/m². Overweight and obesity were seen respectively in 34% and 20% of the patients. The risk for cardiovascular diseases, predicted by WC, was 79% among the patients studied. Anthropometric measures are shown in Table 1.
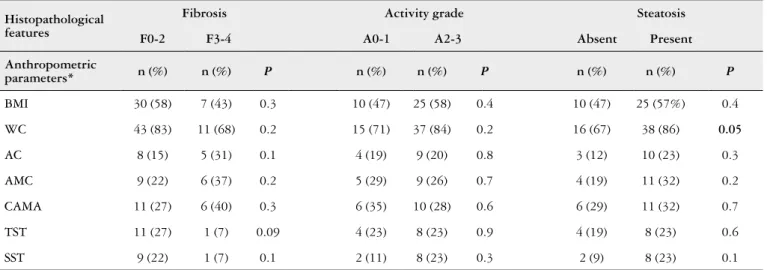
Qualitative analysis of food intake showed that only 41% of the patients presented a healthy intake and 59% an unhealthy intake. Patients were adequate according to intake of lipids (69%), cholesterol (61%) and carbohydrates (71%). However, several patients had an insuficient intake of calo-ries (59%) and excessive intake of protein (36%) and saturated fat (63%). Data regarding food intake are shown in Table 2. Comparative analysis between anthropometric parameters and histological features showed that the only histological variable associated to anthropometric parameters was he-patic steatosis, that was associated to WC (P=0.05) (Table 3). There was no association between qualitative and quantitative food intake with histological parameters (Table 4).
DISCUSSION
Assessment of the nutritional status of candidates for treatment of chronic hepatitis C is important since nutritional factors can inluence disease progression, improve quality of life, and contribute to the response to treatment.
BMI is a parameter commonly used to assess the nutri-tional status of the population. In the present study, most patients with hepatitis C presented excess weight based on this parameter. Similar results have been reported in the study of Berzigotti et al. (2011)(3), in which 40% of the patients were
overweight and 30% were obese.
Some studies suggest triceps and subscapular skinfolds to be more accurate indicators of subcutaneous fat in patients with chronic liver diseases, as well as the use of arm circumference and arm muscular circumference to evaluate
TABLE 2. Food intake parameters of patients with genotype 1 chronic hepatitis C
Nutrients Normal (%)
Insuficient (%)
Excess (%)
Calories (kcal mean/day) 30 59 11
Carbohydrates (%) 71 21 7
Proteins (g/kg) 33 31 36
Lipids (%) 69 4 27
Saturated fat (%) 37 - 63
Monounsaturated fat (%) 99 - 1
Cholesterol (%) 61 - 39
TABLE 1. Characteristics of patients with genotype 1 chronic hepatitis C
Characteristics n=70
Age (years; mean) 49 ± 1
Women (%) 37 (53%)
Anthropometric parameters
BMI (kg/m²); obesity/overweight 34%/20%
Abnormal Waist circumference 79%
Abnormal Arm circumference 20%
Abnormal Triceps skinfold 21%
Abnormal Subscapular skinfold 18%
Abnormal AMC 27%
Abnormal CAMA 30%
Histopathological features
Fibrosis >2 24%
Inlammatory activity ≥2 68%
Steatosis 65%
BMI: body mass index; AMC: arm muscle circumference; CAMA: corrected arm muscle area.
lean mass(14, 17, 19, 29). In fact, the majority of the patients of this
study were normal based on those parameters. A discussion about the best method of evaluation of nutritional aspects in patients with chronic liver disease has been conducted for a long time(16, 20). In patients with decompensated liver disease
cannot differentiate lean mass and fat mass and therefore should not be used alone in a nutritional assessment(10, 33). However,
in the present study no patient presented ascites, which may suggest that BMI was a good measure in this population; but it should not be used alone in a nutritional assessment because it not differentiate lean mass and fat mass(16).
Another measure showing abnormality in this study was waist circumference. Most patients had central obesity and were, therefore, at high risk for cardiovascular diseases ac-cording to WC. Visceral fat is known to be associated with insulin resistance in non-diabetic patients, obesity, type 2 diabetes, and nonalcoholic hepatic steatosis(1). In fact, hepatic
steatosis was observed in the majority of the present patients (65%), and was associated to WC. The association between steatosis and HCV is well deined and it is believed that, in addition to viral factors, metabolic factors play a role in this condition(1, 6, 25, 26). It has been demonstrated that obesity and
steatosis are factors related to lower response to treatment. This is another reason to emphasize the recommendation to control nutritional disorders in hepatits C patients.
With respect to diet quality, food intake was unhealthy in most of the patients studied (59%), with the observation of excessive consumption of saturated fat. Similar indings have been reported in population studies on healthy subjects
(5) and in studies of patients with hepatitis C(8).
Quantitative analysis of food intake showed inadequate consumption of calories, proteins and saturated fat. Yas-utake et al.(39) observed excessive consumption of calories in
72.4% of patients with compensated cirrhosis, in contrast to the present study in which most patients presented deicient calorie intake. On the other hand, a similar intake of calories and lipids as that seen in the present study has been reported by Carreira and Pereira(8) for patients with hepatitis C not
receiving antiviral treatment. These indings suggest that
TABLE 4. Comparison between quality and quantitative food intake parameters and histopathological features
Histopathological features
Fibrosis Inlammatory activity Steatosis
F0-2 F3-4 P A0-1 A2-3 P Absent Present P
Food intake n (%) n (%) n (%) n (%) n (%) n (%)
Calories* 35 (67) 13 (76) 0.4 13 (62) 32 (72) 0.3 18 (75) 29 (66) 0.4
Carbohydrates* 25 (48) 10 (58) 0.4 11 (52) 21 (48) 0.7 14 (58) 20 (45) 0.3
Proteins* 30 (58) 11 (64) 0.6 11 (52) 26 (59) 0.6 16 (66) 24 (54) 0.3
Lipids* 21 (40) 8 (47) 0.6 11 (52) 16 (36) 0.2 7 (29) 21 (47) 0.1
Saturated fat* 36 (69) 8 (47) 0.09 14 (66) 28 (63) 0.8 16 (66) 28 (63) 0.8
Cholesterol* 19 (36) 9 (53) 0.2 9 (43) 16 (36) 0.6 12 (50) 16 (36) 0.2
Unhealthy food intake 33 (63) 8 (50) 0.3 15 (71) 24 (55) 0.1 9 (43) 30 (68) 0.07
* Inadequate intake (excessive plus insuficient).
TABLE 3. Comparison between anthropometric parameters and histopathological features
Histopathological features
Fibrosis Activity grade Steatosis
F0-2 F3-4 A0-1 A2-3 Absent Present
Anthropometric
parameters* n (%) n (%) P n (%) n (%) P n (%) n (%) P
BMI 30 (58) 7 (43) 0.3 10 (47) 25 (58) 0.4 10 (47) 25 (57%) 0.4
WC 43 (83) 11 (68) 0.2 15 (71) 37 (84) 0.2 16 (67) 38 (86) 0.05
AC 8 (15) 5 (31) 0.1 4 (19) 9 (20) 0.8 3 (12) 10 (23) 0.3
AMC 9 (22) 6 (37) 0.2 5 (29) 9 (26) 0.7 4 (19) 11 (32) 0.2
CAMA 11 (27) 6 (40) 0.3 6 (35) 10 (28) 0.6 6 (29) 11 (32) 0.7
TST 11 (27) 1 (7) 0.09 4 (23) 8 (23) 0.9 4 (19) 8 (23) 0.6
SST 9 (22) 1 (7) 0.1 2 (11) 8 (23) 0.3 2 (9) 8 (23) 0.1
Santis e Silva VA, Ferraz MLG, Carvalho-Filho R, Lanzoni VP, Silva AEB, Silva ISS. Associação do estado nutricional com achados histológicos em pacientes com hepatite C genótipo 1. Arq Gastroenterol. 2015,52(4):xxx.
RESUMO-Contexto- Diferentes fatores são responsáveis pela progressão da ibrose na infecção crônica pelo vírus da hepatite C, mas o papel dos fatores nutricionais na progressão da doença não está deinido. Este estudo teve como objetivo avaliar o estado nutricional e o peril dietético de pacientes com hepatite C crônica candidatos a tratamento e sua associação com achados histopatológicos. Métodos- Foi conduzido um estudo transversal em pacientes com hepatite C crônica genótipo 1 virgens de tratamento, entre 2011 e 2013. Foram analisados, antes do tratamento, os seguintes as-pectos: biópsia hepática, medidas antropométricas e análise qualitativa e quantitativa do consumo alimentar. Resultados - Setenta pacientes foram estudados. A maioria dos pacientes apresentava obesidade (34%) ou sobrepeso (20%) de acordo com índice de massa corporal e risco para doenças cardiovasculares de acordo com a circunferência da cintura elevada (79%). Na análise qualitativa do consumo alimentar, 59% apresentavam uma dieta inadequada. Conforme análise quantitativa, 59% tinham consumo insuiciente de calorias, 36% consumo excessivo de proteínas e 63% consumo excessivo de gorduras saturadas. Com relação à histologia, 68% apresentavam grau de atividade inlamatória ≥2, 65% mostraram esteatose hepática e 25% possuíam grau de ibrose >2. Na análise comparativa entre as medidas antropométricas e achados histológicos, somente a circunferência da cintura elevada mostrou associação com esteatose hepática (P=0,05). Não houve associação entre consumo alimentar qualitativo e quantitativo com parâmetros histológicos. Conclusão- A maioria dos pacientes apresentava consumo alimentar inadequado de acordo com parâmetros qualitativos e consumo excessivo de gordura saturada, além de excesso de gordura abdominal, que esteve associada à esteatose hepática. Portanto, aconselhamento nutricional deveria ser implementado em pacientes candidatos a tratamento para hepatite C crônica visando evitar distúrbios nutricionais que podem impactar negativamente no manejo dos pacientes.
DESCRITORES- Cirrose hepática. Hepatite C crônica. Fígado gorduroso. Estado nutricional. Ingestão de alimentos.
eating habits are not adequately controlled in this popula-tion and that effective nutripopula-tion monitoring is necessary to prevent nutritional disorders.
In conclusion, most of the patients with hepatitis C in this study presented inadequate qualitative and quantitative food intake and excess of abdominal fat, which was associated to hepatic steatosis. Therefore, nutritional advisement should be implemented in this population in an attempt to prevent
nutritional disorders and to reduce the accumulation of visceral fat, with a consequent positive inluence on disease progression, quality of life and treatment response.
Authors’ contributions
REFERENCES
1. Adinoli LE, Gambardella M, Andreana A, Tripodi MF, Utili R, Ruggiero G.
Steatosis accelerates the progression of liver damage of chronic hepatitis C pa-tients and correlates with speciic HCV genotype and visceral obesity. Hepatology 2001;33(6):1358-64.
2. Bedossa P, Poynard T. An algorithm for the grading of activity in chronic hepatitis C. The METAVIR Cooperative Study Group. Hepatology 1996; 24(2):289-93.
3. Berzigotti A, Garcia-Tsao G, Bosch J, Grace ND, Burroughs AK, Morillas R,
et al. Obesity is an independent risk factor for clinical descompensation patients with cirrhosis. Hepatology. 2011;54 (2):555-61.
4. Brazilian Institute of Geography and Statistics – [IBGE. Brazilian Survey on
Family Budgets 2002-2003: Per Capita Household Food Acquisition - Brazil and Major Regions]. IBGE. Rio de Janeiro, 2004.
5. Brazilian Institute of Geography and Statistics - IBGE. [Brazilian Survey on
Family Budgets 2008-2009: Per Capita Household Food Acquisition - Brazil and Major Regions]. IBGE. Rio de Janeiro, 2010.
6. Bugianesi E, Salamone F, Negro F. The interaction of metabolic factors with
HCV infection: does it matter? J Hepatol. 2012;56(Suppl 1):S56-65.
7. Campillo B, Richardet JP, Scharman E, Bories PN. Evaluation of nutritional
practice in hospitalized cirrhotic patients: Results of a prospective study. Nutrition. 2003;19(6):515-21.
8. Carreira CM; Pereira PCM. [Nutritional and Dietetic Proile of individuals with
hepatitis C]. Semina Ciências Biológicas e da Saúde. 2011;32(2):143-54.
9. Castelain S, Descamps V, Thibault V, François C, Bonte D, Morel V, et al. Taqman
ampliication system with an internal positive control for HCVRNA quantitation. J Clin Virol. 2004;31(3):227-34.
10. Cervi A, Franceschini SCC, Priore SE. Análise crítica do uso do índice de massa corporal para idosos. Rev. Nutr. 2005;18(6):765-75.
11. Chalasani N, Younossi Z, Lavine JE, Diehl AM, Brunt EM, Cusi K, et al. The diagnosis and management of non-alcoholic fatty liver disease: practice Guideline by the American Association for the Study of Liver Diseases, American College of Gastroenterology, and the American Gastroenterological Association. The American Journal of Gastroenterology. 2012;107:811-26.
12. Fisberg RM, Slater B, Barros RR, Lima FD, Cesar CLG, Carandina L, et al. Healthy Eating Index: evaluation of adapted version and its applicability. Rev Nutr. 2004;17:301-8.
13. Frisancho AR. Anthropometric Standards for the Assessment of Growth and Nutritional Status. Ann Arbor, University of Michigan Press, 1990.
14. Hourigan LF, Macdonald GA, Purdie D , Whitehall VH, Shorthouse C, Clouston A, et al. Fibrosis in chronic hepatitis C correlates signiicantly with body mass index and steatosis. Hepatology. 1999;29:1215–19.
15. Institute of Medicine 2002/2005. Dietary Reference Intakes for Energy, Carbohy-drate, Fiber, Fat, Fatty Acids, Cholesterol, Protein, and Amino Acids. Washington, DC. The National Academies Press. Available from: http://www.nap.edu/ 16. Jesus RP, Nunes ALB, Magalhães LP, Buzzini R; Sociedade Brasileira de Nutrição
Parenteral e Enteral; Colégio Brasileiro de Cirurgiões; Associação Brasileira de Nutrologia. Terapia Nutricional nas Doenças Hepáticas Crônicas e Insuiciência Hepática. In: Sociedade Brasileira de Nutrição Enteral e Parenteral. Projeto Diretrizes, 2011.
17. Kawabe N, Hashimoto S, Harata M, Nitta Y, Murao M, Nakano T, et al. Assess-ment of nutritional status of patients with hepatitis C virus-related liver cirrhosis. Hepatol Res. 2008;38(5):484-90.
18. Lebrão ML, Duarte YAO. Health, well-being and aging. [The SABE Project in São Paulo: an initial approach]. Pan American Health Organization-PAHO/ WHO, Brasilia-DF, 2003.
19. Leitão AV, Castro CL, Basile TM, Souza TH, Braulio VB. [Evaluation of physical capacity and nutritional status in liver transplant candidates]. Rev Assoc Med Bras. 2003;49:424-8.
20. Loguercio C, Sava E, Marmo R, et al: Malnutrition in cirrhotic patients: anthro-pometric measurements as a method of assessing nutritional status. Br J Clin Pract. 1990;44(3):98-101.
21. Marsano L, McClain CJ. Nutrition and alcoholic liver disease. JPEN. 1991;15(3):337-44.
22. National Research Council/ Food and Nutrition Board. Recommended Dietary allowances. 10 ed. Washington, National Academy Press, 1989, p.284. 23. Ortiz V, Berenguer M, Rayón JM, Carrasco D, Berenguer J. Contribution of obesity
to hepatitis C-related ibrosis progression. Am J Gastroenterol. 2002;97(9):2408-14. 24. Paula TP, Peres WAF, Ramalho RA. Estratégias nutricionais em pacientes com doença hepática avançada e candidatos ao transplante hepático. Nutrição Brasil. 2002;1(2):95-9.
25. Pereira LMMB, Martelli CMT, Moreira RC, Mercham-Hamman E, Stein AT, Car-doso MRA, et al. Prevalence and risk factors of Hepatitis C virus infection in Brazil, 2005 through 2009: a cross-sectional study. BMC Infectious Disease. 2013;13:1-12. 26. Shepard CW, Finelli L, Alter MJ. Global epidemiology of hepatitis C virus
infection. Lancet Infect Dis. 2005;5(9):558-67.
27. Slater B, Philippi ST, Marchioni DML, Fisberg RM. Validação de Questionários de Freqüência Alimentar - QFA: considerações metodológicas. Rev Bras Epide-miol. 2003;6(3):200-8.
28. Smith DB, Mellor J, Jarvis LM, Davidson F, Kolberg J, Urdea M, et al. Variation of the hepatitis C virus 5’ non-coding region: implications for secondary structure, virus detection and typing. J Gen Virol. 1995;76(Pt 7):1749-61.
29. Sposito AC, Caramelli B, Fonseca FAH, Bertolami MC, Aiune NA, Souza A, et al. IV Diretriz Sobre Dislipidemias e Prevenção de Aterosclerose: Departamento de Aterosclerose da Sociedade Brasileira de Cardiologia. Arq Bras de Cardiol. 2007;88(Suppl1):2-19.
30. Sy T, Jamal MM. Epidemiology of hepatitis C virus (HCV) infection. Int J Med Sci. 2006;3(2):41-6.
31. [Vigitel Brazil 2013: Surveillance of risk and protective factors for chronic diseases by telephone survey]. Brasilia: Ministry of Health, 2013. Available from: http://portalsaude.saude.gov.br/images/pdf/2014/abril/30/Lancamen-to-Vigitel-28-04-ok.pdf.
32. Wasley A, Alter MJ. Epidemiology of hepatitis C: geographic differ ences and temporal trends. Semin Liver Dis. 2000;20:1-16.
33. Wellens RI, Roche AF, Khamis HJ, Jackson AS, Pollock ML, Siervogel RM. Relationships between the Body Mass Index and body composition. Obes Res. 1996;4(1):35-44.
34. World Health Organization. Obesity: preventing and managing the global epi-demic. Report of World Health Organization, Consultation on Obesity. Geneva: WHO, 1998.
35. World Health Organization. (WHO). Physical Status: the use and interpretation of anthropometry. Technical Report Series. Geneva, Switzerland, 1998, p.854. 36. World Health Organization. Diet, nutrition and the prevention of diseases. Report
of a joint WHO/FAO Expert Consultation. WHO, Geneva, 2003.
37. World Health Organization. Obesity and overweight. Fact sheet N°311. Reviewed May 2014. Available from: http://www.who.int/mediacentre/factsheets/fs311/en/ 38. World Health Organization. Overweight / Obesity: Obesity (body mass index
>30). Data by WHO region. Available from: http://apps.who.int/gho/data/view. main.2480?lang=en
39. Yasutake K, Bekki M, Ichinose M, Ikemoto k, Fujino T, Ryu T, et al. Assessing current nutritional status of patients with HCV-related liver cirrhosis in the compensated stage. Asia Pac J Clin Nutr. 2012;21(3):400-5.