Additional Cardiovascular Risk Factors Associated
with Excess Weigth in Children and Adolescents. The
Belo Horizonte Heart Study
Robespierre Q. C. Ribeiro, Paulo A. Lotufo, Joel A. Lamounier, Reynaldo G. Oliveira,
José Francisco Soares, Denise Aparecida Botter
Universidade de São Paulo e Universidade Federal de Minas Gerais - São Paulo, SP - Minas Gerais, MG - Brazil
Mailing Address: Robespierre Q. C. Ribeiro • Alameda Guilherme Henrique Daniel, 94/302 – 30220-200 – Belo Horizonte, MG - Brazil E-mail: [email protected] or [email protected] Received: 02/17/2005 • Accepted: 04/29/2005
O
BJECTIVETo examine the association of overweight and obesity with physical activity, blood pressure (BP) and serum lipid profi les.
M
ETHODSEpidemiologic investigation of 1,450 students, between the ages of 6 and 18, in the city of Belo Horizonte, MG. Data: weight, height, BP, skinfold thickness, waist circumference, physical activity, total cholesterol (TC), LDL-c, HDL-c, and dietary habits.
R
ESULTSThe prevalence rates for overweight and obesity were 8.4% and 3.1%, respectively. In relation to the students in the lower quartile (Q1) of the distribution of subscapular skinfold, the students in the upper quartile (Q4) presented a 3.7 times higher risk (odds ratio) of having elevated TC levels. Overweight and obese students had a 3.6 times higher risk of having elevated systolic blood pressure, and a 2.7 times higher risk of elevated diastolic blood pressure when compared to normal weight students. The less active students in the Q1 of distribution of MET presented a 3.8 times higher risk of having elevated TC levels compared to those who were more active (Q4).
C
ONCLUSIONStudents who were overweight, obese or in the upper quartiles for other adiposity variables, as well as students with low levels of physical activity or a sedentary lifestyle presented higher blood pressure levels and a lipid profi le indicative of an increased risk of developing atherosclerosis.
K
EY WORDSThe current epidemic of ischemic cardiovascular diseases (CVD) in the developing countries has brought an increased burden for public health in terms of Disability Adjusted Life Years (DALY)1. In Brazil, DCVs account for the highest burden of disease (9.6 DALY) followed by diabetes mellitus (5.1 DALY), both sharing excess weight as a common risk factor2.
Recent and profound lifestyle changes regarding dietary habits characterized by a high intake of saturated fat, hypercaloric beverages and low levels of physical activity resulted in a widespread epidemic of overweight and obesity, and their consequent comorbidities, CVDs and non-insulin-dependent diabetes mellitus (NIDDM)1.
Children are becoming increasingly more vulnerable to excess weight, in a “Junior” version of the global adult obesity epidemic, and they even present with insulin resistance, type 2 diabetes mellitus3 and early onset atherosclerosis4 comprising the manifestations of the metabolic syndrome.
Recent studies have shown a decline in the prevalence of malnutrition and a predominance of excess weight in children and adolescents with signifi cant yearly increase rates of the latter. Wang et al5 verifi ed a three-fold increase in the prevalence of excess weight in Brazil whereas the prevalence of underweight people showed a sharp decline to almost half of previous numbers.
M
ETHODSA school-based epidemiologic cross-sectional study was conducted in the city of Belo Horizonte, State of Minas Gerais, Brazil. Initially, twenty out of the 521 public and private schools of Belo Horizonte were randomized. The second step was to choose two classrooms from each school to compose a sample of 1,450 students to be investigated. The sample size was calculated for the fi rst two stages using the Kish method6, based on the Student’s t-test and pre-specifying the α and β errors as 0.05 and 0.20, respectively.
A Written Consent Form was given to the students. This study was approved by the Research Ethics Committee of UFMG and by the Research Ethics Committee of USP.
All instruments were tested in a previous pilot study conducted at two schools (one public and one private).
The anthropometric measurements included weight, height and central body fat distribution indicators –triceps, subscapula and suprailiac skinfold thickness, and waist and hip measurements. The percentage of body fat was estimated using a Tanita bioelectric impedance scale. Height measurements were taken using a portable aluminum stadiometer, with a tolerance of approximately 0.1 cm, with the students standing without shoes. Body weights were taken with the Tanita scale, with a tolerance of approximately 0.1 kg. and systematically confi rmed after every ten measurements with a OMS portable electronic scale. Skinfold thickness measurements were
recorded to the closest millimeter using Lange skinfold calipers (Cambridge Scientifi c, Cambridge, MA).
Serum levels of total cholesterol (TC), and LDL-c and HDL-c lipoproteins were analyzed by Cobas Mira Plus (Roche Corp.) in accordance with the protocols of the National Cholesterol Education Panel. Since there were no triglyceride serum levels higher than 400 mg/dl, the LDL serum levels were calculated using the Friedewald formula.
Systemic blood pressure (systolic and diastolic) readings were taken in accordance with the recommendations of the American Heart Association7. The mean of the two blood pressure readings was used in the statistical analyses.
The parents or guardians of each child or adolescent under 14 years of age and the students were interviewed using a questionnaire to obtain information regarding demographic aspects, dietary habits, physical and sedentary activities, smoking and family history of early onset CVD.
The energy expenditure, evaluated in kilocalories – MET (metabolic cost or unit of resting metabolic rate) was obtained using a 24-hour record questionnaire of the student’s physical activities, modifi ed from the Spark questionnaire8. For statistical analyses, physical activities were classifi ed in accordance with energy expenditure levels in four intervals or quartiles. In this analysis, only the upper interval or quartile (Q4) and the lower interval or quartile (Q1) were considered in order to obtain a more marked contrast between the most active and the least active students. A qualitative question was also included for the students to compare their daily level of physical activity with their counterparts9.
The questionnaire also evaluated sedentary activities including the number of hours spent watching TV and videos, number of hours spent playing computer games, videogames and handheld computer games and the number of hours spent listening to music (without dancing) for relaxation9.
A quantitative food frequency evaluation questionnaire was prepared based on a North American questionnaire that was prepared for cardiovascular disease screening studies, and developed by Gladys Block et al and organized by Thompson and Byers10 in the Dietary Assessment Resource Manual.
From the scale mentioned above, three levels of nutrition standard were established: adequate (a diet with low lipid levels and a high concentration of fruits and vegetables); inadequate (high fat content and low fruit and vegetable content); very inadequate (very high fat content and very low fruit and vegetable content). The consumption of these foods was evaluated on a weekly and monthly basis using a diet record.
grouped for statistical analysis purposes in an upper level (AB) and a lower level (CDE).
In order to compare our results with those of other studies previously conducted, and following the recommendations for epidemiologic inquiry evaluations for the prevalence of excess weight in children and adolescents, and inference of associations and risk of subsequent comorbidities, overweight was considered as a BMI between the 85th and 94th percentiles, and obesity equal to or higher than the 95th percentile according to age and gender11,12. In the present study, students were considered with “excess weight” when they were either overweight or obese, that is, anyone with a BMI over the 85th percentile. Those considered with a “normal weight” had a BMI between the 5th and 85th percentiles. By defi ning the 85th percentile as the cut-off point for excess weight, overweight – a CVD risk factor12 – was included in the data, and there was a much higher number of overweight students than obese students in the sample.
Blood pressure was considered “high normal” (borderline) when the systolic blood pressure (SBP) or diastolic blood pressure (DBP) was between the 90th and 95th percentiles for the reference population; signifi cant high blood pressure was defi ned as a systolic or diastolic pressure above the 95th percentile, and severe high blood pressure as a systolic or diastolic pressure above the 99th percentile for the reference population, or approximately 10 mmHg above the 95th percentile in accordance with the National High Blood Pressure Education Program Working Group on Hypertension Control in Children and Adolescents13. We considered “blood pressure higher than normal” or “high blood pressure” when the SBP or DBP levels were above the 90th percentile for the reference population.
Statistical Analysis - All significance tests were considered at a level of 0.05 for the type I error, that is, a level of 5% for the hypothesis that each parameter is equal to zero was used to reject the hypothesis whenever the estimated parameter value exceeded the estimated standard error 1.96 times. Initially the analyses were conducted in the Department of Statistics of the Institute of Exact Sciences, Universidade Federal de Minas Gerais, using the statistical analysis program SPSS for Windows (Release 8.0 Chicago, IL, USA). The inferential analysis was conducted in the Institute of Mathematics and Statistics, Universidade de São Paulo14, using the Statistical Analysis Software-SAS (Release 8.02, SAS Institute Inc, Cary, NC, USA).
Risk factors were clustered according to the total of the four risk variables studied, that is, total cholesterol > 200 mg/dl, systolic blood pressure ≥ 90th percentile, diastolic blood pressure (DBP) ≥ 90th percentile, and BMI > 85th percentile.
Univariate analyses for the signifi cance test of the associations were conducted using the Student’s t-test for
continuous variables and the Chi-square test for discrete variables. To evaluate the strength of the association, the odds ratio calculation was used, which in a clinical focus study, such as this one, can be used as a risk proxy for both univariate and multivariate analyses. The adequacy assumptions of the linear model were evaluated graphically and using the Ryan-Joiner test (similar to Shapiro-Wilk) to verify the normality of the model error distribution.
The independent association of predictive variables with elevated blood pressure levels, overweight and obesity were evaluated using the backward stepwise logistic regression, keeping the variables at a maximum descriptive level of 0.01 in the null test of their effect to determine which energy expenditure levels, sedentary activities, dietary habits, social-economic class, excess weight (BMI) and variables indicative of central body fat distribution would be the most predictive of adverse levels of total cholesterol and lipoprotein fractions, and of systolic and diastolic blood pressure. All regression analyses were controlled for various confounding factors including skin color and age.
R
ESULTSFrom the initial 1,450 participants, fi ve were excluded for inconsistent data. From the remaining 1,445 that responded adequately to the questions and had their anthropometrical data collected, 1,382 (95.3%) agreed to have a blood sample drawn. The majority of the participants attended public schools (76%), 53% were female and 47% male, 56% were from the lower social classes (below middle class - CDE), 45% were white, 44.4% were dark skinned and 14.5% were black. For statistical analysis purposes the white and dark skinned participants were grouped together since there were no signifi cant differences between dark skin and the other variables. As such, the skin color variable was defi ned as white and black.
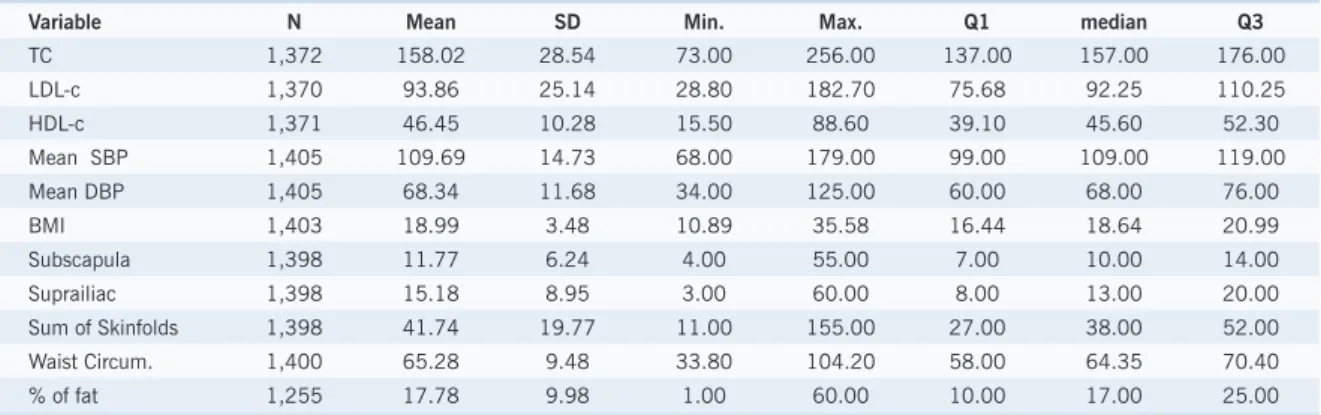
Table 1 shows the mean values, standard deviation (SD), minimum, maximum, median, and lower and upper quartiles of the variables studied.
Tables 2 and 3 show the distribution (mean and standard deviation) of serum lipids, blood pressure, physical and sedentary activities and adiposity variables, according to the demographic characteristics of the participants.
In relation to the ranges classifi ed as “desirable”, “borderline” and “elevated”, one third (32.9%) of these students presented total cholesterol levels higher than the values considered desirable (> 170 mg/dl), and one quarter (25.1%) also presented LDL-c levels higher than the values considered desirable (> 110 mg/dl). In relation to HDL-c, approximately one fi fth (17%) of the students presented values considered as undesirable (Table 4).
NHLBI/NIH (Table 5), once again one third (32.9%) of these students that presented elevated levels of total cholesterol (> 170 mg/dl) were classifi ed in the range of moderate to serious risk to develop atherosclerotic disease in adulthood, as well as close to one third (32.4%) in relation to those with elevated levels of LDL-c (> 105 mg/dl).
The results revealed that 28.1% of the participants spent more than 5.5 hours on sedentary activities, 22.6% presented low levels of physical activity expressed as energy expenditure (located in the lower MET quartile), and 68.5% were described by themselves or their parents/ guardians as less active than their counterparts who were considered much more active (31.5%). Generally speaking, the results show an average of 4 hours per day
spent on sedentary activities; 2.8 hours watching TV and 0.3 hours playing video or computer games. The mean energy expenditure (MET/day) was 627.8.
The majority of the students presented dietary habits characterized by the consumption of high fat foods. In relation to the group of fruits, vegetables and fi bers, 64.8% presented an intake classifi ed as “very inadequate”, 35.0% an inadequate intake and 0.0% reported and adequate intake of these macronutrients. A little more than one quarter (26.7%) ate potato chips or popcorn almost every day (> fi ve days per week), 14.5% three to four days per week and 22.8% one to two days per week. Roughly one quarter (25.9%) ate snack foods almost every day (> fi ve days per week), 18.0% three to four days per week and almost one third (31.5%) one Table 1 – Distribution of the lipid, blood pressure and adiposity variables among the students,
children and adolescents, of Belo Horizonte
Variable N Mean SD Min. Max. Q1 median Q3
TC 1,372 158.02 28.54 73.00 256.00 137.00 157.00 176.00
LDL-c 1,370 93.86 25.14 28.80 182.70 75.68 92.25 110.25
HDL-c 1,371 46.45 10.28 15.50 88.60 39.10 45.60 52.30
Mean SBP 1,405 109.69 14.73 68.00 179.00 99.00 109.00 119.00
Mean DBP 1,405 68.34 11.68 34.00 125.00 60.00 68.00 76.00
BMI 1,403 18.99 3.48 10.89 35.58 16.44 18.64 20.99
Subscapula 1,398 11.77 6.24 4.00 55.00 7.00 10.00 14.00
Suprailiac 1,398 15.18 8.95 3.00 60.00 8.00 13.00 20.00
Sum of Skinfolds 1,398 41.74 19.77 11.00 155.00 27.00 38.00 52.00
Waist Circum. 1,400 65.28 9.48 33.80 104.20 58.00 64.35 70.40
% of fat 1,255 17.78 9.98 1.00 60.00 10.00 17.00 25.00
TC: total cholesterol (mg/dl); LDL-c: low density lipoprotein (mg/dl); HDL-c: high density lipoprotein (mg/dl); SBP: systolic blood pressure (mmHg); DBP: diastolic blood pressure (mmHg); BMI: body mass index; Subscapula: thickness of subscapular skinfold (mm); Suprailiac: thickness of suprailiac skinfold (mm); Sum of skinfolds: the sum of the three skinfold thickness measurements - triceps, subscapular and suprailiac skinfolds (mm); % of fat: percentage of body fat
Table 2 – Mean values of the distribution of lipids, blood pressure, BMI, central body fat, physical and sedentary activities according to gender, age group and skin color
Variable Gender Age Group Skin Color
Male Female α Child Adolescent α White Black α
TC 154±1 162±1 S 164±1 154±1 S 160±1 150±2 S
LDL-c 90±1 97±1 S 100±1 90±1 S 95±1 89±2 S
HDL-c 45±0.4 47±0.4 S 47±0.4 47±0.4 NS 47±0.4 45±0.7 S
SBP 111±1 109±1 S 105±0.5 113±0.5 S 109±0.6 113±1 S
DBP 68±0.5 69±0.5 NS 66±0.4 70±0.4 S 68±0.5 70±1 S
BMI 19±0.1 19±0.1 NS 17±0.1 20±0.1 S 19±0.1 19±0.3 NS
Subscapula 10±0.2 13±0.2 S 10±0.2 13±0.2 S 12±0.2 12±0.4 NS
Suprailiac 13±0.3 17±0.3 S 13±0.3 17±0.3 S 15±0.4 15±0.7 NS
% of fat 10±0.3 23±0.3 S 14±0.4 20±0.4 S 18±0.4 17±0.8 NS
WHR 0.8±0.003 0.7±0.004 S 0.8±0.003 0.7±0.004 S 0.8±0.006 0.8±0.003 NS
MET 708±26 555±22 S 759±28 540±21 S 621±19 720±50 S
Sedentary 4±0.1 4±0.1 NS 3±0.1 4±0.1 S 4±0.2 4±0.1 NS
TV/Video 3±0.1 3±0.1 NS 3±0.1 3±0.1 NS 3±0.1 3±0.1 NS
to two days per week. More than one third (37.5%) ate French fries one to two days per week, 17.9% three to four days per week and 14.3% almost every day (> fi ve days per week). A little more than one half (58.3%) ate candies and chewing gum almost every day (> fi ve days per week), 14.7% three to four days per week and 13.7%
one to two days per week. Roughly one third (32.9%) drank regular soft drinks almost every day (> fi ve days per week), and another third (32.8%) one to two days per week, while one fi fth (21.0%) three to four days per week and the majority (86.6%) at least once a week. Almost one half (48.0%) ate fruits and vegetables every Table 3 – Mean values of the distribution of lipids, blood pressure, BMI, central body fat, physical and
sedentary activities according to social-economic level and type of school
Variable Social-Economic Level Type of School
AB CDE α Private Public α
TC 164±1 154±1 S 165±1 156±29 S
LDL-c 97±1 92±1 S 96±1 93±25 NS
HDL-c 49±0.4 45±0.4 S 50±0.4 45±10 S
SBP 110±0.6 110±0.7 NS 108±0.7 110±0.5 S
DBP 68±0.5 68±0.4 NS 67±0.6 69±0.4 NS
BMI 19±0.1 19±0.1 NS 20±0.2 19±0.1 S
Subscapula 12±0.2 12±0.2 NS 11±0.3 12±0.2 NS
Suprailiac 16±0.3 14±0.3 S 16±0.4 15±0.3 S
% of fat 18±0.4 18±0.4 NS 18±0.5 18±0.3 NS
WHR 0.8±0.004 0.8±0.003 NS 0.8±0.005 0.8±0.003 NS
MET 544±25 693±23 S 492±31 673±20 S
Sedentary 4±0.1 4±0.1 NS 4±0.2 4±0.1 NS
TV/Video 2.6±0.1 2.8±0.1 S 2±0.1 3±2 NS
TC: total cholesterol (mg/dl); LDL-c: low density lipoprotein (mg/dl); HDL-c: high density lipoprotein (mg/dl); SBP: systolic blood pressure (mmHg); DBP: diastolic blood pressure (mmHg); BMI: body mass index; Subscapula: thickness of the subscapular skinfold (mm); Suprailiac: thickness of the suprailiac skinfold (mm); % of fat: percentage of body fat; WHR: waist hip ratio; MET: unit of resting metabolic rate; Sedentary: hours/day spent on sedentary activities; TV/Video: hours/day spent watching TV and/or videos
Table 4 – Distribution of total cholesterol serum levels and lipoprotein fractions according to the clinical cut-points (*)
Lipids Desirable Borderline Elevated
Reference Values (mg/dl)
Sample Distribution (%)
Reference Values (mg/dl)
Sample Distribution (%)
Reference Values (mg/dl)
Sample Distribution (%)
Total
Cholesterol < 170
921
(67.1) 170-199
351
(25.6) ≥ 200
100 (7.3)
LDL-cholesterol < 110 1022
(74.6) 110 -129
244
(17.8) ≥ 130
100 (7.3)
HDL- cholesterol
< 10 years: > 40 10-19 years: > 35
1138 (83.0)
(*) These cut-points were determined by consensus and guidelines: Brazilian Cardiologist Society (<http://www.cardiol.br/>), National Heart, Lung, and Blood Institute (<http://www.nhlbi.nih.gov/health/prof/heart/index.htm>)
Table 5 – Distribution of total cholesterol serum levels and lipoprotein fractions in accordance with the risk scale (*) to develop atherosclerotic disease in adulthood
Level of Risk to Develop Atherosclerosis
Slight Risk Moderate Risk Serious Risk
Lipids Reference
Values (mg/dl)
Sample Distribution (%)
Reference Values (mg/dl)
Sample Distribution (%)
Reference Values (mg/dl)
Sample Distribution (%)
Total Cholesterol 155 to 169 273.0
(19.9) 170 to 184
215.0
(15.7) ≥ 185
236 (17.2)
LDL-cholesterol 95 to 104 189.0
(13.8) 105 to 119
242.0
(17.7) ≥ 120
201.0 (14.7)
day, 22.8% two to three days per week and 11.1% four to six days per week.
Prevalence rates were 8.4% for overweight, 3.1% for obesity, and 11.5% for excess weight (BMI > 85th percentile).
Participants with a regular intake of very high-fat foods and very low levels of fruits, vegetables and fi bers did not present any signifi cant differences when compared to those with intakes of high-fat foods and low levels of fruits, vegetables and fi bers in relation to low levels of HDL-c, elevated levels of total cholesterol and LDL-c, elevated systolic or diastolic blood pressure and central body fat distribution variables, except the subgroups of subscapular and suprailiac skinfold thickness measurements in children. (Table 6).
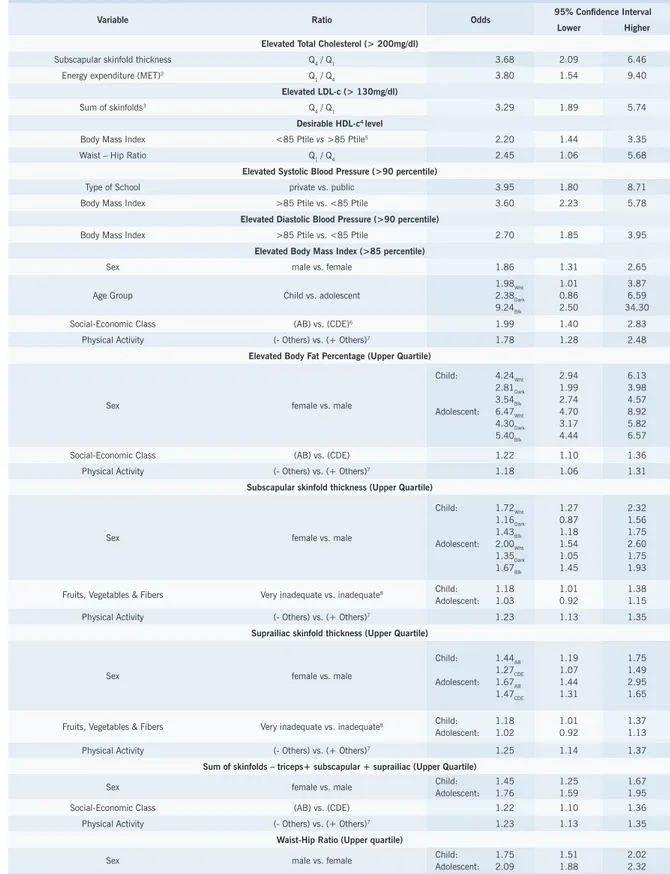
The chance of a student with a physical activity level located in the 1st interval or lower quartile – Q1 of the calorie expenditure distribution and also classifi ed as “less active” (calorie expenditure < 100 MET/day) to have high cholesterol (>200 mg/dl) is 3.80 times higher than the chance of another student classifi ed as “more active” located in the upper quartile – Q4 (calorie expenditure > 964 MET/day) (Table 6). A student located in the 4th interval (upper quartile – Q4) of the subscapular skinfold thickness distribution classifi ed in quartiles has 3.68 times more chances to have high cholesterol than another student located in the 1st interval (lower quartile – Q1) of this skinfold (Table 6). In relation to LDL-c, the chance of a student with central body fat distribution, that is, located in the 4th interval (upper quartile – Q4) of the “sum of skinfold thickness measurements”, to have elevated levels of LDL-c (>130 mg/dl) is 3.29 times higher than the chance of another student located in the 1st interval for this variable (Table 6). In regard to HDL-c, the chance of a student with a BMI value lower than the 85th percentile to have “desirable levels of HDL-c” is 2.20 times higher than the chance of another student with excess weight (> 85th percentile) (Table 6). Further, the chance of a student located in the 1st interval of the “waist – hip ratio” classifi ed in quartiles to have “desirable levels of HDL-c” is 2.45 times higher than the chance of another student located in the 4th interval of this quotient when both are in the last interval of the sum of skinfold measurements (Table 6).
Students with excess weight (BMI > 85th percentile) presented 3.60 times more chances to have high systolic blood pressure and 2.70 times more chances to have high diastolic blood pressure (> 90th percentile) (Table 4). Also, students enrolled in public schools presented 3.95 times more chances to have a systolic blood pressure above the 90th percentile than those enrolled in private schools (Table 6).
Students with “excess weight” presented 1.99 times more chances to be located in the higher social-economic classes (AB) than those with a BMI < 85th percentile;
1.86 times more chances to be male and 1.78 times more chances to be “less active than the others” when compared with females and those that are considered to be “more active than the others”. However, the age group (child) only had a signifi cant association with “excess weight” when the skin color variable was included in the regression model (Table 6).
There were more female students from the higher social-economic classes (AB) with a body fat percentage in the upper quartile (Q4) of their distribution than male students. Compared to a student that is “more active than the others”, the less active was estimated to have 1.18 times more chances to be in the upper quartile of the distribution of the percentage of body fat (Table 6).
With the exception of dark skinned children, more female students were located in the upper quartile of the distribution of subscapular skinfold thickness than male students. Children with dietary habits classifi ed as “very inadequate consumption of fruits, vegetables and fi bers” presented 1.18 times more chances to present subscapular skinfold thickness values in the upper quartile of their distribution compared to those that presented an “inadequate intake”. Students considered “less active than the others” presented 1.23 times more chances to be located in the upper quartile of the distribution of this skinfold than those who are more active (Table 6).
Once again, more female students were found to have suprailiac skinfold thickness measurements in the upper quartile of their distribution than male students. Children with a diet classifi ed as “very inadequate intake of fruits, vegetables and fi bers” presented 1.18 times more chances to present suprailiac skinfold thickness values in the upper quartile of their distribution compared to those who presented an “inadequate intake.” Participants who were “less active than the others” presented 1.25 times more chances to be located in the upper quartile of the distribution of this skinfold than those who were more active (Table 6).
Participants from the social-economic group AB had 1.22 times more chances to present values of the sum of the three skinfold measurements studied located in the upper quartile of their distribution than those from the lower social-economic classes (groups CDE). Consistent with the other variables indicative of central body fat distribution, participants who were “less active than the others” presented 1.23 times more chances to be located in the upper quartile of the distribution of this variable than those who were more active. The female participants also presented higher values for this variable than the males (Table 6).
Table 6 – Odds ratio (logistic regression) for cardiovascular risk factors1 in children and adolescents
Variable Ratio Odds 95% Confi dence Interval
Lower Higher
Elevated Total Cholesterol (> 200mg/dl)
Subscapular skinfold thickness Q4 / Q1 3.68 2.09 6.46
Energy expenditure (MET)2 Q
1 / Q4 3.80 1.54 9.40 Elevated LDL-c (> 130mg/dl)
Sum of skinfolds3 Q
4 / Q1 3.29 1.89 5.74 Desirable HDL-c4 level
Body Mass Index <85 Ptile vs >85 Ptile5 2.20 1.44 3.35
Waist – Hip Ratio Q1 / Q4 2.45 1.06 5.68 Elevated Systolic Blood Pressure (>90 percentile)
Type of School private vs.public 3.95 1.80 8.71 Body Mass Index >85 Ptile vs.<85 Ptile 3.60 2.23 5.78
Elevated Diastolic Blood Pressure (>90 percentile)
Body Mass Index >85 Ptile vs. <85 Ptile 2.70 1.85 3.95
Elevated Body Mass Index (>85 percentile)
Sex male vs. female 1.86 1.31 2.65
Age Group Child vs.adolescent
1.98Wht
2.38Dark
9.24Blk
1.01 0.86 2.50
3.87 6.59 34.30 Social-Economic Class (AB) vs. (CDE)6 1.99 1.40 2.83
Physical Activity (- Others) vs. (+ Others)7 1.78 1.28 2.48 Elevated Body Fat Percentage (Upper Quartile)
Sex female vs.male
Child: 4.24Wht
2.81Dark
3.54Blk
Adolescent: 6.47Wht
4.30Dark
5.40Blk
2.94 1.99 2.74 4.70 3.17 4.44
6.13 3.98 4.57 8.92 5.82 6.57 Social-Economic Class (AB) vs. (CDE) 1.22 1.10 1.36 Physical Activity (- Others) vs. (+ Others)7 1.18 1.06 1.31
Subscapular skinfold thickness (Upper Quartile)
Sex female vs.male
Child: 1.72Wht
1.16Dark
1.43Blk
Adolescent: 2.00Wht
1.35Dark
1.67Blk
1.27 0.87 1.18 1.54 1.05 1.45
2.32 1.56 1.75 2.60 1.75 1.93
Fruits, Vegetables & Fibers Very inadequate vs. inadequate8 Child: 1.18
Adolescent: 1.03
1.01 0.92
1.38 1.15 Physical Activity (- Others) vs. (+ Others)7 1.23 1.13 1.35
Suprailiac skinfold thickness (Upper Quartile)
Sex female vs. male
Child: 1.44AB
1.27CDE
Adolescent: 1.67AB
1.47CDE
1.19 1.07 1.44 1.31
1.75 1.49 2.95 1.65
Fruits, Vegetables & Fibers Very inadequate vs. inadequate8 Child: 1.18
Adolescent: 1.02
1.01 0.92
1.37 1.13 Physical Activity (- Others) vs. (+ Others)7 1.25 1.14 1.37
Sum of skinfolds – triceps+ subscapular + suprailiac (Upper Quartile)
Sex female vs. male Child: 1.45 Adolescent: 1.76
1.25 1.59
1.67 1.95 Social-Economic Class (AB) vs. (CDE) 1.22 1.10 1.36 Physical Activity (- Others) vs. (+ Others)7 1.23 1.13 1.35
Waist-Hip Ratio (Upper quartile)
Sex male vs. female Child: 1.75 Adolescent: 2.09
1.51 1.88
2.02 2.32
sedentary activity variables (Table 6).
No signifi cant differences were observed in a multivariate analysis between the groups for other variables.
D
ISCUSSIONConsistent with other studies, we found higher serum lipid levels in the female participants15,16 with an increase roughly between the ages of nine and eleven. However, unlike other studies15, we found that the white students had higher levels of TC, LDL-c, and HDL-c than the black students. Higher levels of serum lipids, overweight, obesity and central body fat distribution were found among the students from the upper social-economic classes and enrolled in private schools, as frequently occurs in countries in epidemiological transition.
When compared with the results of the Lipid Research Study16, there was a wide discrepancy in the positive and negative values for the mean values of serum lipids which in most cases was not statistically signifi cant. Despite the presence of a lipid profi le that is harmful to health and similar to and at times even more alarming than that of the North American population regarding the fi gures found for risk of development of atherosclerotic disease, these fi gures are still lower than those reported in the cities of New York and Bogalusa, with fi gures of slight risk between 28% and 33%, moderate risk between 17% and 22%, and serious risk between 20% and 30%17.
For the comparison of results, we chose the studies conducted in the cities of Rio Acima – MG18 and Bento Gonçalves – RS19, because their methodology was similar to ours. Using identical design and methodology, we replicated the Belo Horizonte Heart Study in the city of Florianópolis – SC20,21, thus facilitating the comparison of the results found in Florianópolis with those of the main study from Belo Horizonte.
In regard to the prevalence of elevated levels of cholesterol and lipoprotein fractions, the students from Belo Horizonte presented lower rates of elevated levels of total cholesterol and LDL-c than those found in the cities of Rio Acima18, Bento Gonçalves19 and Florianópolis20,21, and higher rates of undesirable levels of HDL-c than those of Bento Gonçalves19 and Florianópolis20,21.
After adjustment for other variables, signifi cant odds ratio were found for desirable HDL-c levels in individuals with “normal weight”, similar to the results of the Bogalusa Heart Study22. Also, as described in this North American cohort22, an inverse relation between desired HDL-c levels and the WHR was demonstrated in this Brazilian study (Table 6).
In agreement with other population studies23, we did not fi nd signifi cant differences in the diastolic blood pressure readings for males and females, but adolescents presented significantly higher values in relation to children and blacks in relation to whites. Signifi cant differences were found between the values of elevated
systolic blood pressure for black male adolescents when compared to white female children and public school students, however, no difference was found for social-economic classes (Table 3). In the present sample, 12% of the students presented higher than normal blood pressure readings (systolic and/or diastolic > 90th percentile). This prevalence of high blood pressure was lower than that found in another Brazilian sample by Perone et al (15%)24 and the same as found in the city of Florianópolis (12%)20,21.
As was expected, and similar to the results found by Nielsen et al25 (OR=3.99), our students with “excess weight” (BMI > 85th percentile) presented more chances to have elevated (> 90th percentile) systolic or diastolic blood pressure than those with “normal weight” (BMI < 85th percentile) (Table 6). The public school students presented more chances to have high systolic blood pressure than those enrolled in private schools, whereas no signifi cant differences were observed between the extreme quartiles of the distribution of adiposity and high blood pressure variables (Table 6). This odds ratio was higher than those found by Styne (2.40)26 and close to that verifi ed for systolic blood pressure levels in developing countries (4.00)27.
Our prevalence rates for overweight (8.4%), obesity (3.1%) and excess weight were lower than the rates for Brazil as a whole, several countries in Latin America, and the United States28,29. Data collected from another source one year before our study and representative of Brazil also showed the same prevalence for overweight, but higher rates for obesity and excess weight30. In Florianópolis, found higher prevalence rates for overweight, obesity, and excess weight were found in a sample of 1,050 students between the ages of six and eighteen20,21. Compared to another study conducted fi ve years earlier with students between the ages of six and eighteen in Belo Horizonte31, with the same design and methodology and researchers as this study, our results indicate a clear 13% increase trend during this period in the rates for overweight and obesity in this population group.
As was expected, participants with excess weight and those with central body fat presented higher systolic and diastolic blood pressure readings than those with “normal weight” and no central body fat (Table 6). The lack of a signifi cant association between WHR and the majority of the variables studied could be explained by a larger increase in the shoulder circumference compared to abdominal circumference during the growth cycle.
than those from the higher classes (Tables 2 and 3). There were more participants in this study that spent long periods of time on sedentary activities (28% > 5.5 hr/day) than recorded for the world population (17% > fi fteen years of age)32, less than in the Brazilian population as a whole (50%-79% > twelve years of age) but similar to the adolescent subgroup of the Brazilian population (76% > 5.5 hr/day)33,34. Compared to North Americans (3.5 hr/day)35 and another Brazilian sample (5 hr/day),36 our students, including the adolescents, spent less time watching television (2.8 hr/day). The results from the study arm conducted in the state of Santa Catarina20,21 showed a higher percentage of students with little physical activity (very low levels of calorie expenditure, MET/day = 40%) compared to those in Belo Horizonte (lower quartile calorie expenditure, MET/day = 22.8%).
Both the comparative scale of physical activity and energy expenditure levels indicated low levels of these variables and were more frequently found in those with excess weight than those with “normal weight”. Similar to the fi ndings of other authors25, we found signifi cant odds ratios for excess weight (BMI > 85th percentile) and increased skinfold thickness measurements for low levels of physical activity (Table 4). In agreement with Kemper et al37 (OR = 0.81), we found that physical activity has a protective effect against excess weight (OR = 0.61). Unlike other studies38, our students with excess weight did not spend more hours watching television than those with normal weight levels.
Our fi ndings were similar to those in Florianópolis regarding the consumption of foods affecting cardiovascular health. Thus, while 88.4% of the Belo Horizonte students consumed foods high in saturated fat and not one participant reported an adequate intake of fruits, vegetables and fi bers, these values in Florianópolis were 79% and 0.3%20,21. In Dennison et al’s study39, just as in the present study, participants with excess weight did not present higher energy intake than their controls.
Consistent with other studies39, we found that partici-pants with excess weight ate fruits, vegetables and fi bers more frequently than those with normal weight levels or underweight. It is possible that the participants with excess weight and their parents exaggerated when reporting fruit and vegetable intake and under reported
the intake of high fat foods due to the concepts of “healthy and unhealthy foods” that are promoted by various media and health professionals.
As reported in other studies, we identifi ed among the students a cluster of risk factors for developing metabolic syndrome40. We verifi ed that practically one in every fi ve participants (19.3%) presented a cluster of four cardiovascular risk factors in the same individual: elevated total cholesterol levels (> 200 mg/dl), BMI > 85th percentile, systolic blood pressure > 90th percentile, diastolic blood pressure > 90th percentile.
The lack of a signifi cant association between dietary habits and other variables could be partially due to attenuation caused by the low accuracy of data regarding dietary habits and physical activity.
C
ONCLUSIONSThe majority of the students presented dietary habits considered harmful to health, characterized by the consumption of alarming quantities of junk food, foods with high levels of saturated fat and low fruit, vegetable and fi ber intakes. Many students presented very low levels of physical activity, long periods of time spent on sedentary activities, mainly watching television and more than half of the participants in the sample were individuals considered “much less active than the others.” We found a disturbing rate of “excess weight” and central body fat distribution, which together with patterns of low levels of physical activity/ a sedentary lifestyle were associated with high blood pressure, elevated levels of total cholesterol and LDL-c as well as low HDL-c levels.
Acknowledgements
This study was conducted with resources from the Post-Graduation Department of Faculdade de Medicina da UFMG, the National Research Board – CNPq and the Research Assistance Foundation of the State of Minas Gerais – FAPEMIG.
Potencial Confl ict of Interest
No potential confl ict of interest relevant to this article was reported.
R
EFERENCES1. WHO -The world health report 2003 – Shaping the future. Neglected global epidemics: three growing threats. Geneva: World Health Organization; 2003.
2. Schramm JM, Valente JG, Leite CI, et al. Perfi l epidemiológico segundo os resultados do Estudo de Carga de Doença no Brasil. In Saúde no Brasil – Contribuições para a Agenda Nacional de Prioridades de Pesquisa. Brasília: Ministério da Saúde; 2004.
3. International Obesity Task Force - IOTF. Childhood obesity Disponível em: <http://www.iotf.org/childhood/index.htm>. Acesso em 12/11/2002.
4. Mahoney LT, Burns TL, Stanford W. Coronary risk factors measured in childhood and young adult life are associated with coronary artery calcifi cation in young adults: the Muscatine study. J Am Coil Cardiol.
1996; 27: 277-84.
5. Wang Y, Monteiro C, Popkin BM. Trends of obesity and underweight in older children and adolescents in the United States, Brasil, China, and Rússia. Am J Clin Nutr. 2002; 75: 971-7.
6. Kish L. Survey Sampling. New York: John Wiley & Sons; 1965.
7. Frolich ED, Grim C, Labarthe DR, Maxwell MH, Perloff D, Weidman WH. Recommendations for human blood pressure determinations by sphygmomanometers: report of a Special Task Force Appointed by the Steering Committee. American Heart Association Hypertension. 1988; 11: 209A-222A.
grade students. Res Quartely Exerc Sport. 1993; 64: 25-31.
9. Ross JG. National children and youth fi tness study I & II. Med Sci Sports Exerc. 1997; 29: S170-S189.
10. Thompson FE, Byers T. Dietary assessment resource manual. J Nutr. 1994; 124: 2296S-2298S.
11. Center for Disease Control and Prevention – CDC. National Center for Chronic Disease Prevention and Health Promotion – Nutrition and Physical Activity. Body mass index-for-age (children). Disponível em: <http://www.cdc.gov/nccdphp/dnpa/bmi-for-age.htm> Acesso em: 21/5/1999.
12. Kiess W, Galler A, Reich A, et al. Clinical aspects of obesity in childhood and adolescence. Obesity Reviews. 2001; 2: 29-36.
13. National High Blood Pressure Education Program Working Group on Hypertension Control in Children and Adolescents. Update on the 1987 Task Force Report on high blood pressure in children and adolescents: a Working Group Report from the National High Blood Pressure Education Program. Pediatrics. 1996; 98: 649-58.
14. Botter DA, Sandoval MC, Auricchio CA, Sznelwar M. Relatório de análise estatística sobre o projeto: “Fatores de risco cardiovascular em crianças e adolescentes no sudeste do Brasil”. São Paulo, IME – USP, 2002 (RAE – CEA – 02P04).
15. Berenson GS, Srinivasan SR, Webber LS, et al. Cardiovascular risk in early life: the Bogalusa Heart Study - Current concepts. Upjohn Company, Kalamazoo, Michigan 1991; 49001: 1-80.
16. Lipid Research Clinics Program. The prevalence study. In The Lipid Research Clinics Population Studies Data Book, Vol. l. Bethesda, MD: US Department of Health and Human Services, Government printing Offi ce, 1980; National Institutes of Health Publication n.80-1527: 1-136.
17. Wynder, EL (ed.) An American Health Foundation Monograph - Coronary Artery Disease Prevention: Cholesterol: a Pediatric Perspective. Prev Méd. 1989; 18: 323-409.
18. Diamante R. Níveis de colesterol total e sua relação com alguns indicadores de saúde, variáveis socioeconômicas, alimentares e antropométricas na população escolar do município de Rio Acima (região metropolitana de Belo Horizonte) - Minas Gerais. Belo Horizonte, 1996, 116p. Dissertação (Mestrado em Pediatria) – Faculdade de Medicina da Universidade Federal de Minas Gerais.
19. Gerber ZRS, Zielinsky P. Fatores de risco de aterosclerose na infância. Um estudo epidemiológico. Arq Bras Cardol. 1997; 69: 231-6.
20. Giuliano ICB, Coutinho MSSA, Pires MMS, et al. Lípides séricos em crianças e adolescentes da rede escolar de Florianópolis – SC. Arq Bras Cardiol. 2003; 81 (supl. III): 97.
21. Giuliano ICB. Lípides séricos em crianças e adolescentes da rede escolar de Florianópolis – SC. Florianópolis, 2003, 93p. Dissertação (Mestrado) – Faculdade de Medicina da Universidade Federal de Santa Catarina.
22. Freedman DS, Serdula MK, Srinivasan SR, et al. Relation of circunferences and skinfold thicknesses to lipid and insulin concentrations in children and adolescents: the Bogalusa Heart Study. Am J Clin Nutr. 1999; 69: 308-17.
23. NHANES – National Health and Nutrition Examination Survey. Disponível em: <www.cdc.gov/nchs/nhanes.htm> Acesso em: 14/9/2004.
24. Perone HC, Follador AN, Toporovsky J. Prevalência de hipertensão arterial na infância (população de baixo poder aquisitivo, ex-favelados). Resumos do XIII Congresso Brasileiro de Nefrologia. 1986, Belo Horizonte, Brazil.
25. Nielsen GA, Lars B, Anderson O. The association between high blood pressure, physical fitness, and body mass index in adolescents. Preventive Medicine. 2003; 36: 229-34.
26. Styne DM. Childhood and adolescent obesity – Prevalence and signifi cance. Ped Clin North Am 2001;48. Disponível em: <http:// www.mdconsult.com>. Acesso em: 4/12/2002.
27. Colditz GA, Mariani A. The cost of obesity and sedentarism in the United States. In: Bouchard C (ed). Physical Activity and Obesity. Champaign, IL: Human Kinetics Publishers, Inc.; 2000: 63-75.
28. Filosof C, Gonzales C, Sereday M, et al. Obesity prevalence trends in Latin-American countries. Obesity Reviews. 2000; 99-106.
29. Ogden CL, Flegal KM, Carrol MD, Johnson CL. Prevalence and trends in overweight among US children and adolescents, 1999-2000. JAMA. 2002; 288: 1728-32.
30. Abrantes MM, Lamounier JA, Colosimo EA. Overweight and obesity prevalence among children and adolescents from Northeast and Southeast regions of Brazil. Rev Assoc Med Bras. 2003; 49: 162-6.
31. Oliveira ADB. Aspectos epidemiológicos da obesidade em escolares. Belo Horizonte, 2000, 124p. Dissertação (Mestrado) – Faculdade de Medicina da Universidade Federal de Minas Gerais.
32. WHO – The World Health Report 2002 “Reducing risks, promoting health life”. Disponível em: <http://www.who.int/mediacenter/events/ whr2002/en/> Acesso: 22/9/2004.
33. Brasil. Ministério da Saúde. Secretaria de Políticas de Saúde. Departamento de Ações Programáticas Estratégicas. Plano de reorganização da atenção à hipertensão arterial e ao diabetes mellitus: hipertensão arterial e diabetes mellitus. Brasília, 2001.
34. Rabelo LM, Viana RM, Schimith MA, et al. Fatores de risco para doença aterosclerótica em estudantes de uma universidade privada em São Paulo Brasil. Arq Bras Cardiol. 1999; 72: 569-74.
35. Robinson TN. Television viewing and childhood obesity. Pediatr Clin North Am. 2001; 48: 1017-25.
36. Almeida SS, Nascimento PCBD, Quaioti TCB. Quantidade e qualidade de produtos alimentícios anunciados na televisão brasileira. Rev Saúde Pública. 2002; 36: 353-5.
37. Kemper HC, Post GB, Twisk JW, et al. Lifestyle and obesity in adolescence and young adulthood: results from the Amsterdam Growth and Health Longitudinal Study (AGAHLS). Int J Obes Relat Metab Disord. 1999; 23(suppl. 3): S34-S40.
38. Andersen RE, Crespo CJ, Bartlett SJ, Cheskin LJ, Pratt M. Relationship of physical activity and television watching with body weight and level of fatness among children: results from the Third National Health and Nutrition Examination Survey. JAMA. 1998; 279: 938-42.
39. Dennison BA, Rockwell HL, Baker SL. Excess fruit juice consumption by preschool-aged children is associated with short stature and obesity. Pediatrics. 1997; 99: 15-22.