CT densitovolumetry in children with obliterative
bronchiolitis: correlation with clinical scores and
pulmonary function test results*
,**
Densitovolumetria pulmonar por TC em crianças com bronquiolite obliterante: correlação com escores clínicos e testes de função pulmonarHelena Mocelin, Gilberto Bueno, Klaus Irion, Edson Marchiori, Edgar Sarria, Guilherme Watte, Bruno Hochhegger
Abstract
Objective: To determine whether air trapping (expressed as the percentage of air trapping relative to total lung volume [AT%]) correlates with clinical and functional parameters in children with obliterative bronchiolitis (OB). Methods: CT scans of 19 children with OB were post-processed for AT% quantification with the use of a fixed threshold of −950 HU (AT%950) and of thresholds selected with the aid of density masks (AT%DM). Patients were divided into three groups by AT% severity. We examined AT% correlations with oxygen saturation (SO2) at rest, six-minute walk distance (6MWD), minimum SO2 during the six-minute walk test (6MWT_SO2), FVC, FEV1, FEV1/FVC, and clinical parameters. Results: The 6MWD was longer in the patients with larger normal lung volumes (r = 0.53). We found that AT%950 showed significant correlations (before and after the exclusion of outliers, respectively) with the clinical score (r = 0.72; 0.80), FVC (r = 0.24; 0.59), FEV1 (r = −0.58; −0.67), and FEV1/FVC (r = −0.53; r = −0.62), as did AT%DM with the clinical score (r = 0.58; r = 0.63), SO2 at rest (r = −0.40; r = −0.61), 6MWT_SO2 (r = −0.24; r = −0.55), FVC (r = −0.44; r = −0.80), FEV1 (r = −0.65; r = −0.71), and FEV1/ FVC (r = −0.41; r = −0.52). Conclusions: Our results show that AT% correlates significantly with clinical scores and pulmonary function test results in children with OB.
Keywords: Multidetector computed tomography; Respiratory function tests; Bronchiolitis obliterans.
Resumo
Objetivo: Determinar as correlações entre o volume de aprisionamento aéreo em relação ao volume pulmonar total (AA%) e parâmetros clínicos e funcionais em crianças com bronquiolite obliterante (BO). Métodos: Técnicas de pós-processamento de imagem foram usadas em imagens de TC de 19 crianças com BO para quantificar AA% por meio de um limiar fixo de −950 UH (AA%950) e de limiares selecionados por meio de máscaras de densidade (AA%MD). Os pacientes foram divididos em três grupos, de acordo com a gravidade de AA%. Foram examinadas as correlações entre AA% e a saturação de oxigênio (SO2) em repouso, a distância percorrida no teste de caminhada de seis minutos (DTC6), a SO2 mínima durante o teste de caminhada de seis minutos (SO2_TC6), a CVF, o VEF1, a relação VEF1/CVF e parâmetros clínicos. Resultados: A DTC6 foi maior nos pacientes com maiores volumes pulmonares normais (r = 0,53). Na amostra como um todo, encontramos (antes e depois da exclusão de valores extremos, respectivamente), correlações estatisticamente significativas entre AA%950 e o escore clínico (r = 0,72; 0,80), a CVF (r = 0,24; 0,59), o VEF1 (r = −0,58; −0,67) e a relação VEF1/CVF (r = −0,53; r = −0,62), bem como entre AA%MD e o escore clínico (r = 0,58; r = 0,63), a SO2 em repouso (r = −0,40; r = −0,61), a SO2_TC6 (r = −0,24; r = −0,55), a CVF (r = −0,44; r = −0,80), o VEF1 (r = −0,65; r = −0,71) e a relação VEF1/CVF (r = −0,41; r = −0,52). Conclusões: Os resultados deste estudo mostram que AA% correlaciona-se significativamente com escores clínicos e testes de função pulmonar em crianças com BO. Descritores: Tomografia computadorizada multidetectores; Testes de função respiratória; Bronquiolite obliterante.
*Study carried out at the Santa Casa Sisters of Mercy Hospital Complex in Porto Alegre and at the Federal University of Health Sciences of Porto Alegre Medical Imaging Research Laboratory, Porto Alegre, Brazil.
Correspondence to: Bruno Hochhegger. Rua 24 de Outubro 925/903, CEP 90510-002, Porto Alegre, RS, Brasil. Tel. 55 51 3314-3665. E-mail: [email protected]
Financial support: None.
Submitted: 25 January 2013. Accepted, after review: 21 September 2013.
volume (TLV), in children with OB. In addition, it can be used in order to measure the percentage of AT relative to TLV (AT%) with the use of thresholds to differentiate normal lung areas from OB areas. It has been shown that AT% is a major contributing factor to chronic persistent airflow obstruction in asthma.(10)
Pulmonary function remains abnormal for long periods after an episode of OB.(11,12) The clinical course following the onset of OB is variable and depends on the volume of affected lung tissue. (1) Measures of clinical status and of the ability to perform physically demanding activities—such as the number of hospital admissions or missed school days, walk test distance, nutritional status, and oxygen saturation (SO2) at rest or during exercise—facilitate the selection of appropriate clinical interventions.(2,3) Because the prognosis of OB patients depends not only on patient behavior but also on functional impairment and the extent of anatomical damage, clinicians should gather information regarding the extent and type of anatomical abnormalities. Bronchiectasis, atelectasis, lobar collapse, and areas of low density are known consequences of postinfectious OB, and HRCT is the best method of examining such lesions,(4,6,7) all of which can influence the
clinical status of patients and their pulmonary function test results.(4,6,7) Previous studies have
shown that low attenuation areas correlate well with pulmonary function test results in patients with AT of various causes.(13-15) However, to our
knowledge, no studies have shown a correlation of CT densitovolumetry findings with pulmonary function in children with OB.(4,6,7)
Our objective was to describe the correlation between the volume of areas of AT and pulmonary function test results in children with OB. In addition, we compared AT% values with SO2 values, pulmonary function test results, and clinical scores in those children in an attempt to obtain objective measurement criteria for OB.
Methods
This was a prospective study including all of the children treated at our postinfectious OB clinic for more than 5 years and having clinically stable OB and symptom onset before the age of 2 years. The study protocol was approved by the local research ethics committee, and the parents or legal guardians of all participants gave written informed consent.
Introduction
Postinfectious obliterative bronchiolitis (OB) is an uncommon and severe form of chronic obstructive lung disease that occurs in children after lower respiratory tract injury.(1) In terms of diagnosis, there are no specific signs or symptoms of postinfectious OB. Clinical and imaging findings are used in combination with laboratory test results in order to identify the cause and rule out other forms of chronic lung disease. The diagnostic criteria for postinfectious OB are as follows: severe acute bronchiolitis/ viral pneumonia during the first 3 years of life in previously healthy children; evidence of persistent airway obstruction after the acute event, identified by physical examination, pulmonary function testing, or both; chest X-ray findings of obstructive lung disease; a mosaic pattern and air trapping (AT) on chest CT scans; and exclusion of other chronic lung diseases progressing to permanent respiratory symptoms.(2,3)
Histologically, OB is characterized by the presence of granulation tissue plugs in the small airway lumen, complete small airway destruction, or both.(4) Mauad et al.(5) showed that OB is
histologically characterized by a constrictive pattern with varying degrees of inflammation and airway obliteration, ranging from minimal bronchiolar inflammation to complete obliteration of the bronchioles and bronchi by fibrotic tissue. Indirect signs of obstruction, such as macrophage accumulation, bronchiectasis, mucus accumulation, and hyperinflation, are always present.
Although there have been several reviews of studies examining long-term sequelae of adenovirus pneumonia,(5,6) few studies have examined CT
findings in children with OB.(6,7) Some of these studies have reported that abnormal CT findings in such children can predict abnormal lung function later in life.(7)
It has been reported that HRCT is an important diagnostic tool for the evaluation of pulmonary damage in patients with OB.(2) The volume of an organ (or the volume of abnormal parts of an organ) can be determined by the use of helical CT images and attenuation coefficient values or densities on the Hounsfield scale, expressed in Hounsfield units (HU). This method is known as volumetric CT densitometry or CT densitovolumetry,(8,9) and it can be used in order
Clinical scores included the following: 1) nutritional status(17) (Z score: 0 = good nutritional status; 1 = mild malnutrition; 2 = moderate malnutrition; and 3 = severe malnutrition); 2) cough during remission (0 = absent and 1 = present); 3) cough within 2 weeks before the examination (0 = absent and 1 = present); 4) wheezing during remission (0 = absent and 1 = present); 5) wheezing on most days of the week (0 = absent and 1 = present); 6) wheezing in the last 2 weeks (0 = absent and 1 = present); 7) difficulty breathing in the 2 weeks preceding the examination (0 = absent and 1 = present); 8) frequency of exacerbations in the last 6 months (0 = no exacerbations; 1 = sporadic exacerbations; 2 = exacerbations every 2 months; 3 = exacerbations every month; and 4 = exacerbations every week); 9) increased anteroposterior chest diameter (0 = absent and 1 = present); 10) SO2 at rest (> 95% = 0; 90-94% = 1; and < 90% = 2); 11) minimum SO2 during the 6MWT (6MWT_SO2; > 95% = 0; 90-94% = 1; and < 90% = 2), mean desaturation during exercise being measured by calculating the difference between SO2 at rest and 6MWT_SO2; 12) desaturation > 4% during the 6MWT (0 = negative and 1 = positive); 13) the FEV1/FVC ratio; and 14) percent predicted FEV1 (FEV1%; > 80% = 0; 61-80% = 1; 41-60% = 2; < 41% = 3). All CT images were acquired with the use of the lowest possible radiation dose and a commercially available helical CT scanner (XVision EX; Toshiba Medical Systems Corporation, Otawara, Japan), being post-processed on a workstation (O2®; SGI, Fremont, CA, USA) running three-dimensional (3D) rendering software (ALATOVIEW; Toshiba Medical Systems Corporation). The CT scanner was calibrated periodically, as recommended by the manufacturer. An initial set of nine axial HRCT scans (with 1-mm collimation at increments of 20 mm) were acquired with the use of a high-frequency algorithm. Those HRCT images were evaluated by two thoracic radiologists with more than 10 years of experience in chest CT. A final decision was reached by consensus.
Two additional sets of images were acquired by the helical CT scanner during single breath-hold maneuvers (during inhalation and exhalation). To minimize respiratory motion artifacts, helical CT scans were taken in the caudocranial direction. On the basis of previous studies,(18-21) the following
parameters were used: collimation, 10 mm; table The diagnosis of OB was based on the
identification of chronic obstructive respiratory symptoms appearing after an episode of lower respiratory tract infection before the age of 2 years in previously healthy children.(2,3) All clinical diagnoses were confirmed by characteristic findings on contemporary HRCT scans. Differential diagnoses were excluded.
The inclusion criteria were as follows(3): acute bronchiolitis/viral pneumonia before the age of 2 years in previously healthy children; evidence of persistent airway obstruction after the acute event, identified by physical examination, pulmonary function testing, or both, the obstruction being unresponsive to at least 2 weeks of treatment with systemic corticosteroids and bronchodilators; radiological findings of obstructive lung disease, including hyperinflation, atelectasis, bronchial wall thickening, and bronchiectasis, as well as a mosaic perfusion pattern and AT on CT scans; and absence of other chronic lung diseases progressing to persistent respiratory symptoms, including tuberculosis, cystic fibrosis, bronchopulmonary dysplasia, immunodeficiency, asthma, and severe alpha-1 antitrypsin deficiency. The exclusion criteria were as follows: being unable to undergo pulmonary function testing or CT without sedation; being unable to hold breath for the duration of CT scanning; Having disease exacerbation < 30 days before CT or pulmonary function testing; having other lung diseases; and requiring continuous oxygen therapy.
A total of 25 patients with OB met the inclusion criteria. Of those 25 patients, 6 were excluded (because they were unable to perform the required respiratory maneuvers). The final sample consisted of 19 children (14 males and 5 females) in the 7-15 year age bracket (mean age, 10 ± 2.5 years).
For measuring the volume of lung parenchyma with abnormally low attenuation values, areas of extremely low attenuation or density were considered to be abnormal, because of the disproportion between the volume of lung parenchyma (including interstitial tissue, vessels, blood, lymph, interstitial fluid, and airway walls) and the air in those regions. In order to simplify measurement, we defined “AT volume” as the total volume of lung zones showing extremely low density values.
We calculated AT% using a fixed threshold. We first calculated the lung volume affected by AT using a fixed threshold of −950 HU (AT%950). This threshold was first proposed by Gevenois et al.(23) and has been used by many others in order to quantify emphysema.(18) We considered any
portion of the lungs with a density below −950 HU to be affected by AT. We calculated AT%950 by dividing the AT volume for that threshold by the TLV. These data were also calculated for expiratory scans.
The next step was to calculate AT% for thresholds selected by using density masks. No validated threshold is available for determining the volume of hyperinflation, AT, or emphysema in children. Because the −950 HU threshold can underestimate the extent of disease in this population, we also calculated AT volume using a threshold selected for each patient with the aid of a density mask. The threshold level was adjusted until the mask corresponded to our speed, 14 mm/rotation (pitch, 1.4); and low
radiation dose (120 kV and 50 mAs). The mean total radiation dose was 5 ± 1.3 mSv. We used helical CT scans of 10 mm, low mAs, and high pitch in order to reduce radiation exposure. A standard reconstruction algorithm was used in order to avoid the effects of edge-enhancing filters on tissue density.(22) All scans were taken without intravenous contrast medium.
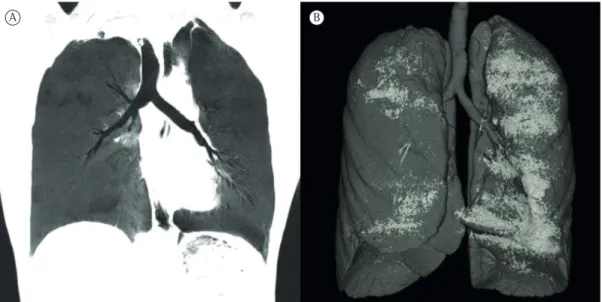
The first step of CT densitovolumetry was lung segmentation for measuring TLV. Two segmentation steps were applied to each set of helical CT images before the calculation of TLV. The lungs were isolated by eliminating from the image data any structure with a density exceeding −250 HU. Subsequently, we eliminated the air within the abdomen and outside the patient (nonpulmonary air) by selecting regions of interest with the 3D rendering software. The regions of interest were selected by drawing a line between the lung and the nonpulmonary air on each slice. Different 3D software, unavailable to us during the study period, might include different tools for lung segmentation. In order to minimize operator-dependent variability, we considered the air within the trachea or main bronchi to be pulmonary air rather than excluding it. The operator assessed segmentation accuracy by reviewing the 3D lung image generated by volume rendering (Figure 1). The software then automatically calculated TLV.
A B
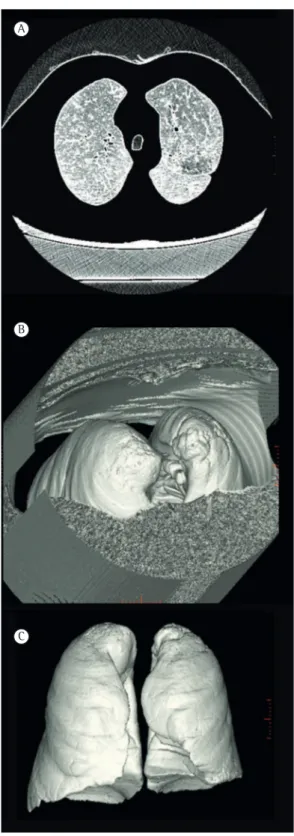
subjective visual impression of affected lung portions (Figure 2). That threshold was selected, and TLV was then segmented. Any portions of the lungs with densities below the selected HU were considered abnormal. We then calculated AT% using that density mask (AT%DM). These data were also calculated for expiratory scans. The shrink (deflation) volume of the lungs was calculated by subtracting the TLV as measured on images acquired during exhalation from the TLV as measured on images acquired during inhalation. The percentage of shrink volume was considered excellent if it was > 50%, reasonable/ good if it was 30-50%, and poor if it was < 30%.
For the statistical analysis, test results were entered into a Microsoft Excel database and processed by means of Excel tools, the analysis being performed with the Statistical Package for the Social Sciences, version 11 (SPSS Inc., Chicago, IL, USA). Statistical significance was set at p < 0.05. We assumed a power of 90% for a sample size of 19 patients and statistical significance of p < 0.05, on the basis of a previous study.(7)
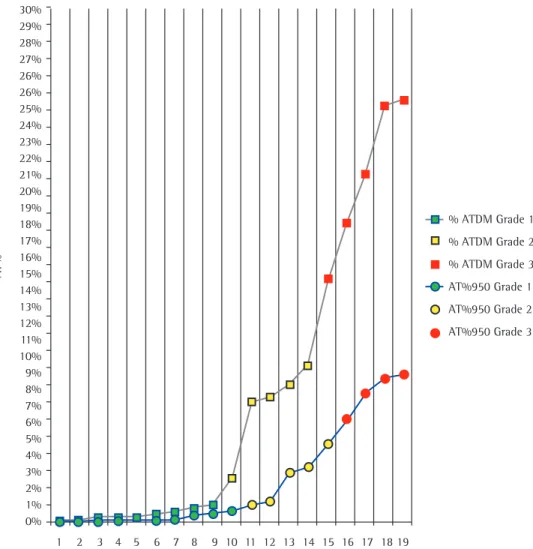
Scatter plots (Figure 3) were used in order to classify patients according to the severity of AT%. For AT%950 and AT%DM, AT% < 1% was considered to indicate normality or minimal disease expression. In addition, AT%950 values of 1-5% were considered to indicate moderate disease expression, and AT%950 values > 5% were considered to indicate severe disease expression. Moreover, AT%DM values of 1-10% were considered to indicate moderate disease expression, and AT%DM values > 10% were considered to indicate severe disease expression. The magnitude of variability in AT%950 and AT%DM guided the selection of values to differentiate between moderate and severe disease expression (Figure 3). All variables were analyzed by Pearson’s product-moment correlation coefficient. Correlations were determined before and after the exclusion of outliers (Figure 4). Values of r and p were calculated separately for censored and uncensored data. Correlations were also calculated for pulmonary function test results and clinical scores.
Results
Of the 19 patients, 2 had normal clinical scores, 7 had clinical scores < 5 (including the two patients with clinical scores = 0), 6 had scores of 5-10, and 6 had scores > 10. In the
A
B
C
30% 29% 28% 27% 26% 26% 25% 24% 23% 22% 21% 20% 19% 18% 17% 16% 15% 14% 13% 12% 11% 10% 9% 8% 7% 6% 5% 4% 3% 2% 1% 0%
AT
%
1 2 3 4 5 6 7 8 9 10 11 12 13 14 15 16 17 18 19
% ATDM Grade 1
% ATDM Grade 2
% ATDM Grade 3
AT%950 Grade 1
AT%950 Grade 2
AT%950 Grade 3
Figure 3 - Scatter plot illustrating the distribution of patients according to the percentage of air trapping relative to total lung volume (AT%), which was calculated for a fixed threshold of −950 HU (AT%950) and for thresholds set by subjective analysis based on density masks (AT%DM). Note that AT%DM allows better discrimination among the grades of disease severity (i.e., grade 1, normal/mild; grade 2, moderate; and grade 3, severe), especially for moderate disease (AT% > 1%) and severe disease (AT% > 10%). Note also that the stratification of disease severity changed from normal/mild to moderate in 1 patient (case 10) and from moderate to severe in 1 patient (case 14) depending on the method for selecting the threshold.
evaluation of the nutritional status, 8 patients had Z scores < 0.
Regarding 6MWT parameters, mean SO2 at rest was 96 ± 2% (range, 92-99%), and mean 6MWT_SO2 was 92 ± 4% (range, 83-99%). We found no correlation between SO2 at rest and SO2 during exercise (r = 0.00). Mean desaturation during exercise (measured by calculating the difference between SO2 at rest and 6MWT_SO2) was 4 ± 4% (range, −2% to 15%). The mean six-minute walk distance (6MWD) was 552 ±
131 m (range, 90-705 m). The 6MWD correlated significantly with 6MWT_SO2 (r = 0.52; p < 0.05) and desaturation during exercise (r = 0.58; p
< 0.05) but not with SO2 at rest (r = 0.26; p > 0.05). Regarding pulmonary function parameters, mean FVC was 75 ± 20% (range, 43-106%), mean FEV1% was 58 ± 20% (range, 36-100%), and mean FEV1/FVC was 72 ± 16% (range, 49-107%).
OB results from lower respiratory tract injury.(6) The diagnosis of postinfectious OB in children is based on a history of lower respiratory tract infection (usually an acute viral infection), followed by persistent chronic obstructive lung disease.(2,3) HRCT is an excellent method for the identification of anatomical damage following the onset of the disease, such damage including areas of low attenuation, areas of consolidation/atelectasis, bronchial wall thickening, bronchiectasis, and mosaic perfusion. In addition, expiratory HRCT scans can assist in confirming the presence of AT. However, HRCT allows only a subjective assessment of the extent of the disease and is dependent on the experience and skill of radiologists.(6,9) Our study demonstrated that the 6MWD was longer in patients with larger normal lung (r = 0.53). In addition, we found that AT%950 showed significant correlations (before and after the exclusion of outliers, respectively) with the clinical score (r = 0.72; 0.80), FVC (r = 0.24; 0.59), FEV1 (r = −0.58; −0.67), and FEV1/FVC (r = −0.53; r = −0.62), as did AT%DM with the clinical score (r = 0.58; r = 0.63), SO2 at rest 9, 5, and 5 of the 19 patients, AT%DM was
classified as normal or mild, moderate, and severe, respectively (points above the gray line in Figure 3). In 10, 5, and 4 of the 19 patients, AT%950 was classified as normal or mild, moderate, and severe, respectively (points above the blue line in Figure 3). We found a correlation between AT%DM and AT%950, as evidenced by r = 0.83 (or r = 0.93 after the exclusion of one outlier). No significant correlation was found between the percentage of shrink volume and AT%DM or between the percentage of shrink volume and AT%950.
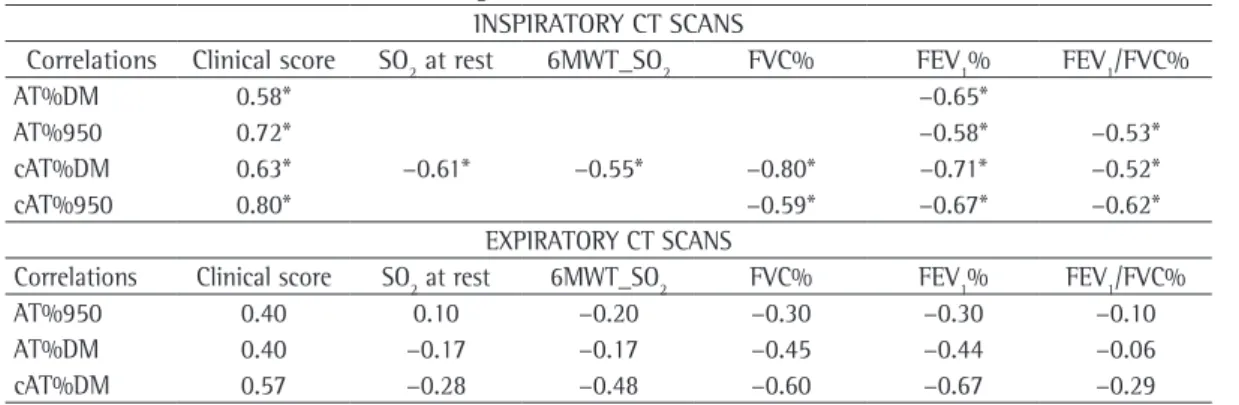
The correlations of CT densitovolumetry parameters with clinical scores, pulmonary function test results, and 6MWT parameters are summarized in Table 1. Table 1 shows the correlation values for each parameter before and after the exclusion of outliers. Figure 4 illustrates the correlations of AT%DM and AT%950 with nondensitometric parameters.
Discussion
An uncommon and severe form of chronic obstructive lung disease in children and adults,
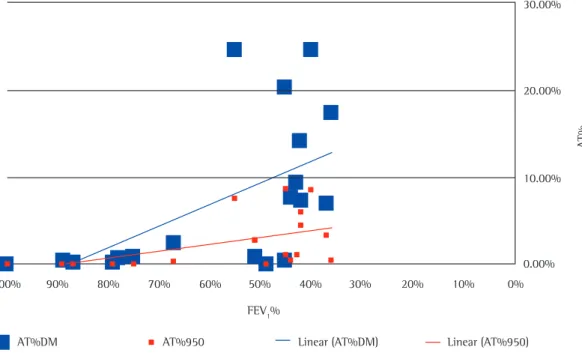
Figure 4 - Distribution of the observations of the percentage of air trapping relative to total lung volume (AT%), calculated for a fixed threshold of −950 HU—AT%950—(red squares) and for thresholds selected with the aid of density masks—AT%DM—(blue squares), including the corresponding linear regression lines. The distribution suggests that patients with FEV1% above 70% had only mild anatomical damage as measured by quantification of areas of air trapping or hyperinflation. Some patients with FEV1% in the range of 50% or less had only mild disease as measured by AT%950, a finding that highlights the limitations of a threshold of −950 HU for the assessment of patients with obliterative bronchiolitis. The correlation between FEV1% and AT%DM was much better, as shown by the regression line.
30.00%
20.00%
10.00%
0.00% 0% 10% 20%
30% 40% 50%
60% 70%
80% 90%
100%
FEV1%
AT%DM AT%950 Linear (AT%DM) Linear (AT%950)
AT
demonstrate significant correlations of AT% with clinical scores and pulmonary function test results. The quantification of areas of abnormally low attenuation is an important diagnostic tool for OB, and the technique has substantial advantages over the traditional subjective assessment of HRCT images.(19-21) The quantification of anatomical damage is important in patients with OB; CT densitovolumetry can measure lung volumes directly and therefore aid clinicians in making decisions regarding patient quarantining and the aggressiveness of treatment.
In the present study, clinical scores were moderately correlated with FVC and FEV1/ FVC (r ~ 0.5). Although there was a stronger correlation between clinical scores and FEV1 (r = 0.8), these findings are possibly biased because pulmonary function test results were included in the clinical score parameters. Additionally, both measures of AT% were significantly correlated with clinical scores (r ≥ 0.6); the strength of those correlations increased when outliers were eliminated (censored AT%950, r = 0.8), which suggests that it might increase further in larger series. We found that inspiratory CT scans were much more informative than expiratory CT scans regarding the presence of AT. The extent of AT areas might have been underestimated on the expiratory CT scans because of the higher expiratory lung density. This is important because atelectasis is more common in children.(24)
Our study has some limitations. In order to calculate AT%, we used a threshold that has yet to be validated. The −950 HU threshold was validated for emphysema quantification in adult (r = −0.40; r = −0.61), 6MWT_SO2 (r = −0.24;
r = −0.55), FVC (r = −0.44; r = −0.80), FEV1 (r = −0.65; r = −0.71), and FEV1/FVC (r = −0.41; r = −0.52). These data suggest that objective CT measurements adequately represent clinical scores and functional impairment in OB.
CT densitovolumetry has been proven to overcome this limitation and is a standard recommendation for the quantification of other lung diseases in which the proportion between pulmonary air and the lung parenchyma is increased, therefore decreasing lung density.(20,21) Areas of decreased attenuation can also result from decreased perfusion of hypoventilated alveoli distal to obstructed bronchioles. The main finding on expiratory CT scans is a geographic heterogeneity of lung attenuation (mosaic attenuation pattern), which is seen in 40-80% of patients.(6,19) The abnormalities can be subtle on inspiratory CT scans, being usually easier to detect on expiratory CT scans.(24) In a previous study of the correlation
between pulmonary function abnormalities and the extent of HRCT features of OB, significant relationships were found only between FEV1 and the number of bronchopulmonary segments affected by bronchiectasis.(14) Hansell et al.(15)
confirmed that the extent of decreased attenuation was independently associated with a reduction in FEV1. In contrast, bronchial wall thickening was independently associated with the presence of AT (as measured by RV/TLC). In patients with Sauropus androgynus-associated OB, pulmonary function test results were more closely correlated with AT than with any other CT parameter.(16) To our knowledge, the present study is the first to
Table 1 - Correlations between CT findings and functional data. INSPIRATORY CT SCANS
Correlations Clinical score SO2 at rest 6MWT_SO2 FVC% FEV1% FEV1/FVC%
AT%DM 0.58* −0.65*
AT%950 0.72* −0.58* −0.53*
cAT%DM 0.63* −0.61* −0.55* −0.80* −0.71* −0.52*
cAT%950 0.80* −0.59* −0.67* −0.62*
EXPIRATORY CT SCANS
Correlations Clinical score SO2 at rest 6MWT_SO2 FVC% FEV1% FEV1/FVC%
AT%950 0.40 0.10 −0.20 −0.30 −0.30 −0.10
AT%DM 0.40 −0.17 −0.17 −0.45 −0.44 −0.06
cAT%DM 0.57 −0.28 −0.48 −0.60 −0.67 −0.29
Med. 2012;106(6):786-93. http://dx.doi.org/10.1016/j. rmed.2012.02.012 PMid:22445772
11. de Blic J, Deschildre A, Chinet T. Post-infectious bronchiolitis obliterans [Article in French]. Rev Mal Respir. 2013;30(2):152-60. http://dx.doi.org/10.1016/j. rmr.2012.10.600 PMid:23419446
12. Mattiello R, Mallol J, Fischer GB, Mocelin HT, Rueda B, Sarria EE. Pulmonary function in children and adolescents
with postinfectious bronchiolitis obliterans. J Bras Pneumol.
2010;36(4):453-9. http://dx.doi.org/10.1590/S1806-37132010000400010 PMid:20835592
13. Mets OM, Zanen P, Lammers JW, Isgum I, Gietema HA, van Ginneken B, et al. Early identification of small airways
disease on lung cancer screening CT: comparison of current
air trapping measures. Lung. 2012;190(6):629-33. http:// dx.doi.org/10.1007/s00408-012-9422-8 PMid:23064488 14. Padley SP, Adler BD, Hansell DM, Müller NL. Bronchiolitis
obliterans: high resolution CT findings and correlation with
pulmonary function tests. Clin Radiol. 1993;47(4):236-40. http://dx.doi.org/10.1016/S0009-9260(05)81129-8 15. Hansell DM, Rubens MB, Padley SP, Wells AU. Obliterative
bronchiolitis: individual CT signs of small airways disease and functional correlation. Radiology. 1997;203(3):721-6. PMid:9169694
16. Rodrigues JC, Cardieri JM, Bussamra MH, Nakaie CM, Almeida MB, Silva FL, et al. Provas de função pulmonar em crianças e adolescentes. J Pneumol. 2002;28(Suppl 3):S207-S221.
17. de Almeida CA, Ricco RG, Nogueira MP, Del Ciampo
LA, Mucillo G. Comparison of four anthropometric
methods of nutritional assessment and evaluation of the agreement between two reference populations. J Trop
Pediatr. 1999;45(6):345-50. http://dx.doi.org/10.1093/ tropej/45.6.345 PMid:10667003
18. Mattiello R, Sarria EE, Stein R, Fischer GB, Mocelin HT, Barreto SS, et al. Functional capacity assessment in
children and adolescents with post-infectious bronchiolitis
obliterans. J Pediatr (Rio J). 2008;84(4):337-43. http:// dx.doi.org/10.2223/JPED.1807
19. Kim CK, Chung CY, Kim JS, Kim WS, Park Y, Koh YY. Late abnormal findings on high-resolution computed tomography after Mycoplasma pneumonia. Pediatrics. 2000;105(2):372-8. http://dx.doi.org/10.1542/ peds.105.2.372 PMid:10654958
20. Kauczor HU, Heussel CP, Fischer B, Klamm R, Mildenberger P, Thelen M. Assessment of lung volumes using helical CT at inspiration and expiration: comparison with pulmonary function tests. AJR Am J Roentgenol. 199;171(4):1091-5.
21. Arakawa A, Yamashita Y, Nakayama Y, Kadota M, Korogi H, Kawano O, et al. Assessment of lung volumes in pulmonary emphysema using multidetector helical CT: comparison with pulmonary function tests. Comput Med Imaging Graph. 2001;25(5):399-404. http://dx.doi. org/10.1016/S0895-6111(01)00004-0
22. Johnston C, Carvalho WB. Atelectasis: mechanisms, diagnosis and treatment in the pediatric patient [Article
in Portuguese]. Rev Assoc Med Bras. 2008;54(5):455-60. http://dx.doi.org/10.1590/S0104-42302008000500021 PMid:18989568
23. Gevenois PA, De Vuyst P, de Maertelaer V, Zanen J, Jacobovitz D, Cosio MG, et al. Comparison of computed density and microscopic morphometry in pulmonary emphysema. Am J Respir Crit Care Med. 1996;154(1):187-92. http://dx.doi.org/10.1164/ajrccm.154.1.8680679 PMid:8680679
patients, and we used it in the present study despite our conviction that segmentation at this level would result in an underestimation of areas of low attenuation in children, especially in the absence of hyperinflation/emphysema. (23) Although histopathological findings were unavailable for our patients, previous studies(2,3) have examined correlations between imaging findings and histopathological findings in patients with OB. In addition, our clinical score has yet to be validated, its clinical application requiring further investigation.
In conclusion, anatomical damage to the lungs as measured by CT (i.e., AT%) correlated significantly with clinical scores and pulmonary function test results. After our censoring of extreme values, AT%DM showed stronger correlations than did AT%950.
References
1. Ryu JH, Myers JL, Swensen SJ. Bronchiolar disorders. Am J Respir Crit Care Med. 2003;168(11):1277-92. http:// dx.doi.org/10.1164/rccm.200301-053SO PMid:14644923
2. Hardy K. Childhood bronchiolitis obliterans. In: Epler G, editor. Diseases of the bronchioles. New York: Raven Press; 1994. p. 415-26.
3. Fischer GB, Sarria EE, Mattiello R, Mocelin HT, Castro-Rodriguez JA. Post infectious bronchiolitis obliterans in children. Paediatr Respir Rev. 2010;11(4):233-9. http:// dx.doi.org/10.1016/j.prrv.2010.07.005 PMid:21109182 4. Muller NL, Silva CI. Obliterative Bronchiolitis. In: Boiselle
PM, Lynch DA, editors. CT of the airways. Totowa: Humana Press; 2008. p. 75-120.
5. Mauad T, Dolhnikoff M; São Paulo Bronchiolitis Obliterans Study Group. Histology of childhood bronchiolitis obliterans. Pediatr Pulmonol. 2002;33(6):466-74. http:// dx.doi.org/10.1002/ppul.10097 PMid:12001281
6. Zhang L, Irion K, da Silva Porto N, Abreu e Silva F. High-resolution computed tomography in pediatric patients with postinfectious bronchiolitis obliterans. J Thorac Imaging. 1999;14(2):85-9. http://dx.doi.org/10.1097/00005382-199904000-00003 PMid:10210478
7. Mattiello R, Sarria EE, Mallol J, Fischer GB, Mocelin H, Bello R, et al. Post-infectious bronchiolitis obliterans: can CT scan findings at early age anticipate lung function? Pediatr Pulmonol. 2010;45(4):315-9. http://dx.doi. org/10.1002/ppul.21115 PMid:20205267
8. Mergo PJ, Williams WF, Gonzalez-Rothi R, Gibson R, Ros PR, Staab EV, et al. Three-dimensional volumetric assessment of abnormally low attenuation of the lung from routine helical CT: inspiratory and expiratory quantification. AJR Am J Roentgenol. 1998;170(5):1355-6. http:// dx.doi.org/10.2214/ajr.170.5.9574615 PMid:9574615
9. Müller NL, Staples CA, Miller RR, Abboud RT. “Density mask”. An objective method to quantitate emphysema using computed tomography. Chest. 1988;94(4):782-7. http://dx.doi.org/10.1378/chest.94.4.782 PMid:3168574
2005;365(9467):1348-53. http://dx.doi.org/10.1016/ S0140-6736(05)61034-3
24. Schulz KF, Grimes DA. Sample size calculations in randomised trials: mandatory and mystical. Lancet.
About the authors
Helena Mocelin
Pediatric Pulmonologist. Santa Casa Sisters of Mercy Hospital Complex in Porto Alegre, Porto Alegre, Brazil.
Gilberto Bueno
Professor of Pediatrics. Federal University of Health Sciences of Porto Alegre, Porto Alegre, Brazil.
Klaus Irion
Consultant Radiologist. Liverpool Heart and Chest Hospital, Liverpool, United Kingdom.
Edson Marchiori
Professor of Radiology. Federal University of Rio de Janeiro, Rio de Janeiro, Brazil.
Edgar Sarria
Professor of Pediatrics. Pontifical Catholic University of Rio Grande do Sul, Porto Alegre, Brazil.
Guilherme Watte
Doctoral Student in Pulmonology. Federal University of Rio Grande do Sul, Porto Alegre, Brazil.
Bruno Hochhegger
Professor of Radiology, Federal University of Health Sciences of Porto Alegre; and Radiologist, Santa Casa Sisters of Mercy Hospital