Can the single-breath helium dilution method predict lung
volumes as measured by whole-body plethysmography?*
Pode o método de diluição do hélio em respiração única estimar os volumes pulmonares medidos pela pletismografia de corpo inteiro?*
Patrícia Chaves Coertjens, Marli Maria Knorst, Anelise Dumke, Adriane Schmidt Pasqualoto, João Riboldi, Sérgio Saldanha Menna Barreto
Abstract
Objective: To compare TLC and RV values obtained by the single-breath helium dilution (SBHD) method with those obtained by whole-body plethysmography (WBP) in patients with normal lung function, patients with obstructive lung disease (OLD), and patients with restrictive lung disease (RLD), varying in severity, and to devise equations to estimate the SBHD results. Methods: This was a retrospective cross-sectional study involving 169 individuals, of whom 93 and 49 presented with OLD and RLD, respectively, the remaining 27 having normal lung function. All patients underwent spirometry and lung volume measurement by both methods. Results: TLC and RV were higher by WBP than by SBHD. The discrepancy between the methods was more pronounced in the OLD group, correlating with the severity of airflow obstruction. In the OLD group, the correlation coefficient of the comparison between the two methods was 0.57 and 0.56 for TLC and RV, respectively (p < 0.001 for both). We used regression equations, adjusted for the groups studied, in order to predict the WBP values of TLC and RV, using the corresponding SBHD values. It was possible to create regression equations to predict differences in TLC and RV between the two methods only for the OLD group. The TLC and RV equations were, respectively, ∆TLCWBP-SBHD in L = 5.264 − 0.060 × FEV1/FVC (r2 = 0.33; adjusted r2 = 0.32) and ∆RV
WBP-SBHD in L = 4.862 − 0.055 × FEV1/FVC (r2 = 0.31; adjusted r2 = 0.30). Conclusions: The correction of TLC and RV results
obtained by SBHD can improve the accuracy of this method for assessing lung volumes in patients with OLD. However, additional studies are needed in order to validate these equations.
Keywords: Plethysmography, whole body; Total lung capacity; Residual volume.
Resumo
Objetivo: Comparar resultados de CPT e VR obtidos pelo método de diluição de hélio em respiração única (DHRU) com aqueles obtidos por pletismografia de corpo inteiro (PCI) em indivíduos com função pulmonar normal, portadores de distúrbio ventilatório obstrutivo (DVO) e portadores de distúrbio ventilatório restritivo (DVR) com diferentes níveis de gravidade e elaborar equações para estimar CPT e VR por DHRU. Métodos: Estudo
transversal retrospectivo com 169 indivíduos, dos quais, respectivamente, 93, 49 e 27 apresentavam DVO, DVR e espirometria normal. Todos realizaram espirometria e determinação de volumes pulmonares pelos dois métodos. Resultados: Os valores de CPT e VR foram maiores por PCI que por DHRU. A discrepância entre os métodos foi mais acentuada no grupo com DVO e se relacionou com a gravidade da obstrução ao fluxo aéreo. No grupo com DVO, o coeficiente de correlação da comparação entre os dois métodos foi de 0,57 e 0,56 para CPT e VR, respectivamente (p < 0,001 para ambos). Para predizer os valores de CPT e VR por PCI utilizando os respectivos valores por DHRU foram utilizadas equações de regressão, corrigidas de acordo com os grupos estudados. Somente foi possível criar equações de regressão para predizer as diferenças de CPT e VR entre os
dois métodos para pacientes com DVO. Essas equações foram, respectivamente, ∆CPTPCI-DHRU em L = 5,264 − 0,060 × VEF1/CVF (r2 = 0,33; r2 ajustado = 0,32) e ∆VR
PCI-DHRU em L = 4,862 − 0,055 × VEF1/CVF (r
2 = 0,31; r2
ajustado = 0,30). Conclusões: A correção de CPT e VR obtidos por DHRU pode melhorar a acurácia desse método
para avaliar os volumes pulmonares em pacientes com DVO. Entretanto, estudos adicionais para validar essas
equações são necessários.
Descritores: Pletismografia total; Capacidade pulmonar total; Volume residual.
* Study carried out at the Porto Alegre Hospital de Clínicas, Porto Alegre, Brazil.
Correspondence to: Sérgio Saldanha Menna Barreto. HCPA, Rua Ramiro Barcelos, 2350, sala 2050, Bom Fim, CEP 90035-903, Porto Alegre, RS, Brasil.
Tel. 55 86 3323-5209. E-mail: [email protected]
Financial support: This study received financial support from the Fundo de Incentivo à Pesquisa do Hospital de Clínicas de Porto Alegre (FIPE-HCPA, Research Incentive Fund of the Porto Alegre Hospital de Clínicas).
spirometry, static lung volume measurements by WBP, and single-breath pulmonary diffusing capacity measurements in the pulmonary physiology laboratory of a referral hospital. We selected patients with OLD caused by COPD and patients in whom spirometry results were suggestive of RLD. We excluded patients whose spirometry results showed mixed obstructive and restrictive lung disease, indeterminate lung disease, or OLD of causes other than COPD. The control group (n = 27) comprised 8 patients (6 of whom were smokers) who had normal spirometry results and who had undergone WBP and pulmonary diffusing capacity measurements in routine care, as well as 19 volunteers who were recruited from the community, who were nonsmokers, who had no respiratory complaints or diseases, who had normal chest X-rays, and who had undergone the three tests in the same period in order to determine whether the reference standards used in the laboratory were appropriate. The ethical and methodological aspects of the study project were approved by the local research ethics committee. We collected data regarding age (years), gender, weight (kg), height (cm), body mass index (kg/m2), and smoking history (pack-years). All pulmonary function tests were performed with a MasterScreen Body spirometer (Jäeger, Würzburg, Germany) and were in accordance with the technical recommendations in the Brazilian Thoracic Association guidelines for pulmonary function testing.(9) Patients underwent spirometry, WBP, and DLCO testing always in the same sequence and at the same time of day. All tests were performed before and after the administration of 400 µg of albuterol. We calculated TLCSBHD by summing the alveolar volume as measured by DLCO testing and the anatomical dead space. We calculated RVSBHD by subtracting
FVC from TLCSBHD. The gases and plethysmograph
were calibrated daily before test initiation. The reference values for spirometry, lung volumes, and DLCO were those described elsewhere.(13-15)
In order to confirm the diagnosis of COPD
by spirometry, we used an FEV1/FVC ratio after
bronchodilator use ≤ 0.70.(16) The severity of airflow obstruction was determined on the basis of
FEV1, as recommended by the American Thoracic Society.(17) Mild to moderate OLD was defined
as an FEV1≥ 50% of the predicted value; severe
OLD was defined as an FEV1 of 35-49% of the
predicted value; and very severe OLD was defined
Introduction
Lung volume measurements are useful for characterizing the severity of respiratory diseases, evaluating the results of interventions, and determining prognosis.(1,2) Patients with restrictive lung disease (RLD) can present with reduced TLC, whereas those with chronic obstructive lung disease (OLD) can present with increased TLC (usually as a result of increased RV).(3) Various methods can be used in order to determine lung volumes, including whole-body plethysmography (WBP), gas dilution methods, and radiological techniques.(4-8) Currently, WBP and the multiple-breath helium dilution method are used in pulmonary function laboratories in order to measure TLC and RV. Any of the abovementioned methods can be used provided that the equipment and maneuvers are in accordance with the recommended technical standards.(8,9) However, WBP is considered the gold standard by some researchers.(10)
The single-breath helium dilution (SBHD) method is a simpler, cheaper, and more widely available alternative method for evaluating alveolar volume with equipment that is less complex than a plethysmograph, having the operational advantage of being performed in conjunction with DLCO determination. However, because the SBHD method depends on the air that is mobilized during a single respiratory maneuver, it can underestimate lung volumes when compared with WBP in patients with a markedly uneven distribution of ventilation. (11,12) Although determination of alveolar volume by the SBHD method for measuring DLCO is used worldwide, the value of this technique in determining lung volumes in patients with OLD or RLD has yet to be established.
In view of the abovementioned considerations, the objective of the present study was to compare lung volumes as measured by the SBHD method with lung volumes as measured by WBP in individuals with normal lung function, as well as in patients with OLD or RLD of varying degrees of severity. In addition, we sought to develop equations to estimate TLC and RV as measured by WBP (TLCWBP and RVWBP, respectively) on the basis of TLC and RV as measured by the SBHD method (TLCSBHD and RVSBHD, respectively) and adjusted for the degree of airflow obstruction.
Methods
Results
In the present study, 169 individuals underwent spirometry and lung volume measurements by WBP and the SBHD method in an open system. Of the 169 individuals, 27 had normal spirometry results, 93 had OLD, and 49 had RLD. The patients with OLD were stratified as follows: patients with mild to moderate OLD (29 patients); patients with severe OLD (29 patients); and patients with very severe OLD (35 patients). The patients with RLD were stratified as follows: patients with less severe disease (25 patients); and patients with more severe disease (24 patients).
Anthropometric data, duration of smoking, smoking history, and pulmonary function test results, stratified by lung function status, are presented in Table 1.
Figure 1 shows mean TLC and RV (in absolute
values and in percentage of predicted). In all groups, TLCWBP and RVWBP values were higher than TLCSBHD and RVSBHD values (p < 0.01), the discrepancy between the two methods being most pronounced in the OLD group and the difference increasing progressively as the severity of airflow obstruction increased. A comparison between the RV/TLC ratio obtained by WBP and the RV/TLC ratio obtained by the SBHD method provided further evidence of the discrepancy between the two methods. In the individuals with normal lung function, those ratios were 0.36 and 0.29, respectively. In the group of patients with mild to moderate OLD, those ratios were 0.53 and 0.38, respectively; in the group of patients with severe OLD, those ratios were 0.60 and 0.43, respectively; and in the group of patients with very severe OLD, those ratios were 0.66 and 0.47, respectively. In the group of patients with less severe RLD, those ratios were 0.44 and 0.32, respectively, and in the group of patients with more severe RLD, those ratios were 0.45 and 0.39, respectively.
Table 2 shows the differences in TLC and RV between WBP and the SBHD method (in absolute values and in percentage of predicted) in the groups studied. In the groups of patients with RLD and normal spirometry results, the difference in TLC between the two methods ranged from 0.61 L to 0.80 L (from 10.8% of the predicted value to 13.1% of the predicted value; p > 0.05). In addition, the difference in RV between the two methods ranged from 0.52 L to 0.75 L (from 30.8% of the predicted value to
as an FEV1 < 35% of the predicted value. Only
5 patients presented with mild OLD. Therefore, they were evaluated in conjunction with those who presented with moderate OLD.
For the diagnosis of RLD, we used the following
criteria: an FEV1/FVC ratio after bronchodilator
use > 0.80; reduced VC (an FVC < 80% of the
predicted value); and reduced TLC (a TLC < 80%
of the predicted value). For data analysis, we used
the median in order to divide the patients with RLD into two groups according to the severity of the disease (a TLC > 72% of the predicted value indicating less severe disease and a TLC < 72% of the predicted value indicating more severe disease).
Statistical analysis was performed with the Statistical Analysis System software, version 9.1 (SAS Institute, Cary, NC, USA). The collected data
were expressed as mean, SE, and 95% CI. For
the evaluation of variables with one observation, one-way ANOVA was performed to determine the differences among the groups. Whenever Levene’s test revealed heterogeneity of variance, Welch’s
ANOVA was performed. For complementation of
results, Tukey’s test was performed. The possible influence of the covariates gender, age, weight, height, body mass index, and smoking history
was tested by analysis of covariance. For the
evaluation of variables for each lung function
method, mixed-model ANOVA was performed. For
complementation of significant effects in relation to the method and group, the Tukey-Kramer test was performed (p < 0.05). The goodness of fit of the model was tested by analysis of residuals and determination of normality by the Kolmogorov-Smirnov test (p > 0.01), the Anderson-Darling test, and the Cramér-von Mises test (p > 0.005). In both models, we obtained partial or residual Pearson correlations, eliminating the effect of factors in order to determine the association between variables.
Bland-Altman plots(18) were used in order to determine the differences in TLC and RV between the two methods. The limits of agreement were calculated as ± 1.96 SDs of the differences. We developed prediction equations to estimate the differences in TLC and RV between the two methods by means of stepwise multiple linear regression, variables with a value of p < 0.10
being included in the models. For all analyses, we
Figure 2 (panels A, B, and C, respectively). The
best correlations were observed in the group of
patients with OLD (r = −0.47 for ∆TLCWBP-SBHD
in % of predicted and r = −0.54 for ∆RVWBP-SBHD
in % of predicted). When the individuals with normal spirometry results and the patients with OLD were analyzed as a whole, the correlation
between FEV1 in % of predicted and ∆TLCWBP-SBHD
in % of predicted increased to r = −0.61 (p <
0.0001), as did the correlation between FEV1 in
% of predicted and ∆RVWBP-SBHD in % of predicted
(r = −0.640; p < 0.0001).
The association between TLCWBP and TLCSBHD
was assessed by Pearson’s correlation test. For the
sample as a whole (n = 169), there was a moderate positive correlation between TLCWBP and TLCSBHD (r = 0.71; p < 0.001), as well as between RVWBP and RVSBHD (r = 0.62; p < 0.0001). In the group of individuals with normal spirometry results and in that of patients with RLD, the coefficients 43.4% of the predicted value; p > 0.05). In the
groups of patients with mild to moderate OLD and severe OLD, the difference in TLC between the two methods ranged from 1.58 L to 2.00 L (from 30.5% of the predicted value to 38.2% of the predicted value; p > 0.05), and the difference in RV between the two methods ranged from 1.46 L to 2.03 L (from 80.7% of the predicted value to 99.4% of the predicted value; p > 0.05). The group of patients with very severe OLD differed from all of the other groups analyzed, showing the largest differences between the two methods regarding TLC (3.09 L; 50.4% of the predicted value) and RV (2.89 L; 139.5% of the predicted value).
The correlations between FEV1/FVC and the
differences in TLC and RV values between the two methods in the individuals with normal spirometry results, in the patients with OLD, and in the patients with RLD are shown in
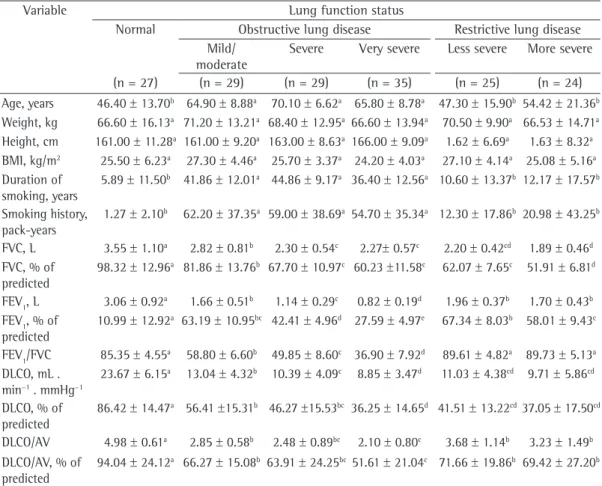
Table 1 - Anthropometric characteristics, smoking history, and functional parameters in 169 individuals stratified by lung function status.
Variable Lung function status
Normal Obstructive lung disease Restrictive lung disease
Mild/ moderate
Severe Very severe Less severe More severe
(n = 27) (n = 29) (n = 29) (n = 35) (n = 25) (n = 24)
Age, years 46.40 ± 13.70b 64.90 ± 8.88a 70.10 ± 6.62a 65.80 ± 8.78a 47.30 ± 15.90b 54.42 ± 21.36b
Weight, kg 66.60 ± 16.13a 71.20 ± 13.21a 68.40 ± 12.95a 66.60 ± 13.94a 70.50 ± 9.90a 66.53 ± 14.71a
Height, cm 161.00 ± 11.28a 161.00 ± 9.20a 163.00 ± 8.63a 166.00 ± 9.09a 1.62 ± 6.69a 1.63 ± 8.32a
BMI, kg/m2 25.50 ± 6.23a 27.30 ± 4.46a 25.70 ± 3.37a 24.20 ± 4.03a 27.10 ± 4.14a 25.08 ± 5.16a
Duration of smoking, years
5.89 ± 11.50b 41.86 ± 12.01a 44.86 ± 9.17a 36.40 ± 12.56a 10.60 ± 13.37b 12.17 ± 17.57b
Smoking history, pack-years
1.27 ± 2.10b 62.20 ± 37.35a 59.00 ± 38.69a 54.70 ± 35.34a 12.30 ± 17.86b 20.98 ± 43.25b
FVC, L 3.55 ± 1.10a 2.82 ± 0.81b 2.30 ± 0.54c 2.27± 0.57c 2.20 ± 0.42cd 1.89 ± 0.46d
FVC, % of
predicted
98.32 ± 12.96a 81.86 ± 13.76b 67.70 ± 10.97c 60.23 ±11.58c 62.07 ± 7.65c 51.91 ± 6.81d
FEV1, L 3.06 ± 0.92a 1.66 ± 0.51b 1.14 ± 0.29c 0.82 ± 0.19d 1.96 ± 0.37b 1.70 ± 0.43b FEV1, % of
predicted
10.99 ± 12.92a 63.19 ± 10.95bc 42.41 ± 4.96d 27.59 ± 4.97e 67.34 ± 8.03b 58.01 ± 9.43c
FEV1/FVC 85.35 ± 4.55a 58.80 ± 6.60b 49.85 ± 8.60c 36.90 ± 7.92d 89.61 ± 4.82a 89.73 ± 5.13a
DLCO, mL . min−1. mmHg−1
23.67 ± 6.15a 13.04 ± 4.32b 10.39 ± 4.09c 8.85 ± 3.47d 11.03 ± 4.38cd 9.71 ± 5.86cd
DLCO, % of predicted
86.42 ± 14.47a 56.41 ±15.31b 46.27 ±15.53bc 36.25 ± 14.65d 41.51 ± 13.22cd37.05 ± 17.50cd
DLCO/AV 4.98 ± 0.61a 2.85 ± 0.58b 2.48 ± 0.89bc 2.10 ± 0.80c 3.68 ± 1.14b 3.23 ± 1.49b
DLCO/AV, % of predicted
94.04 ± 24.12a 66.27 ± 15.08b 63.91 ± 24.25bc51.61 ± 21.04c 71.66 ± 19.86b 69.42 ± 27.20b
8
7
6
5 4
3
2
1
0
T
LC
,
L
A A
AB
a a
ab bc
cd
d B
B
C
C
140
120
100
80
60
40
20
0
T
LC
,
%
of
pre
di
cte
d
R
V
,
L
A
AB B
a a
ab
b
c
c C
C
C 6
5
4
3
2
1
0 A
B B
abc
Normal mild/mod OLD
severe OLD
very severe OLD
less severe RLD
more severe RLD
abc ab a
C bc
A A
R
V
,
%
of
pre
di
cte
d
C 300
250
200
150
100
50
0 A
B B
ab
a a a
b b
A A
WBP
SBHD method
Table 2 - Differences between TLC and RV values as measured by whole-body plethysmography and TLC and RV values as measured by the single-breath helium dilution method in 169 individuals stratified by lung function status.
Variable Lung function status
Normal Obstructive lung disease Restrictive lung disease
Mild/moderate Severe Very severe Less severe More severe
(n = 27) (n = 29) (n = 29) (n = 35) (n = 25) (n = 24)
∆TLCWBP-SBHD, L 0.74 (0.36-0.74)a 1.58 (1.27-2.25)b 2.00 (0.95-3.31)b 3.09 (2.25-4.01)c 0.80 (0.61- 1.04)a
0.61 (0.35-0.95)a
∆TLCWBP-SBHD, % of predicted
13.12 (8.40-21.20)ab 30.50 (22.42-38.85)bc 38.30 (19.70-50.40)c 50.40 (40.13-65.90)d 16.13 (11.00-20.00)ab 10.85 (7.15-16.90)a
∆RVWBP-SBHD, L 0.62 (0.13-0.92)a 1.46 (1.07-1.97)b 2.03 (0.84-2.83)b 2.89 (2.03-3.82)c 0.75 (0.49-0.93)a 0.52 (0.23-0.79)a
∆RVWBP-SBHD, % of predicted 34.70a (11.40-53.30) 80.70 (54.39-103.45)b 99.38 (53.20-137.15)b 139.50 (109.20-167.30)c 43.40 (28.60-56.35)a 30.80 (19.88-44.20)a
WBP: whole-body plethysmography; and SBHD: single-breath helium dilution method. Data presented as median delta and 25-75% interquartile range. Matching letters indicate absence of significant difference between groups, whereas non-matching letters indicate significant difference between groups. One-way ANOVA (groups); p < 0.05.
Figure 2 - Correlations of the difference between TLC as measured by whole-body plethysmography (WBP) and TLC as measured by the single-breath helium dilution (SBHD) method (left column), as well as of the difference between RV as measured by WBP and RV as measured by the SBHD method (right column), with
the FEV1/FVC ratio in % in individuals with normal lung function (A), in patients with obstructive lung
disease (B), and in patients with restrictive lung disease (C).
120 110 100 90 80 70 60 50 40 30 20 10 0
0 10 20 30 40 50 60 70 80 90 100 350 300 250 200 150 100 50 0
0 10 20 30 40 50 60 70 80 90 100
350 300 250 200 150 100 50 0
0 10 20 30 40 50 60 70 80 90 100 FEV1/FVC, % of predicted
FEV1/FVC, % of predicted
FEV1/FVC, % of predicted FEV1/FVC, % of predicted
FEV1/FVC, % of predicted
FEV1/FVC, % of predicted
350 300 250 200 150 100 50 0
0 10 20 30 40 50 60 70 80 90 100 120 110 100 90 80 70 60 50 40 30 20 10 0
0 10 20 30 40 50 60 70 80 90 100
120 110 100 90 80 70 60 50 40 30 20 10 0
0 10 20 30 40 50 60 70 80 90 100 r = 0.05 p = 0.804
r = -0.545 p = 0.0001
r = -0.237 p = 0.10
r = 0.158 p = 0.43
r = -0.588 p = 0.0001
r = 0.01 p = 0.998
was associated with the FEV1/FVC ratio (r =
−0.75; p < 0.001), FEV1 (r = −0.51; p < 0.001),
and DLCO (r = −0.39; p < 0.001). Likewise, the
difference in RV values between the two methods
correlated with the FEV1/FVC ratio (r = −0.75;
p < 0.0001), FEV1 (r = −0.53; p < 0.0001), and
DLCO (r = −0.41; p < 0.0001). There was no
significant correlation between the difference
in lung volumes and FVC (p > 0.05). For the 93
patients with OLD, the coefficient of correlation between TLCWBP and TLCSBHD was 0.57 (p < 0.001) and the coefficient of correlation between RVWBP and RVSBHD was 0.56 (p < 0.001). In the patients with OLD, we used a regression equation in order to predict TLCWBP and RVWBP on the basis of TLCSBHD and RVSBHD. The FEV1/FVC ratio (%), of correlation between TLCWBP and TLCSBHD and
between RVWBP and RVSBHD were, respectively, 0.92 and 0.51 (p < 0.001), whereas in the group of patients with OLD, those correlation coefficients were, respectively, 0.55 and 0.36 (p < 0.001).
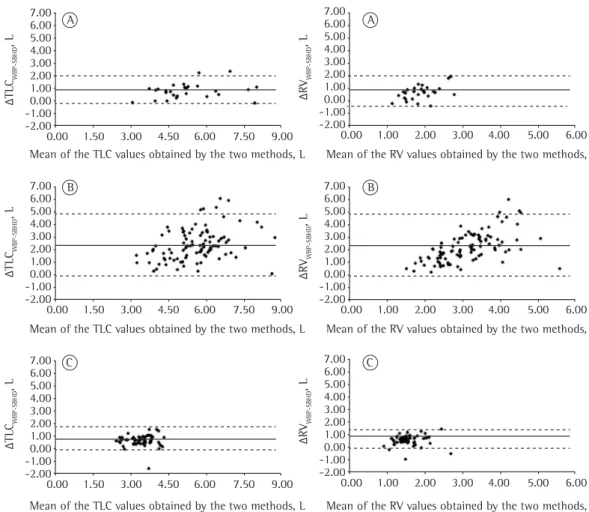
We used Bland-Altman plots in order to compare TLCWBP with TLCSBHD and RVWBP with RVSBHD. The data are shown separately for each
group, by lung function status, in Figure 3.
The group of patients with RLD showed the smallest difference between the two methods for both variables; the largest differences were observed in the patients with OLD and higher lung volumes.
For the sample as a whole (n = 169), the
difference in TLC values between the two methods
7.00 6.00 5.00 4.00 3.00 2.00 1.00 0.00 -1.00 -2.00
0.00 1.50 3.00 4.50 6.00 7.50 9.00 7.00 6.00 5.00 4.00 3.00 2.00 1.00 0.00 -1.00 -2.00
0.00 1.50 3.00 4.50 6.00 7.50 9.00 7.00 6.00 5.00 4.00 3.00 2.00 1.00 0.00 -1.00 -2.00
0.00 1.50 3.00 4.50 6.00 7.50 9.00
7.00 6.00 5.00 4.00 3.00 2.00 1.00 0.00 -1.00 -2.00
0.00 1.00 2.00 3.00 4.00 5.00 6.00 7.00 6.00 5.00 4.00 3.00 2.00 1.00 0.00 -1.00 -2.00
0.00 1.00 2.00 3.00 4.00 5.00 6.00 7.00 6.00 5.00 4.00 3.00 2.00 1.00 0.00 -1.00 -2.00
0.00 1.00 2.00 3.00 4.00 5.00 6.00
∆ T LC WB P-SB HD , L ∆ R VWB P-SB HD , L ∆ R VWB P-SB HD , L ∆ R VWB P-SB HD , L ∆ T LC WB P-SB HD , L ∆ T LC WB P-SB HD , L
Mean of the TLC values obtained by the two methods, L
Mean of the TLC values obtained by the two methods, L
Mean of the TLC values obtained by the two methods, L
Mean of the RV values obtained by the two methods, L
Mean of the RV values obtained by the two methods, L
Mean of the RV values obtained by the two methods, L
A A
B B
C C
increased or decreased proportionally to the increase in airflow obstruction and air trapping. Various studies have compared lung volumes as measured by different methods in patients with OLD. Garfield et al.(20) compared TLC as measured by plethysmography with TLC as measured by chest HRCT in patients with COPD and found a difference of 1.12 L (17.3%) between the two. Similarly, O’Donnell et al.(5) showed that, in patients with COPD, WBP systematically overestimates lung volumes in comparison with the multiple-breath helium dilution method and CT, and that the discrepancy is most pronounced in individuals with
FEV1 < 30% of the predicted value. In contrast, in 815 males with mild airflow obstruction, the SBHD method underestimated TLCWBP by 0.75 L.
(19)
A difference of up to 1.08 L has been reported between TLCWBP and TLC as measured by the multiple-breath helium dilution method.(5,19,21,22) Major discrepancies (of up to 2.25 L) have been observed between TLCSBHD and TLC as measured by the multiple-breath helium dilution method in the presence of OLD.(12,23)
The different results across studies might be related to the cause of OLD, the varying degrees of airflow obstruction, and, in particular, the methods used in order to measure lung volumes. In addition to measuring the ventilated volume, plethysmography measures areas of air trapping. Conversely, the helium dilution technique measures only the air that is ventilated. In patients with airflow obstruction, there are variations in time constants of the respiratory system and in the distribution of ventilation, and there is early collapse of the airways during exhalation, which impairs lung emptying and causes air trapping. These physiological abnormalities help to explain the difference between the values obtained by WBP and those obtained by the SBHD method or the multiple-breath helium dilution method in individuals with OLD.(7,24)
The two helium dilution methods differ in terms of lung volume measurements. The SBHD method is a fast and simple technique in which only one ventilatory maneuver is used (in order to determine DLCO).(25) In addition, the SBHD method requires less effort from patients during pulmonary function testing.(7,23,26) In contrast, the multiple-breath helium dilution method requires a longer test time, allowing a more even distribution of the inhaled gas so that it is in equilibrium with the alveolar air.(7,26) A comparison between
FEV1 (L), and DLCO (mL . min-1 . mmHg-1) were included in the models. In the univariate analysis for ∆TLCWBP-SBHD, the adjusted coefficients for
FEV1/FVC, FEV1, and DLCO were, respectively,
r2 = 0.32, r2 = 0.14, and r2 = 0.07, whereas for
∆RVWBP-SBHD, the adjusted coefficients for the same variables were, respectively, r2 = 0.30, r2 = 0.14, and r2 = 0.07. In the multivariate analysis, FEV
1 and DLCO lost significance and were excluded from the models. The regression equation to predict the difference in TLC between the two methods in the patients with OLD was as follows:
y = 5.264 − 0.060x
where y = ∆TLCWBP-SBHD in L and x = FEV1/FVC in % (r2 = 0.33; adjusted r2 = 0.32).
The regression equation to predict the difference in RV between the two methods was as follows:
Y = 4.862 − 0.055x
where Y = ∆RVWBP-SBHD in L and x = FEV1/FVC in % (r2 = 0.31; adjusted r2 = 0.30).
We were unable to develop equations for individuals with normal lung function and those with RLD.
Discussion
Our results showed the following: 1) TLCWBP and RVWBP values were higher than TLCSBHD and RVSBHD values, regardless of the lung function status; 2) the magnitude of the difference in lung volumes between the two methods was
associated with the FEV1/FVC ratio, progressively
increasing with the degree of airflow obstruction; 3) lung volumes as measured by WBP can be estimated on the basis of the values obtained by the SBHD method provided that the values are corrected for the severity of airflow obstruction. Our study showed that, in the individuals with normal lung function and in those with RLD, the SBHD method underestimated lung volumes when compared with WBP. Comparable values between the two techniques(7) or a difference of 0.21 L in TLC in individuals with normal spirometry results have previously been described. (12) In another study, when compared with the multiple-breath helium dilution method, WBP overestimated TLC by 0.47 L or 7.2% in normal individuals.(19)
the profile of patients treated at a referral university hospital. Likewise, the number of patients with severe RLD was small, which limited the stratification of RLD patients. In addition,
RVSBHD was obtained by subtracting FVC from
TLCSBHD; the use of FVC instead of slow VC possibly
contributed to the lower accuracy of the method,
especially in the patients with OLD. Furthermore,
the prediction equations should be validated in other patient populations in order to increase the external validity of the study.
In conclusion, our study demonstrated that TLCWBP and RVWBP values were higher than TLCSBHD and RVSBHD values in normal individuals and in patients with RLD or OLD. The discrepancy between the two methods for measuring lung volumes was most pronounced in the group of patients with OLD caused by COPD, the magnitude of the difference being directly associated with the degree of airflow obstruction. The linear regression equations described in the present study allow us to adjust TLCSBHD and RVSBHD values for airflow, predicting the lung volumes as measured by WBP. Therefore, the relatively simple, faster, and more widely available SBHD method, used in order to determine pulmonary diffusing capacity, has potential for expanded use. However, additional studies are needed in order to validate the equations before they can be used in clinical practice.
References
1. Martinez FJ, de Oca MM, Whyte RI, Stetz J, Gay SE, Celli
BR. Lung-volume reduction improves dyspnea, dynamic hyperinflation, and respiratory muscle function. Am J Respir Crit Care Med. 1997;155(6):1984-90. http:// dx.doi.org/10.1164/ajrccm.155.6.9196106 PMid:9196106 2. Casanova C, Cote C, de Torres JP, Aguirre-Jaime A,
Marin JM, Pinto-Plata V, et al. Inspiratory-to-total lung capacity ratio predicts mortality in patients with chronic obstructive pulmonary disease. Am J Respir Crit Care Med. 2005;171(6):591-7. http://dx.doi.org/10.1164/ rccm.200407-867OC PMid:15591470
3. Menna Barreto SS. Volumes pulmonares. J Pneumol. 2002;28(Suppl3):S83-S94.
4. Cazzola M, Rogliani P, Curradi G, Segreti A, Ciaprini C, Pezzuto G, et al. A pilot comparison of helium dilution and plethysmographic lung volumes to assess the impact of a long-acting bronchodilator on lung hyperinflation in COPD. Pulm Pharmacol Ther. 2009;22(6):522-5. http:// dx.doi.org/10.1016/j.pupt.2009.05.005 PMid:19481169 5. O‘Donnell CR, Bankier AA, Stiebellehner L, Reilly JJ,
Brown R, Loring SH. Comparison of plethysmographic and helium dilution lung volumes: which is best for COPD? Chest. 2010;137(5):1108-15. http://dx.doi.org/10.1378/ chest.09-1504 PMid:20022972 PMCid:PMC2862399 the two techniques showed that they provide
comparable results in individuals without airflow obstruction but show differences of up to 34% in patients with more severe obstruction.(7,12,19)
One of the statistical resources that we used in order to compare the findings of WBP with those of the SBHD method was the linear correlation test. The test showed a correlation of 0.92 in the individuals with normal spirometry results or RLD and of 0.55 in the patients with OLD. A correlation of 0.98 between TLCWBP and TLCSBHD in 32 normal individuals and of 0.70 between TLCWBP and TLCSBHD in patients with OLD had previously been reported.(27) However, in our study, Bland-Altman plots(18) were used for analysis of the lung volumes as measured by the two methods and showed that, despite a strong correlation between the two in the individuals with normal spirometry results, there was discordance between the two methods in that group of patients. The concordance between the two methods for determining lung volumes was better in the group of patients with RLD, as evidenced by a narrower 95% CI and a higher concentration of data around the mean. In contrast, in the group of patients with OLD, the difference between the two methods was more pronounced, especially in the patients with high lung volumes. The limitations of using linear correlation in order to evaluate the performance of two methods for measuring the same variable have previously been described, as have the advantages of using Bland-Altman plots in such cases.(22)
The linear regression equations that allow us to estimate TLCWBP and RVWBP values on the basis of TLCSBHD and RVSBHD values adjusted for the degree of airflow obstruction constitute an important contribution of our study. These equations can be used in patient care in situations in which only spirometry and pulmonary diffusing capacity testing are available. Although equations for TLC adjusted for the degree of airflow obstruction have previously been described,(7) the gold standard used was the multiple-breath helium dilution technique rather than WBP. Considering the coefficients of determination for the regression equations developed in our study, we emphasize that most of the difference between the two methods remains unexplained.
18. Bland JM, Altman DG. Statistical methods for assessing agreement between two methods of clinical measurement. Lancet. 1986;1(8476):307-10. http://dx.doi.org/10.1016/ S0140-6736(86)90837-8
19. Cliff IJ, Evans AH, Pantin CF, Baldwin DR. Comparison of
two new methods for the measurement of lung volumes with two standard methods. Thorax. 1999;54(4):329-33. http://dx.doi.org/10.1136/thx.54.4.329 PMid:10092694 PMCid:PMC1745479
20. Garfield JL, Marchetti N, Gaughan JP, Steiner RM, Criner GJ. Total lung capacity by plethysmography and high-resolution computed tomography in COPD. Int J Chron Obstruct Pulmon Dis. 2012;7:119-26. http:// dx.doi.org/10.2147/COPD.S26419 PMid:22399851 PMCid:PMC3292389
21. Schünemann HJ, Dmochowski J, Campbell LA, Grant BJ. A novel approach for quality control of total lung capacity in the clinical pulmonary function laboratory: a study in a veteran population. Respirology. 2003;8(3):365-70. http://dx.doi.org/10.1046/j.1440-1843.2003.00487.x PMid:12911832
22. Spence DP, Kelly YJ, Ahmed J, Calverley PM, Pearson MG. Critical evaluation of computerised x ray planimetry for the measurement of lung volumes. Thorax. 1995;50(4):383-6. http://dx.doi.org/10.1136/thx.50.4.383 PMid:7785011 PMCid:PMC474286
23. Roberts CM, MacRae KD, Seed WA. Multi-breath and single breath helium dilution lung volumes as a test of airway obstruction. Eur Respir J. 1990;3(5):515-20. PMid:2376248
24. Dykstra BJ, Scanlon PD, Kester MM, Beck KC, Enright
PL. Lung volumes in 4,774 patients with obstructive lung disease. Chest. 1999;115(1):68-74. http://dx.doi. org/10.1378/chest.115.1.68 PMid:9925064
25. Garcia-Rio F, Dorgham A, Galera R, Casitas R, Martinez
E, Alvarez-Sala R, et al. Prediction equations for single-breath diffusing capacity in subjects aged 65 to 85 years. Chest. 2012;142(1):175-84. http://dx.doi.org/10.1378/ chest.11-2021 PMid:22194584
26. Brugman TM, Morris JF, Temple WP. Comparison of
lung volume measurements by single breath helium and multiple breath nitrogen equilibration methods in normal subjects and COPD patients. Respiration. 1986;49(1):52-60. http://dx.doi.org/10.1159/000194859 PMid:3513268
27. Mitchell MM, Renzetti AD Jr. Evaluation of a
single-breath method of measuring total lung capacity. Am Rev Respir Dis. 1968;97(4):571-80. PMid:5644321 6. Pappas GP, Brodkin CA, Sheppard L, Balmes J, Horike
M, Barnhart S. The validity of radiographic estimation of total lung capacity in patients with respiratory disease. Chest. 1998;114(2):513-20. http://dx.doi.org/10.1378/ chest.114.2.513 PMid:9726739
7. Punjabi NM, Shade D, Wise RA. Correction of single-breath helium lung volumes in patients with airflow obstruction. Chest. 1998;114(3):907-18. http://dx.doi. org/10.1378/chest.114.3.907 PMid:9743183
8. Wanger J, Clausen JL, Coates A, Pedersen OF, Brusasco
V, Burgos F, et al. Standardisation of the measurement of lung volumes. Eur Respir J. 2005;26(3):511-22. http:// dx.doi.org/10.1183/09031936.05.00035005 PMid:16135736 9. Menna Barreto SS, Cavalazzi AC. Determinação dos
volumes pulmonares: métodos de mensuração dos volumes pulmonares. J Pneumol. 2002;28(Suppl3):S95-S100. 10. Crapo RA. Pulmonary function testing. In: Baum GL,
Crapo JD, GlassRoth J, Karlinsky JB, Celli BR. Textbook of Pulmonary Disease. Philadelphia: Lippincott-Raven; 1998. p. 199-218.
11. Kilburn KH, Miller A, Warshaw RH. Measuring lung volumes in advanced asbestosis: comparability of plethysmographic and radiographic versus helium rebreathing and single breath methods. Respir Med. 1993;87(2):115-20. http:// dx.doi.org/10.1016/0954-6111(93)90138-P
12. Milite F, Lederer DJ, Weingarten JA, Fani P, Mooney AM,
Basner RC. Quantification of single-breath underestimation of lung volume in emphysema. Respir Physiol Neurobiol. 2009;165(2-3):215-20. http://dx.doi.org/10.1016/j. resp.2008.12.009 PMid:19150417 PMCid:PMC2759678 13. Pereira CA, Sato T, Rodrigues SC. New reference values
for forced spirometry in white adults in Brazil. J Bras Pneumol. 2007;33(4):397-406. http://dx.doi.org/10.1590/ S1806-37132007000400008 PMid:17982531 14. Crapo RO, Morris AH. Standardized single breath normal
values for carbon monoxide diffusing capacity. Am Rev Respir Dis. 1981;123(2):185-9. PMid:7235357 15. Crapo RO, Morris AH, Clayton PD, Nixon CR. Lung volumes
in healthy nonsmoking adults. Bull Eur Physiopathol Respir. 1982;18(3):419-25. PMid:7074238
16. Vestbo J, Hurd SS, Agustí AG, Jones PW, Vogelmeier C, Anzueto A, et al. Global strategy for the diagnosis, management, and prevention of chronic obstructive pulmonary disease: GOLD executive summary. Am J Respir Crit Care Med. 2013;187(4):347-65. http://dx.doi. org/10.1164/rccm.201204-0596PP PMid:22878278
17. Pellegrino R, Viegi G, Brusasco V, Crapo RO, Burgos F,
About the authors
Patrícia Chaves Coertjens
Assistant Professor II. Federal University of Piauí, Parnaíba, Brazil.
Marli Maria Knorst
Associate Professor. Federal University of Rio Grande do Sul School of Medicine; and Physician. Department of Pulmonology, Porto Alegre Hospital de Clínicas, Porto Alegre, Brazil.
Anelise Dumke
Adjunct Professor I. Department of Physiotherapy, Federal University of the Pampa (southern Rio Grande do Sul), Uruguaiana, Brazil.
Adriane Schmidt Pasqualoto
Adjunct Professor. Federal University of Santa Maria, Santa Maria, Brazil.
João Riboldi
Full Professor. Federal University of Rio Grande do Sul, Porto Alegre, Brazil.
Sérgio Saldanha Menna Barreto