REPUTATION IN COMPUTER SCIENCE
ALBERTO HIDEKI UEDA
REPUTATION IN COMPUTER SCIENCE
ON A PER SUBAREA BASIS
Dissertação apresentada ao Programa de Pós-Graduação em Ciência da Computação do Instituto de Ciências Exatas da Univer-sidade Federal de Minas Gerais como re-quisito parcial para a obtenção do grau de Mestre em Ciência da Computação.
Orientador: Berthier Ribeiro de Araújo Neto
Coorientador: Nivio Ziviani
ALBERTO HIDEKI UEDA
REPUTATION IN COMPUTER SCIENCE
ON A PER SUBAREA BASIS
Dissertation presented to the Graduate Program in Computer Science of the Uni-versidade Federal de Minas Gerais in par-tial fulfillment of the requirements for the degree of Master in Computer Science.
Advisor: Berthier Ribeiro de Araújo Neto
Co-Advisor: Nivio Ziviani
c
2017, Alberto Hideki Ueda.
Todos os direitos reservados.
Ueda, Alberto Hideki
U22r Reputation in Computer Science on a per Subarea Basis / Alberto Hideki Ueda. — Belo Horizonte, 2017
xxiv, 59 f. : il. ; 29cm
Dissertação (mestrado) — Universidade Federal de Minas Gerais — Departamento de Ciência da
Computação.
Orientador: Berthier Ribeiro de Araújo Neto Coorientador: Nivio Ziviani
1. Computação — Teses. 2. Bibliometria.
3. Ferramentas de busca. 4. Indicadores de ciência. 5. P-score. 6. Classificação da ciência da computação. I. Orientador. II.Coorientador. III. Título.
UNlVERSIDADE FEDERAL DE MINAS GERAlS lNSTITUTO DE C~NClAS EXA T AS
PROGRAMA DE P6S-GRADUACAO EM CltNClA DA COMPUT ACAO
FOLHA DE APROV ACAO
Reputation in computer science on a per subarea basis
ALBERTO HIDEKI UEDA
Dissertayio dcfcndida e aprovada pela banca ex minadora constituida pelos Senborcs·
PROF.13ERTHIER RIBEI o DE ARA(;JO • ncntador
C ncia da ~·omp i.ao -UF~G I .\ I . \
/YVA.(J ~~
P F. 1v10 ZIVIANI -C ricntador
Departamcnto de Ciencia da Computayao - UF~G
P' or.
-4-l~~ks
SDERUcpU.!\,
mnciar'°mpl"'
o • Uf'1G
I-L/,· .{),~~ ' \. P~OF:--Af~R'.A'\-So~RES DA ILVA Departamcnto de Cien~ia da Computayao · UF A.\1
~ - I
/2
(//#'/4~
{c,,,.,~,
't.!t
J,..
L / PROF. EDMU};DO A:LBl.i 0E UE ::iO~ I:. SljNA
COPP·· FRJ
Belo Horizonte, 14 de julho de 2017.
Acknowledgments
I would like to express my gratitude to several people for their support over the course of my master’s degree. First of all, I am specially grateful to Berthier for, in a few words, giving me all support in my life-changing decision of come back to the academia. I always felt he believed in me but I never could understand why. However, his trustful-ness and guidance were vital to bring me here. I am also thankful to Nivio, for giving me a key to LATIN at my first day at UFMG. His pieces of advice, self-motivation, and full commitment to work will always remain with me. I would also like to thank Sabir Ribas very warmly, for being a reference of a good graduate student for me, a focused person, and, most of all, a dear friend.
A great deal of gratitude is due to all professors who also guided or deeply inspired me somehow: Edmundo, Rodrygo, Wagner Meira, Newton, Jussara, Omar, Vinicius dos Santos, and José Coelho. I am also extremely grateful to all my peers at LATIN, who taught me what a good research lab is. In particular, Bruno Laporais, for moti-vating me by simply staying at the lab, Marlon Dias, for our great partnership and his inspirational quest for excellence, Jordan, Felipe, and Rafael.
To my wife Camila, my Wonder Woman, my role model, and my greatest friend, for making this dream possible. Her incommensurable support at every single moment of this journey was more than I could ever have asked for. No words of mine can describe how I am grateful to her.
I must also thank my friends Victor Melo, Rensso Mora, Carlos Caetano, Evelin Amorim, and Sonia Borges, for all their support. And heartfelt thanks to Chris Cornell, whose songs and great voice I listened so much while writing this dissertation.
The next and last paragraph is only in Portuguese because there is no sense of writing in another language.
Resumo
Nesta dissertação, analisamos a reputação de veículos de publicação e programas de pós-graduação em Ciência da Computação (CC) com foco em suas sub-áreas. Para realizar esta tarefa, consideramos as 37 sub-áreas em CC definidas pela Microsoft Aca-demic Research e estendemos uma métrica de reputação baseada em redes de Markov, denominada P-score (Publication Score). Mais especificamente, examinamos o impacto obtido na reputação de conferências, periódicos e programas de pós-graduação no Brasil e nos Estados Unidos (EUA) em CC, ao considerarmos suas sub-áreas. Nossos experi-mentos sugerem que a metodologia proposta produz resultados melhores que métricas basedas em citações. Também apresentamos um panorama das direções de pesquisa atuais do Brasil e dos EUA, que seja, em quais sub-áreas estes países possuem mais trabalhos de destaque no momento. Esta análise de reputação sob a perspectiva de sub-áreas fornece informações adicionais para administradores de universidades, di-retores de agências de fomento a pesquisa e representantes do governo que precisam decidir como alocar recursos de pesquisa limitados. Por exemplo, em CC, sabemos que o volume de publicações científicas nos EUA é significantemente superior ao volume de publicações brasileiras. Porém, este trabalho mostra que as sub-áreas em CC em que cada país possui maior impacto científico são basicamente disjuntas.
Palavras-chave: P-score, Indicadores de Ciência, Classificação da Ciência da
Abstract
In this dissertation, we study the reputation of publication venues and graduate pro-grams in Computer Science (CS) with focus on its subareas. For that we adopt the 37 CS subareas defined by Microsoft Academic Research and extend the usability of a reputation metric based on Markov networks, called P-score (for Publication Score). More specifically, we study the impact to the reputation of CS conferences, journals, and graduate programs in Brazil and US when subareas are taken into account. Our experiments suggest that the extended P-scores yield better results when compared with citation counts. We also present an overview of current research directions of Brazil and US, i.e. on which subareas they have the most prominent work nowadays. This analysis of reputation on a per subarea basis provides additional insights for uni-versity officials, funding agencies directors, and government officials who need to decide how to allocate limited research funds. For instance, it is known that the volume of US scientific publications in CS is significantly larger than to the volume of Brazilian CS research. However, this work shows that the CS subareas in which each country has major scientific impact are basically disjoint.
List of Figures
3.1 Structure of the reputation graph. . . 11 3.2 Markov chain for an example with two graduate programs and three
publi-cation venues. . . 15
5.1 Precision-Recall curves of H-index, P-score and normalized P-score for the subarea of Information Retrieval. . . 26 5.2 Precision-Recall curves of H-index, P-score and normalized P-score for the
subareas of Databases and Data Mining. . . 27 5.3 Distribution of cumulative weighted P-scores for the top 20 US graduate
programs on a per subarea basis. . . 34 5.4 Distribution of cumulative weighted P-scores for the top 20 BR graduate
programs per subarea. . . 35 5.5 Top 20 Graduate Programs for the Information Retrieval subarea,
accord-ing to weighted P-score, consideraccord-ing US and BR graduate programs, usaccord-ing logarithmic-scale. . . 36 5.6 Distribution of cumulative weighted P-scores for the top 20 BR graduate
programs per subarea, in the same subarea order of Figure 5.3. . . 37
A.1 Graph of couauthorships with researchers from the subarea of Computer Networks, using the venue Infocom as source of reputation. This visualiza-tion was generated by Gephi, an open-source framework for manipulating graphs. . . 49 A.2 Graph of couauthorships with researchers from the subarea of Computer
Networks, using the venue TON as source of reputation. . . 50 A.3 Graph of couauthorships with researchers from the subarea of Computer
Networks, using the venue Computer Networks as source of reputation. . . 51 A.4 Graph of couauthorships with researchers from the subarea of Information
A.5 Graph of couauthorships with researchers from the subarea of Information Retrieval, using the venue WSDM as source of reputation. . . 53
List of Tables
1.1 The Microsoft 37 Subareas of Computer Science . . . 3
4.1 Salient statistics of the dataset used in our evaluation. . . 22 4.2 Subareas of Computer Science selected from Microsoft classification. The
full names of the publication venues are presented in Appendix C. . . 23 4.3 Seeds of publication venues for the P-score ranking used in this work. . . . 24
5.1 Top 20 venues in Information Retrieval using (i) standard P-score, (ii) the set of venues selected by the normalized P-score, and (iii) re-ranking the set of venues obtained in (ii) according to their P-scores. The suffixes (c) and (j) are used to differentiate conferences and journals with the same name. The full names of the publication venues are presented in Appendix C. . . 28 5.2 Top 20 venues in Databases, using (i) standard P-score, (ii) the set of venues
selected by the normalized P-score, and (iii) re-ranking the set of venues obtained in (ii) according to their P-scores. The suffixes (c) and (j) are used to differentiate conferences and journals with the same name. The full names of the publication venues are presented in Appendix C. . . 29 5.3 Top 20 venues in Data Mining, using (i) standard P-score, (ii) the set of
venues selected by the normalized P-score, and (iii) re-ranking the set of venues obtained in (ii) according to their P-scores. The suffixes (c) and (j) are used to differentiate conferences and journals with the same name. The full names of the publication venues are presented in Appendix C. . . 30 5.4 Ranking of the top 10 US Universities on Information Retrieval, based on
standard P-scores. . . 30 5.5 Ranking of the top 10 US Universities on Information Retrieval, using the
weighted P-score (Equation 3.11). . . 31 5.6 Ranking of the top 20 US researchers’ universities on Information Retrieval,
5.7 Ranking of the top 10 US Universities on Databases, using the weighted P-score (Equation (3.11)). . . 32 5.8 Ranking of the top 10 US Universities on Data Mining, using the weighted
P-score (Equation (3.11)). . . 33
Contents
Acknowledgments xi
Resumo xv
Abstract xvii
List of Figures xix
List of Tables xxi
1 Introduction 1
1.1 Motivation . . . 2 1.2 Dissertation Statement . . . 4 1.3 Contributions . . . 5 1.4 Dissertation Overview . . . 5
2 Related Work 7
2.1 Academic Search in Broad Areas . . . 7 2.2 Academic Search on a per Subarea Basis . . . 9
3 Reputation Flows and P-score 11
3.1 Reputation Flows . . . 11 3.2 Academic Rankings Based on Standard P-score . . . 13 3.3 The Encroachment Problem . . . 15 3.4 Normalized P-score for Publication Venues . . . 16 3.5 Weighted P-score for Graduate Programs . . . 17 3.6 Comparing Research in Different Subareas . . . 19
4 Experimental Setup 21
4.2 Computer Science Subareas . . . 22 4.3 Venues Ground-Truth . . . 24
5 Experimental Results 25
5.1 Ranking Venues . . . 25 5.2 Ranking US Graduate Programs by Subarea . . . 28 5.3 Ranking BR Graduate Programs by Subarea . . . 34 5.4 Comparing BR and US Research in CS . . . 36
6 Conclusions and Future Work 39
Bibliography 41
Appendix A Clustering Computer Science 47
A.1 Markov Cluster Algorithm . . . 47 A.2 Preliminary Results . . . 48 A.3 Next Steps . . . 48
Appendix B CS Subareas According to Different Sources 55
Appendix C List of Abbreviations for Publication Venues 57
Chapter 1
Introduction
Funding agencies, university officials, and department chairs constantly face the chal-lenge of understanding how well the researchers they employ or sponsor are doing in terms of academic productivity and scientific impact. The assessment of their research quality usually includes the use of quantitative measures (e.g., citation counts, H-index) or qualitative surveys within their scientific community. For instance, in the United States (US), the National Research Council (NRC) applied in 2010 an extensive survey to gather information about more than one hundred US graduate programs.
Overall, such assessments aim to capture thereputation of each scholar or gradu-ate program. That is, the perception of the researcher (or group of researchers) before the general public or before her (or its) academic peers. In principle, researchers with high reputation should receive priority treatment in the allocation of grants, research funds, scientific awards, and graduate students than less reputable ones within the same community.
However, even the aforementioned NRC attempt to present an evidence-based ranking of US graduate programs has not been accepted without controversy [Vardi, 2016]. Additionally, allocating research funds with basis on an unidimensional ranking of graduate programs in a given area ignores the complex interplay between individual traits and program’s unique patterns of strengths and weaknesses. While private or-ganizations are also able to produce such rankings, it has been argued that in this way third-party business interests may influence academic values [Brembs et al., 2013].
2 Chapter 1. Introduction
1.1
Motivation
The decision on which researchers should be hired, promoted, granted funding or awarded is typically based on criteria such as number of publications, impact of publi-cations, number of students under supervision, number of advised MSc and PhD theses, and participation in committees (conferences, program committees, journal editorial boards, technical committees). The decision ultimately depends on how each criterion is assessed and the period of time covered in the assessment. To assist in the decision making process, several indices have become widely used to measure the productivity of researchers. Examples include the raw number of citations, h-index [Hirsch, 2005], g-index [Egghe, 2006] and citation z-score [Lundberg, 2007]. Likewise, most academic search platforms, such as Google Scholar,1 Microsoft Academic Search,2 and AMiner3 provide estimates for such indices.
However, ranking researchers without regarding the specificity of their subareas or sub-fields of research is arguably unfair and potentially error-prone [Lima et al., 2013]. For instance, consider the problem of comparing the research output of two different researchers, where the first one works on a subareaA and the second one works on a
subarea B. If we assume that it is inherently harder to publish articles in A than in B, it seems natural that the metrics used to rank these researchers should be distinct,
or, at least should take the differences among subareas into account. Otherwise, the comparison between them would be unfair.
As an illustration, consider the subarea of Human-Computer Interaction within the broad field of CS. Experimental evaluation in this area usually takes more time than in other CS subareas when arranging and assessing users’ feedback is necessary [Wainer et al., 2013]. On the other hand, CS subareas such as Databases and Computer Graph-ics do not usually face the same problem because their experimental evaluations depend on assessing the outcome of an automatic process, such as a query evaluation or a graph-ics rendering engine. Likewise, researchers working on a given subarea may have fewer publications than others, but with a potentially higher impact in their community.
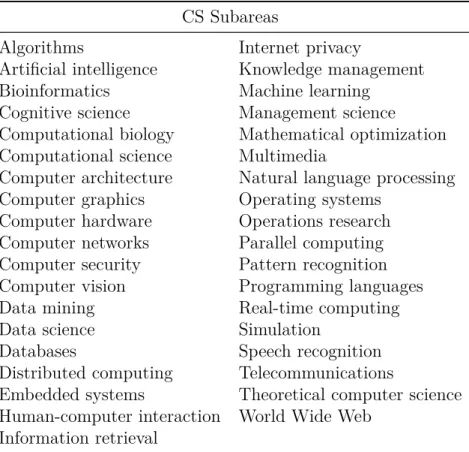
To have a better understanding of this current problem in academic rankings, see the scenario of CS in Table 1.1. It contains a list of 37 subareas of CS according to Microsoft Academic Search. Although many studies in the literature show that there are significant differences in CS subareas’ publication patterns [Hoonlor et al., 2013; Lima et al., 2015; Wainer et al., 2013], several institutions responsible for evaluating
1
http://scholar.google.com 2
http://academic.research.microsoft.com 3
1.1. Motivation 3
Table 1.1. The Microsoft 37 Subareas of Computer Science
CS Subareas
Algorithms Internet privacy
Artificial intelligence Knowledge management
Bioinformatics Machine learning
Cognitive science Management science
Computational biology Mathematical optimization Computational science Multimedia
Computer architecture Natural language processing Computer graphics Operating systems
Computer hardware Operations research Computer networks Parallel computing Computer security Pattern recognition Computer vision Programming languages
Data mining Real-time computing
Data science Simulation
Databases Speech recognition
Distributed computing Telecommunications
Embedded systems Theoretical computer science Human-computer interaction World Wide Web
Information retrieval
graduate programs do not take those differences into account.
In Brazil, for instance, as in several other countries, the graduate programs are evaluated by a funding agency. This agency, called CAPES,4 runs periodic evalua-tions of graduate programs and uses citation-based metrics to rank all publication conferences and journals. Specifically, it ranks the graduate programs based on their publication records and other features such as courses taught, number of students graduated, average time to graduate a student, and department infrastructure. In this evaluation model, the ranking of publication venues is decisive on identifying the most reputable graduate programs. Thus, if the ranking of venues does not take into account the differences in subareas, the evaluation of graduate programs runs the risk of being very biased towards criteria such as popularity or raw publication volume [Souza e Silva and Maldonado, 2009].
Moreover, the distribution of grants, scholarships, and awards are also based on metrics computed from the perspective of the broad area of CS. Further, funding agencies as CNPq5impose quantitative limits on the number of research grants awarded
4
Foundation for the Coordination and Improvement of Higher Level or Education Personnel. http://capes.gov.br
5
4 Chapter 1. Introduction
to researchers working on any given broad area of knowledge, such as CS [Navaux et al., 2017]. Thus, one can realize that the most popular subareas in CS have large advantages in this classification process over the other subareas in CS. Given that, there is a necessity to take a closer look at these academic scenarios from a perspective of subareas.
1.2
Dissertation Statement
We claim that general purpose rankings of CS graduate programs, rankings based on weights associated with the venues in the broad area of knowledge without consider-ation to particularities of subareas, may not reflect important informconsider-ation about the academic excellence of these programs. For instance, if the government intends to stimulate research groups working on a specific subarea, such as Machine Learning, a general ranking in the broad area of CS will not facilitate the decision.
In particular, this dissertation aims to answer the following research questions:
• Q1. How to quantify the reputation of publication venues and graduate programs on a per subarea basis?
• Q2. How does the reputation of Brazilian and US graduate programs in CS vary
per subarea?
• Q3. Are there differences between the current research directions in CS of the
top Brazilian and US graduate programs?
1.3. Contributions 5
1.3
Contributions
Our main contributions are:
• Contribution 1: A novel reputation metric for academic rankings on a per subarea
basis.
• Contribution 2: An analysis of research output in Computer Science in Brazil
and US on a subarea level.
• Contribution 3: A comparison between the current research directions in CS of
Brazil and US and insights on the differences in research interests of each country.
1.4
Dissertation Overview
Chapter 2
Related Work
In this chapter, we describe related work on academic search considering the broad areas of knowledge (Section 2.1) and on a per subarea basis (Section 2.2).
2.1
Academic Search in Broad Areas
Garfield’s Impact Factor [1955] is one of the first metrics proposed to quantify research impact. It has been widely used nowadays to measure relative importance of a scientific journal within its field. In a nutshell, it indicates the average number of citations per publication of a journal, in the last two years. Despite its wide usage since it was proposed in 1955, it has been largely criticized [Saha et al., 2003]. Accordingly, several alternatives have been proposed in the literature, such as other citation-based metrics [Egghe, 2006; Waltman et al., 2011; Sun and Giles, 2007; Waltman et al., 2011; Yan et al., 2011; Lundberg, 2007], download-based metrics [Bollen et al., 2005], PageRank-like metrics [Gollapalli et al., 2011; Yan and Lee, 2007], and community-based features [Silva et al., 2014].
8 Chapter 2. Related Work
The idea of reputation, without the direct use of citation data, was discussed by Nelakuditi et al. [2011]. They proposed a metric called peers’ reputation for research conferences and journals, which ties the selectivity of the publication venue based upon the reputation of its authors’ institutions. The proposed metric was shown to be a bet-ter indicator of selectivity of a research venue than acceptance ratio. In addition, the authors observed that, in the subarea of Computer Networks, many conferences have similar or better peers’ reputation than journals. This result is similar to the con-clusions obtained by Laender et al. [2008], who show that conference publications are important vehicles for disseminating CS research, while in other areas such as Physical Science and Biology the most relevant venues are arguably the scientific journals.
Regarding the assessment of individual researchers’ influence and expertise, many approaches have been introduced [Balog, 2012; Cormode et al., 2014; Deng et al., 2012; Gollapalli et al., 2011; Wu et al., 2009]. Particularly, Gonçalves et al. [2014] quantified the impact of various features on a scholar popularity throughout her career. Specif-ically, they analyzed how features that capture the number and rate of publications, number and quality of publication venues, and the importance of the scholar in the co-authorship network relate to the scholar popularity, by applying regression analysis. They concluded that, even though most of the considered features are strongly corre-lated with popularity, only two features are needed to explain almost all the variation in popularity across different researchers: the number of publications and the average quality of the scholar’s publication venues. This finding is one of the hypotheses for the reputation model introduced by Ribas et al. [2015b].
In addition, the prediction of scientific success of a researcher is also valuable for several goals, for example, hiring faculty members, guiding funding agencies in their decision processes and improving scholar rankings in academic search engines [Nezhad-biglari et al., 2016]. As a result, previous work attempted to predict if a researcher will become a principal investigator [Dijk et al., 2014], her future H-index [Dong et al., 2015; Penner et al., 2013] and the potential number of citations to her publications [Castillo et al., 2007; Mazloumian, 2012].
Although citation-based metrics are useful, they are not enough to do a complete evaluation of research. In particular, Piwowar [2013] showed that metrics as the H-Index are slow, as the first citation of a scientific article can take years. He concludes that the development of alternative metrics to complement citation analysis is not only desirable, but a necessity.
2.2. Academic Search on a per Subarea Basis 9
consist in a random walk model where the reputation of a target set of entities is inferred using suitable sources of reputation. To evaluate this model, they instantiated the reputation flows in an academic setting, proposing a novel metric for academic reputation, the P-score [Ribas et al., 2015a]. Instead of relying on standard citation-based approaches for identifying reputable venues and researchers, P-score captures publishing behavior as a reputation signal, using a few highly reputable sources (e.g., reputable publication venues). For a better understanding of both the extension we propose and the methodology we adopted in this work, we provide in Chapter 3 more detailed information about the reputation flows model and its instantiation in the academic domain.
By and large, the aforementioned works or variations of them are commonly used in assessments of academic output and also by modern search engines for scien-tific digital libraries, such as Google Scholar1, Microsoft Academic Search2, AMiner3, and CiteSeerX4. However, none of the referred metrics take into account the differ-ent publication patterns in the subareas. Studies suggesting those differences and the negative impact of uniform evaluation metrics have been discussed in the field of Eco-nomics [Kapeller, 2010; Lee et al., 2010] and in Computer Science [Hoonlor et al., 2013; Benevenuto et al., 2015; Lima et al., 2013].
2.2
Academic Search on a per Subarea Basis
Alves et al. [2013] and Benevenuto et al. [2015] analyze the structure of the communities formed by the flagship conferences of ACM SIGs. Their findings show that most of the ACM SIGs are able to connect their main authors in large and visually well-structured communities. However, they note that a few conferences, such as the ACM Symposium on Applied Computing, flagship conference of SIGAPP, and the ACM Conference on Design of Communications, flagship conference of SIGDOC, do not form a strong re-search community, presenting a structure with several disconnected components. They have opened their results to the research community as an interactive visualization tool5 that allows one to browse the scientific communities, visualizing their structures and the contribution of each specific researcher to connect its coauthorship graph. The concept of scientific community and its natural development enforced the clustering approach we initially adopted in this work.
1
https://scholar.google.com.br 2
http://academic.microsoft.com 3
http://aminer.org 4
http://citeseerx.ist.psu.edu 5
10 Chapter 2. Related Work
Several comparative studies on research productivity between nations have been presented, for improving evaluation metrics [Laender et al., 2008], characterizing re-search development in different regions of the world [Menezes et al., 2009], or suggesting directions to improve scientific production and impact [Wainer et al., 2009]. In con-strast with these aforementioned works, we are the first to perform this comparison using the reputation model proposed by Ribas et al. [2015b] and its derived metric, called P-score.
Lima et al. [2013] showed how important the subareas of expertise are when assessing research profiles in Computer Science, proposing the ca-index, a cross-area metric for ranking researchers by aggregating their productivity indexes across mul-tiple areas. Likewise, they aimed to improve the reputation assessment of authors with interdisciplinary research output. In contrast, we propose to assess reputation of researchers in each CS subarea independently, treating each subarea as a different research community.
Wainer et al. [2013] presented the first attempt to quantify the differences in pub-lication and citation practices between the subareas of Computer Science. Their key findings were: i) there are significant differences in productivity across some CS subar-eas, both in journals (e.g., Bioinformatics has a significantly higher productivity than Artificial Intelligence) and in conferences (e.g., Image Processing and Computer Vision has a significantly higher productivity than Operational Research and Optimization), ii) the mean number of citations per paper varies depending on subarea (e.g., Man-agement Information Systems has significantly higher citation rates per paper than Computer Architecture), and iii) there are significant differences in emphasis on pub-lishing in journals or in conferences (e.g., Bioinformatics are clearly journal oriented while Artificial Intelligence are conference oriented). However, they do not focus on modeling a new productivity metric for academic domain taking into account those differences between the subareas.
The idea of using normalized metrics to assess the reputation of academic entities on a per subarea basis was inspired by previous works in the literature [Leydesdorff et al., 2013; Glänzel et al., 2011; Opthof and Leydesdorff, 2010; Waltman and Eck, 2013]. Such metrics were proposed to consider the differences in publication and cita-tion practices among research subareas.
Chapter 3
Reputation Flows and P-score
In this chapter, we describe the reputation model we adopted as reference and the modifications we propose to it, in order to obtain rankings of academic entities on a per subarea basis. Specifically, in Sections 3.1 and 3.2, we summarize the key points of the Reputation Flows’ model and its derived metric for academic search, the P-score, proposed by Ribas et al. [2015a]. This introduction is essential to comprehend the modifications we propose for the reputation model to take subareas into account. The motivation for such adjustments is described in Section 3.3. Then, in Sections 3.4 and 3.5, we discuss in detail our ideas to consider a per subarea basis and the specific modifications aimed towards this purpose.
3.1
Reputation Flows
While quantifying the reputation of a given entity is a challenging task, Ribas et al. [2015b] argue that the flow of reputation among entities can be accurately modeled as a stochastic process. To this end, they proposed a conceptual framework for ranking entities that convey reputation to one another. They introduced a reputation graph, a data structure that models the flow of reputation from selected sources to multiple targets and then formalized a stochastic process to estimate the amount of reputation transferred to target entities. This model was called reputation flows.
12 Chapter 3. Reputation Flows and P-score
The interaction between reputation sources and reputation targets is inspired by the notion of eigenvalue centrality in complex networks, which also provides the foundation to PageRank [Brin and Page, 1998]. In particular, let S be the set of
reputation sources, T the set of reputation targets, and P be a stochastic matrix of size (|S|+|T|)×(|S|+|T|) with the following structure:
P=
δs· P1
S×S (1−δs)· P2 S×T
(1−δt)· P3 T×S
δt· P4 T×T
, (3.1)
where each quadrant represents a distinct type of reputation flow. Matrix Pdepends
on the following matrices:
• P1: stochastic matrix of size |S| × |S| representing the transition probabilities between reputation sources;
• P2: matrix of size |S| × |T| representing the transition probabilities from repu-tation sources to targets;
• P3: matrix of size |T| × |S| representing the transition probabilities from repu-tation targets to sources;
• P4: stochastic matrix of size |T| × |T| representing the transition probabilities
between reputation targets.
The parametersδsandδtcontrol the relative importance of the reputation sources
and targets, which are modeled in the four matrices above. Specifically,δs∈[0,1] is the
fraction of reputation one wants to transfer between source nodes andδt∈[0,1] is the
fraction of reputation one wants to transfer between target nodes. These parameters are useful to calibrate the impact of different types of reputation flows in the final reputation score.
Note that, as (i) the sub-matrices P1 and P4 are stochastic and (ii) each of the rows of matricesP2 and P3 sums to 1, then Pdefines a Markov chain. Assuming that the transition matrixPis ergodic, we can compute the steady state probability of each
node and use it as a reputation score.1 Specifically, we can obtain values for ranking the set of nodes by solving:
1
3.2. Academic Rankings Based on Standard P-score 13
π =πP, (3.2)
where π is a row matrix with |S|+|T| elements, each one of them representing the
probability of a node in the set S∪T. This system of linear equations can be solved by
standard Markov chain techniques, as the Power Method.2 Then, we obtain the steady state probabilities of all nodes in S∪T (reputation sources and reputation targets).
In short, the steady state probability of an entity is interpreted as its relative reputation, as transferred from other entities in a reputation graph. Subsequently, the reputation of the target nodes can be further propagated to entities we want to compare, in the collateral set C, as shown in Figure 3.1. This propagation depends on
a matrix PC of size |T| × |C| representing the transitions from reputation targets to
collateral entities. More generally, the P-score of an entity e is defined as:
P-score(e)=
X
t∈T
pt,e·πt if e∈C
πe otherwise
(3.3)
where pt,e ∈ PC is the transition weight from a target entity t ∈ T to an entity e, πe ∈ π is the reputation of entity e, πt ∈ π is the reputation of target entity t. The
P-score of all candidate entities (targets or collaterals) can then be used to produce an overall reputation-oriented ranking of these entities.
As shown by Ribas et al. [2015b], the conceptual framework of reputation flows could be instantiated in the academic research domain, for instance, by modeling the transference of reputation between authors, papers, graduate programs and publication venues. In their experiments, they study how the reputation of a reference set of graduate programs is propagated to the venues they publish in, i.e., graduate programs are seen as reputation sources and publication venues as reputation targets. In the next section, we discuss this instantiation of reputation flows in the academic search domain.
3.2
Academic Rankings Based on Standard P-score
Let us concentrate our attention on the problem of ranking reputation in the aca-demic research domain. In this case, key entities of interest are researchers, graduate programs, papers, and publication venues. The hypotheses supporting the standard P-score metric (i.e., as it was originally proposed) are:
2
14 Chapter 3. Reputation Flows and P-score
1. A graduate program conveys reputation to a publication venue proportionally to its own reputation.
2. A publication venue conveys reputation to a graduate program proportionally to its own reputation.
The basic idea of the standard P-score is to associate a reputation with publication venues based on the publication patterns of a reference set of graduate programs. Given a pre-selected set of reference graduate programs, P-score associates weights with the publication venues the researchers in the reference graduate programs publish in, by solving a system of linear equations relating those entities in the reputation graph (see Equation 3.2). Further, these weights can be used to rank publication venues (by considering these weights as venue scores) and also to rank graduate programs or authors.
In particular, using graduate programs (set G) as reputation sources,
publica-tion venues (set V) as reputation targets, and adopting δs = 0 and δt = 0, we have
an instance of matrix P of Equation 3.1 for reputation flows in the academic search
domain: P=
0 Pi
G×V
Pii V×G
0
, (3.4)
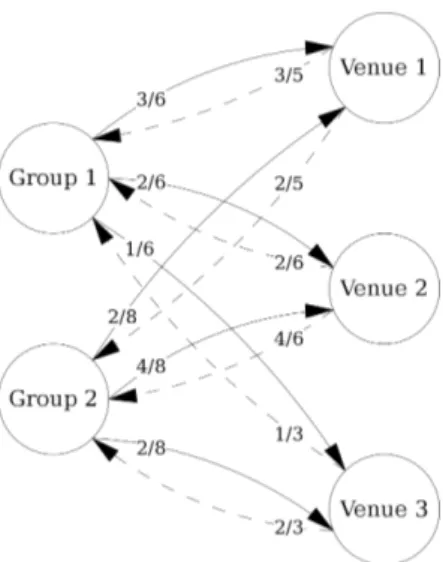
where each quadrant represents a distinct type of reputation flow in the academic search domain. Figure 3.2 shows an example with two graduate programs (Groups 1 and 2) used as reputation sources and three venues used as reputation targets.
From Figure 3.2, Group 1 published three papers in Venue 1, two papers in Venue 2, and one paper in Venue 3. Then, the number of publications of Group 1 is six. Venue 1 receives three papers from Group 1, and two papers from Group 2. The fractions of publications from groups to venues and from venues to groups are the edge weights.
Ribas et al. [2017] have also suggested different possible configurations for the reputation graph. In fact, the sources and collaterals can be any of the three types of entity we consider, i.e., publication venues, authors, and graduate programs. The targets, however, must always be entities of type venue. That is, we should always use the reputation of venues as the key feature for ranking venues, graduate programs, and individual authors.
3.3. The Encroachment Problem 15
Figure 3.2. Markov chain for an example with two graduate programs and three publication venues.
3.3
The Encroachment Problem
Initially, based on the concepts and usability of the standard P-score, we consider a simple hypothesis: to rank academic entities on a per subarea basis, it would be sufficient to use the right reputation sources within a subarea and compute the steady state probabilities of all academic entities. As a result, in theory, the entities with higher P-scores would be the most reputable entities within a subarea. For instance, using as reputation sources the most important venues in Information Retrieval, we would find the most reputable authors, graduate programs, and publication venues in the subarea of IR.
Likewise, the instantiation of P-score in these first experiments, based on one of the possible configurations suggested by Ribas et al. [2015b], was as follows: given a pre-selected set of reference venues (or seeds) in a given subarea, e.g., conferences or journals, the metric finds the n researchers with the largest volume of publications in
these reference venues (for instance, n = 200) and uses them to assemble the Markov
network model which also includes all venues in which they published. The steady state probabilities are interpreted as venue weights that distinguish high reputation venues from the others. Thus, these weights can be used to rank venues (by considering these weights as venue scores) and also to rank graduate programs or authors.
16 Chapter 3. Reputation Flows and P-score
It is a high reputation venue that covers three subareas: Databases (DB), Information Retrieval (IR), and Knowledge Management (KM). If we are interested in the subarea of IR in particular, we need to find a way to discount or weigh down the contributions of CIKM papers that are not on IR. If we do not, we might end with large P-score contributions to a given subarea, such as IR, from papers that are really from another subarea, such as DB. This is what we call the encroachment problem.
We illustrate this problem with an example. Elisa Bertino is a well known and respected researcher who has published over 800 papers. Her interests cover many areas with focus on the fields of Information Security and DB systems. She has papers accepted by CIKM and other venues that also accept papers on IR. Because of that, she appears on the list of authors that publish frequently on IR related venues. And, because of the large number of papers she publishes, her P-score on IR is high, which leads to a high rank of her graduate program at Purdue University on the subarea of IR.
Given that CIKM does not distinguish in its proceedings which papers are on IR, DB or KM, determining whether a given CIKM paper is on IR, for instance, would require examining its text contents. However, P-score is a metric that does not rely on paper contents — one of its inherent advantages given that it is much simpler to compute than citation-based metrics. Thus, imposing the need to have access to the contents of papers is a constraint we purposely want to avoid. Therefore, we look for a different solution, described in the next section.
3.4
Normalized P-score for Publication Venues
As our primary goal is to perform analysis of academic entities on a per subarea basis, it is crucial to investigate how we could identify suitable publication venues to characterize subareas.
As originally proposed, P-score venue weights do not allow distinguishing venues in a given subarea, even if we choose as seeds venues that are central to that subarea (i.e., venues which are surely focused on that subarea). This occurs because P-score is a metric strongly correlated to the volume of publications. In other words, venues with high popularity that are related to the seeds — i.e., have papers written by the authors used as seeds (or references) in the network — are put in the top positions by the raw P-score.
3.5. Weighted P-score for Graduate Programs 17
reputation of the venue on a per paper basis. This approach penalizes venues with a large volume of publications but with low P-scores (low reputation according to the seeds) and boosts smaller publication venues with good reputation in a given subarea. Thus, the normalized P-score for venue v is defined as:
norm-P-score(v)= P-score(v)
number_of_publications(v) (3.5)
Equation (3.5) is the starting point for obtaining the ranking of graduate pro-grams on a per subarea basis, as presented in the following section.
3.5
Weighted P-score for Graduate Programs
In order to facilitate understanding the modifications we propose for the standard P-score to rank graduate programs by subareas, let us rewrite some equations of standard P-score in a clearer and more concise way than using the whole conceptual framework of reputation flows, focusing on ranking graduate programs itself.
Evaluating a specific graduate program requires weighting the contributions of its members who are responsible for the reputation of the program. Like Ribas et al. [2015b], we say that a group’s reputation is the sum of the reputation of the venues its members have published in, taken on a per author basis. Moreover, a research publication is usually a combination of efforts by multiple researchers. In consequence, we should normalize the paper’s P-score by the number of authors. Thus:
P-score(g)= X p∈θ(g)
P-score(venue(p))
number_of_authors(p) (3.6)
where θ(g) is the set of publications of graduate programg and venue(p) is the venue in which paper pwas published. In other words, the reputation of a graduate program
is based on the papers it published. Each paper has a reputation itself, which is given by the venue where the paper was published.
18 Chapter 3. Reputation Flows and P-score
as the anchors for the transference of reputation to research groups and, subsequently, to the graduate programs these research groups belong to. Notice that, in this case, the indication of the faculty member’s affiliation is key to estimate the reputation for graduate programs. Hence, Equation (3.6) may be rewritten as:
P-score(g)= X a∈φ(g)
X
p∈θ(a)
P-score(venue(p))
number_of_authors(p) (3.7)
where φ(g) are the researchers associated with graduate program g and θ(a) are the
publications of author a.
Except for the normalization by the number of authors in a paper (which we propose), the Equation 3.7 is an alternative way of showing how the standard P-score metric ranks graduate programs, as stated by Equation 3.3, in Section 3.1. However, recap that standard P-score does not provide good ranking of graduate programs on a per subarea basis, due to the encroachment problem described in Section 3.3.
The solution we propose to the encroachment problem is to examine the main subareas of interest of each researcher and produce weights for the pairs [researcher, subarea]. We do so by examining the publications of the researchers on
venues that are specific to a single subarea such as SIGIR and SIGMOD, for instance. Our rational is that a researcher that publishes eight SIGIR papers and two SIGMOD papers is focused on IR 80% of the time and on DB 20% of the time. In other words, this researcher interest factor on IR is 0.8 and on DB is 0.2. We then use thissubarea interest factor (hereinafter referred as factor γ) to weigh the papers of this author
in venues that cover multiple subareas, such as CIKM. That is, instead of solving a classification problem (determine the subarea of each CIKM paper), which would re-quire access to paper contents, we propose a ranking solution that ranks CIKM papers on each of its subareas based on their authors’ interest factors. Our ranking solution simplifies the implementation and leads to good results, as discussed in Chapter 5.
For that, firstly we compute the normalized P-score (Section 3.4) to every pub-lication venue based on a subarea s (e.g., Information Retrieval). We claim that the
normalized P-score indicates the level of convergence between the publication records of a venue and the specific interests of the subarea. This claim is supported by our results discussed in Chapter 5. Then, the set Vs of venues more restricted to that
subareas is defined as:
Vs ={v ∈V | norm-P-score(v)> αs} (3.8)
3.6. Comparing Research in Different Subareas 19
for venue v and αs is a threshold defined by manual inspection of the venues with the
highest normalized P-scores for the subarea s.
Once the setVs is defined, we can measure the reputation of authors (and
conse-quently, graduate programs) on a per subarea basis. With Vs being the set of venues
closely associated with subareasandθ(a) the set of publications of authora, as before,
we define:
γ’(a, s) = 1 |θ(a)|
X
p∈θ(a)
1 ifp∈Vs
0 otherwise (3.9)
where γ’(a, s) is the interest factor of author a in subarea s, i.e., a measure of how
much the author belongs to that subarea.
Factor γ’ quantifies the relation of authors to a given subarea but does not take
into account the history of publications by a given author. If an author changes their field of study, we should factor in that the author’s relation to the subarea of interest has weakened. We do so by introducing a publication age penalty, as follows:
γ(a, s) = 1 |θ(a)|
X
p∈θ(a) 1
log2(y(0)−y(p)+2) if p∈Vs
0 otherwise (3.10)
where y(p) is the year in which the paperpwas published andy(0) is the current year,
or the year of the most recent paper in the collection.
Using the subarea interest factor we can rewrite Equation (3.7) and present the weighted P-score of a graduate program g in subarea s as:
weighted-P-score(g, s)= X a∈φ(g)
γ(a, s)× X p∈θ(a)
P-score(venue(p))
number_of_authors(p) (3.11)
The experimental results of these approaches are presented in Chapter 5. In the next section, we describe some considerations on using weighted P-scores to compare research output across different subareas.
3.6
Comparing Research in Different Subareas
20 Chapter 3. Reputation Flows and P-score
shown in Chapter 3, P-score provides encouraging results in ranking academic entities. We aim to show that this metric, when applied to CS graduate programs, allows us to gain valuable insights about the divergences in current publication patterns between different countries.
One final caveat. When we compute P-scores on a per subarea basis, we run a stochastic computation for each subarea. A direct side effect is that P-scores of each subarea, which represent steady state probabilities in a Markov network, are scaled up to sum up to 1. For comparisons among subareas, this is a problem. In particular, smaller venues might receive disproportionately high relative P-scores due to stochastic scaling in a given subarea.
Chapter 4
Experimental Setup
In this chapter, we describe the setup supporting our experiments and the key assump-tions we have considered on assessing reputation in academia. Specifically, we provide details of the academic dataset we used in this work, the CS subareas considered, the methods we adopted, and previous results used as starting points to our present analysis.
4.1
Dataset
We compiled a collection of academic publications records extracted from DBLP,1 an online reference for bibliographic information on major CS publications. DBLP data has been used in related studies on CS research communities [Biryukov and Dong, 2010; Delgado-Garcia et al., 2014; Hoonlor et al., 2013; Laender et al., 2008; Wainer et al., 2013]. The dataset is publicly available in XML format and contains more than three million publication records from more than 1.5 million authors over the last 50 years, albeit the data before 1970 is rather irregular. Each publication record includes a title, list of authors, year of publication, and publication venue. Publication records do not include the contents of the papers neither information related to citations.
Our collection is actually an extension of the DBLP repository. While it contains all publication venues and authors from DBLP, we have enriched it by adding data regarding graduate programs. To do so, we manually collected data about the top 126 CS graduate programs evaluated in the 2011 assessment conducted by the US National Research Council (NRC).2 In particular, for each of these graduate programs,
1
http://dblp.uni-trier.de 2
22 Chapter 4. Experimental Setup
we retrieved the list of its members, which was then manually reconciled against the repository.
Despite our efforts, there were still imprecisions related to the affiliation of the authors. To address them, we combined our dataset with the one provided by the csranking project,3 which ranks CS graduate programs based purely on their publica-tions. They do so by collaboratively collecting data on authors, such as their homepage and affiliation. Therefore, we used that data to enhance our repository. Salient statis-tics on our dataset are shown in Table 4.1.
Table 4.1. Salient statistics of the dataset used in our evaluation.
Attribute Value
Number of Papers 2,931,849
Number of Authors 1,595,771
Number of Venues 5,765
Number of US Graduate Programs 126
Avg. number of faculties per US Graduate Program 42.4
Number of BR Graduate Programs 25
Avg. number of faculties per BR Graduate Program 47.8
4.2
Computer Science Subareas
There are different ways of defining subareas in CS depending on the institution respon-sible for the classification. Two notorious classification are given by ACM4 (through its Special Interest Groups) and IEEE5 (through its Technical Committees). Notice that most of them divide CS into subareas rather distinct. Further, some of these divisions reflect historical decisions that may be less relevant nowadays. For this reason, previ-ous works have attempted to automatically identify such subareas [Wainer et al., 2013] or use another source of information [Hoonlor et al., 2013].
A more recent classification is presented by Microsoft Academic Search.6 It di-vides CS into 37 subareas, including relatively new ones. For the purpose of this work, we selected 20 subareas from the Microsoft Academic Search classification, as presented in Table 4.2. Along with the list, we present the abbreviation of each subarea, which we will be using from here on. We also show two venues we selected as notorious in each subarea of interest. These venues are important for identifying a group of researchers
3
http://csrankings.org 4
http://acm.org/sigs 5
http://computer.org/web/tandc/technical-committees 6
4.2. Computer Science Subareas 23
whose main research topics of interest are likely to be in that subarea — an essential information for the application of P-score to subareas. However, although the choice of seed venues is an important task, we have observed that any two central venues to a given subarea are sufficient to produce reasonable rankings of publication venues and graduate programs for that subarea.
Table 4.2. Subareas of Computer Science selected from Microsoft classification. The full names of the publication venues are presented in Appendix C.
Subarea Abbreviation Seed venues
Algorithms Alg SODA, Algorithmica Artificial intelligence AI IJCAI, AI
Bioinformatics Bio BIBM, Bioinformatics Computer graphics CG SIGGRAPH, TCVG Computer networks CN INFOCOM, TON Computer security CS CCS, TISSEC Computer vision CV CVPR, IJCV Data mining DM KDD, SIGKDD Databases DB SIGMOD, TODS Distributed computing DC ICDCS, TPDS Human-computer interaction HCI CHI, TOCHI Information Retrieval IR SIGIR, TOIS Machine learning ML ICML, JMLR Natural language processing NLP EMNLP, COLING Operating systems OS SOSP, SIGOPS Parallel computing PC IPPS, TPDS Programming languages PL PLDI, TOPLAS
Speech Recognition SR INTERSPEECH, TCOM Theoretical computer science TCS STOC, SIAMCOMP World Wide Web WWW WWW, WS
While our subset of 20 CS subareas is not perfect or exhaustive, it is detailed enough to allow gaining insights into the scene of research in CS in Brazil, which would not be possible to obtain otherwise. In Appendix B, we present other classifications of CS subareas, according to reliable sources.
24 Chapter 4. Experimental Setup
n most representative researchers as reputation seeds. This methodology produced
similar results when compared to the use of venues as seeds and can be improved in the future by enriching the graph of coauthorships with more information about each researcher, such as academic productivity and centrality metrics. Moreover, clustering methods on academic networks can also help in an automatic identification of the current subareas in the broad area of CS.
4.3
Venues Ground-Truth
To evaluate the effectiveness of normalized P-scores as defined by Equation (3.5) on the task of finding venues in a subarea, we considered as ground-truth the opinion of experts. Specifically, we asked reputable CS researchers and their graduate students, working on subareas of IR, DB and Data Mining (DM) to assess the relevance of venues (included in a pre-selected list) to their subareas. This list consists of the venues at the top 50 positions in the P-score ranking when we use as seeds two publication venues only: a journal and a conference closely associated with that subarea. For examples of seeds, see Table 4.3.
Table 4.3. Seeds of publication venues for the P-score ranking used in this work.
Subareas
Type of venue Databases Data Mining Information Retrieval
Conference SIGMOD KDD SIGIR
Journal TODS SIGKDD TOIS
We thus focused on the CS subareas of DB, DM, and IR. For each subarea, three experts have classified each of the 50 venues of the pre-selected list into one, two or three subareas chosen among the 37 subareas listed in Table 4.2. To reconcile the multiple classifications, we used a majority criterion: if a publication venuev was
associated with a subarea s at least twice, s was considered as one of the subareas of v. Hereafter, we will refer to the full lists of publication venues and their subareas as
Chapter 5
Experimental Results
In this chapter, we discuss the results of ranking publication venues and graduate programs in CS on the three subareas we selected: Information Retrieval, Databases, and Data Mining. In particular, for the ranking of graduate programs, our results are restricted to the 126 US graduate programs considered by NRC in 2011.
5.1
Ranking Venues
Using the normalized P-score (norm-P-score) presented in Section 3.4, we were able to better discriminate publication venues of a given CS subarea from venues of other subareas. Figure 5.1 presents the precision-recall curve obtained by norm-P-score in the task of ranking publication venues in Information Retrieval, in light of the results produced using two other methods, namely H-index and standard P-score. To produce the precision-recall curves, we use as ground-truth a venue classification done by experts in each subarea, see Section 4.3. We reproduced the same experimental methodology for ranking venues in the subareas of Databases and Data Mining. The precision-recall curves are shown in Figure 5.2.
As it is clear from Figures 5.1 and 5.2, normalized P-scores allow identifying the correct venues consistently better than H-indices and standard P-scores. Furthermore, for all the three subareas, the normalized P-scores yield maximum precision (100%) for the initial 30% of recall. This means that the first 15 venues in the normalized P-score ranking adopted in Figure 5.1 are strongly related to IR, according to the assessments of specialists.
26 Chapter 5. Experimental Results
0.0
0.2
0.4
0.6
0.8
1.0
Recall@k
0.0
0.2
0.4
0.6
0.8
1.0
Information retrieval
H-index
P-score
norm-P-score
Figure 5.1. Precision-Recall curves of H-index, P-score and normalized P-score for the subarea of Information Retrieval.
as seed venues. Also, a final ranking of IR venues is computed by re-ranking the venues — previously filtered by normalized P-score — according to their standard P-scores.
5.1. Ranking Venues 27
0.0
0.2
0.4
0.6
0.8
1.0
Recall@k
0.0
0.2
0.4
0.6
0.8
1.0
Database
H-index
P-score
norm-P-score
0.0
0.2
0.4
0.6
0.8
1.0
Recall@k
0.0
0.2
0.4
0.6
0.8
1.0
Data mining
H-index
P-score
norm-P-score
28 Chapter 5. Experimental Results
Table 5.1. Top 20 venues in Information Retrieval using (i) standard P-score, (ii) the set of venues selected by the normalized P-score, and (iii) re-ranking the set of venues obtained in (ii) according to their P-scores. The suffixes (c) and (j) are used to differentiate conferences and journals with the same name. The full names of the publication venues are presented in Appendix C.
# Standard P-score
1 SIGIR (c)
2 CIKM 3 TREC 4 ECIR 5 CLEF 6 WWW 7 JASIS 8 IPM
9 SIGIR (j)
10 MM 11 JCDL 12 TOIS 13 IR 14 WSDM 15 NTCIR 16 KDD 17 TKDE 18 ACL 19 ICDM 20 SPIRE norm-P-score TOIS IR WSDM NTCIR SPIRE AIRS RIAO INEX IIIX ICTIR ADCS LA-WEB TWEB CIKM SIGIR (c) TREC ECIR CLEF SIGIR (j) JCDL
# Final Ranking 1 SIGIR (c)
2 CIKM
3 TREC
4 ECIR
5 CLEF
6 SIGIR (j)
7 JCDL 8 TOIS 9 IR 10 WSDM 11 NTCIR 12 SPIRE 13 AIRS 14 RIAO 15 INEX 16 IIIX 17 ICTIR 18 ADCS 19 LA-WEB 20 TWEB
It is noteworthy to mention that the normalized P-score ranking of venues should not be interpreted as an impact or productivity ranking. We only use this output to define the most representative venues of a subarea, in a semi-automatic fashion. For this reason, in Tables 5.1, 5.2, and 5.3, we present the results obtained by normalized P-scores as sets of venues instead of usual rankings of venues.
Afterward, using this ranking of publication venues as a starting point, we can improve rankings of graduate programs in CS by considering a per subarea basis. Our results in ranking graduate programs are discussed in the next section.
5.2
Ranking US Graduate Programs by Subarea
5.2. Ranking US Graduate Programs by Subarea 29
Table 5.2. Top 20 venues in Databases, using (i) standard P-score, (ii) the set of venues selected by the normalized P-score, and (iii) re-ranking the set of venues obtained in (ii) according to their P-scores. The suffixes (c) and (j) are used to differentiate conferences and journals with the same name. The full names of the publication venues are presented in Appendix C.
# Standard P-score 1 SIGMOD (c)
2 ICDE
3 VLDB (c)
4 PVLDB
5 TKDE
6 DEBU
7 SIGMOD (j)
8 EDBT
9 CIKM
10 PODS
11 TODS
12 KDD
13 VLDB (j)
14 WWW 15 ICDM 16 DASFAA 17 SSDBM 18 IS 19 ICDT 20 CIDR norm-P-score ICDE ICDT SIGMOD (j) EDBT SSD SSDBM TKDE DPD SIGMOD (c) CIDR TKDD COMAD DASFAA VLDB (j) PVLDB TODS DEBU PODS WEBDB VLDB (c)
# Final Ranking 1 SIGMOD (c)
2 ICDE
3 VLDB (c)
4 PVLDB
5 TKDE
6 DEBU
7 SIGMOD (j)
8 EDBT
9 PODS
10 TODS
11 VLDB (j)
12 DASFAA 13 SSDBM 14 ICDT 15 CIDR 16 WEBDB 17 SSD 18 DPD 19 COMAD 20 TKDD
subareas receive more attention by the top graduate programs in US.
As in Section 5.1, we consider the same three CS subareas: IR, DB, and DM.
Information Retrieval, Databases, and Data Mining
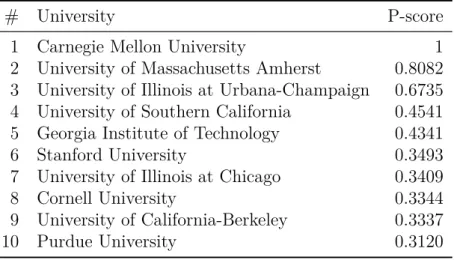
Table 5.4 presents a ranking of US universities based on standard P-scores for the IR subarea. The values presented are normalized to 1 as follows:
P(g, s) = P(g, s)
max(P(g, s)) (5.1)
where P(g, s) is the normalized score of graduate program g in subarea s, P(g, s) is
the score andmax(P(g, s)) is the highest score of the ranking. We apply Equation 5.1
to either standard and weighted P-scores.
30 Chapter 5. Experimental Results
Table 5.3. Top 20 venues in Data Mining, using (i) standard P-score, (ii) the set of venues selected by the normalized P-score, and (iii) re-ranking the set of venues obtained in (ii) according to their P-scores. The suffixes (c) and (j) are used to differentiate conferences and journals with the same name. The full names of the publication venues are presented in Appendix C.
# Standard P-score
1 KDD 2 ICDM 3 CIKM 4 ICDE 5 ICML 6 SDM 7 TKDE 8 WWW 9 SIGMOD 10 AAAI 11 PKDD 12 NIPS 13 PAKDD
14 VLDB (c)
15 SIGIR 16 SIGKDD 17 DATAMINE 18 KAIS 19 JMLR 20 PVLDB norm-P-score SSD VLDB (c) ICML TKDE SDM PAKDD KAIS SADM DATAMINE WSDM ICDM PKDD TIST CIKM TKDD SIGKDD KDD PVLDB ICDE RECSYS
# Final Ranking
1 KDD 2 ICDM 3 CIKM 4 ICDE 5 ICML 6 SDM 7 TKDE 8 PKDD 9 PAKDD 10 SIGKDD 11 DATAMINE 12 KAIS 13 PVLDB 14 WSDM 15 TKDD
16 VLDB (c)
17 RECSYS
18 TIST
19 SSD
20 SADM
Table 5.4. Ranking of the top 10 US Universities on Information Retrieval, based on standard P-scores.
# University P-score
1 Carnegie Mellon University 1
2 University of Massachusetts Amherst 0.8082
3 University of Illinois at Urbana-Champaign 0.6735
4 University of Southern California 0.4541
5 Georgia Institute of Technology 0.4341
6 Stanford University 0.3493
7 University of Illinois at Chicago 0.3409
8 Cornell University 0.3344
9 University of California-Berkeley 0.3337
5.2. Ranking US Graduate Programs by Subarea 31
the US and, thus, the fact that it was not in first place in the rank was surprising to us. This led to an in-depth analysis of the ranking and the consequent understanding of the encroachment problem, as discussed in Section 3.3. Table 5.5 presents the top 10 graduate programs for the IR subarea using our proposed approach of the weighted P-score, according to Equation (3.11), instead. We observe that the University of Southern California, the Georgia Institute of Technology, Stanford University and the University of California at Berkeley are no longer among the top 10 graduate programs. This seems appropriate given these universities are not active on research in IR.
Table 5.5. Ranking of the top 10 US Universities on Information Retrieval, using the weighted P-score (Equation 3.11).
# University weighted-P-score
1 University of Massachusetts Amherst 1
2 University of Illinois at Urbana-Champaign 0.4830
3 Carnegie Mellon University 0.4625
4 University of Delaware 0.2452
5 Purdue University 0.2276
6 Northeastern University 0.1633
7 Lehigh University 0.0964
8 Cornell University 0.0552
9 University of Iowa 0.0494
10 University of Illinois at Chicago 0.0477
To better understand the results in Table 5.5, we produced a list of the top 20 researchers on IR. Table 5.6 shows their affiliations. As we observe, our top 10 graduate programs for the IR subarea are those whose researchers are also among the top 20 authors on IR in the US. In particular, the top 3 groups have each one 2 or more researchers among the top 20. We also manually examined our ranking of authors to observe that the top authors showed in Table 5.6 had more publications in venues strongly related to the subarea. Hence, the ranking of graduate programs can be justified by the ranking of authors. We repeated this process to the DB and DM subareas. Tables 5.7 and 5.8 present the top 10 graduate programs on DB and DM, when we use the weighted P-scores produced by Equation (3.11).
32 Chapter 5. Experimental Results
Table 5.6. Ranking of the top 20 US researchers’ universities on Information Retrieval, using Equation (3.11).
# Authors’ universities
1 University of Massachusetts Amherst #1 2 University of Massachusetts Amherst #2 3 Carnegie Mellon University #1
4 University of Illinois at Urbana-Champaign #1 5 Purdue University
6 University of Delaware 7 Northeastern University
8 University of Illinois at Urbana-Champaign #2 9 Lehigh University
10 Carnegie Mellon University #2 11 University of Iowa
12 University of Illinois at Chicago 13 Georgia Institute of Technology 14 University of Virginia
15 Carnegie Mellon University #3 16 Texas A&M University
17 Cornell University 18 University of Michigan
19 University of Massachusetts Amherst #3 20 New York University
Table 5.7. Ranking of the top 10 US Universities on Databases, using the weighted P-score (Equation (3.11)).
# University weighted-P-score
1 University of Wisconsin-Madison 1
2 Stanford University 0.6570
3 University of Illinois at Urbana-Champaign 0.5687
4 Massachusetts Institute of Technology 0.4975
5 Duke University 0.4616
6 University of Massachusetts Amherst 0.4243
7 University of Michigan 0.4195
8 University of California-Irvine 0.4120
9 University of Maryland-College Park 0.4101