*Correspondence: Venkateskumar Krishnamoorthy. Faculty of Phar-macy, AIMST University, Semeling, Kedah, Darul Aman, Malaysia. E-mail: [email protected]
A
vol. 48, n. 2, apr./jun., 2012
Physicochemical characterization and
in vitro
dissolution behavior
of olanzapine-mannitol solid dispersions
Venkateskumar Krishnamoorthy
1,*, Suchandrasen
2, Verma Priya Ranjan Prasad
31,2Department of Pharmaceutics, KMCH College of Pharmacy, India, 3Department of Pharmaceutical Sciences, Birla Institute of Technology, Mesra, India., 1Faculty of Pharmacy, AIMST University, Malaysia
The objective of the present work is to study the dissolution behavior of olanzapine from its solid dispersions with mannitol. Solid dispersions were prepared by melt dispersion method and characterized by phase solubility studies, drug content and in vitro dissolution studies. The best releasing dispersions were
selected from release data, dissolution parameters and their release proiles. Solid state characterization
techniques like Fourier transform infrared (FT-IR) spectroscopy, X-ray diffractometry, differential scanning calorimetry, near-infrared and Raman spectroscopy were used to characterize the drug in selected dispersions. The dispersions were also evaluated by wettability studies and permeation studies. The results of phase solubility studies and the thermodynamic parameters indicated the spontaneity and solubilization effect of the carrier. The release study results showed greater improvement of drug release from solid dispersions compared to pure drug, and the release was found to increase with an increase in carrier content. The possible mechanism for increased release rate from dispersions may be attributed to solubilization effect of the carrier, change in crystal quality, phase transition from crystalline to amorphous state, prevention of agglomeration or aggregation of drug particles, change in surface hydrophobicity of the drug, and increased wettability and dispersability of the drug in dissolution medium. The suggested reasons for increased release rate from dispersions were found to be well supported by results of solid state characterization, wettability and permeation studies. The absence of any interaction between the drug and the carrier was also proved by FT-IR analysis.
Uniterms: Olanzapine. Mannitol. Solid dispersions.
O objetivo do presente trabalho é estudar o comportamento de dissolução da olanzapina a partir de suas dispersões sólidas de manitol. As dispersões sólidas foram preparadas por dispersão por fusão e caracterizadas por estudos de solubilidade de fase, conteúdo de fármaco e dissolução in vitro. As melhores dispersões quanto à liberação foram selecionadas a partir dos dados de liberação, parâmetros
de dissolução e peris de liberação. Técnicas de caracterização de estado sólido como espectroscopia no
infravermelho pela transformada de Fourier (FTIR), difratometria de raios X, calorimetria de varredura diferencial, infravermelho próximo e espectroscopia Raman foram utilizadas para caracterizar os fármacos a partir das dispersões selecionadas. As dispersões foram, também, avaliadas pelos estudos de capacidade de umedecimento e permeação. Os resultados dos estudos de solubilidade de fase e os parâmetros termodinâmicos indicaram a espontaneidade e o efeito de solubilização do transportador. Os resultados dos estudos de liberação mostraram maior aperfeiçoamento da liberação do fármaco das dispersões sólidas, comparativamente à do fármaco puro, e descobriu-se que a liberação aumenta com o aumento do conteúdo de transportador. O mecanismo possível para o aumento da taxa de liberação das dispersões pode ser atribuído ao efeito de solubilização do transportador, mudança da qualidade do cristal, transição de fase cristalina para estado amorfo, prevenção da aglomeração ou agregação das partículas do fármaco, mudança na superfície de hidrofobicidade do fármaco e aumento da capacidade de umedecimento e dispersividade do fármaco no meio de dissolução. As razões sugeridas para o aumento da taxa de liberação a partir das dispersões foram apoiadas pelos resultados da caracterização do estado sólido, capacidade de umedecimento e pelos estudos de permeação. A ausência de qualquer interação entre o fármaco e o transportador foi, também, comprovada pela análise no FTIR.
INTRODUCTION
The dissolution of a drug from its solid oral dosage forms depends upon its release from the dosage form and
its subsequent mixing into physiological luids. It has been
estimated that nearly 35-40% of the drugs suffer from poor aqueous solubility, thereby affecting their absorption from the gastrointestinal tract, which leads to poor oral bioavail-ability, high intra- and inter-subject varibioavail-ability, increase in dose, reduction in therapeutic efficiency and finally failure in formulation development (Lipinski, 2002). The development of solid dosage forms for water-insoluble drugs has been a major challenge for pharmaceutical sci-entists for decades. Various formulation strategies such as micronisation, micellar solubilization, complexation, dendrimers for drug solubilization, formation of solid solutions or dispersions with hydrophilic carriers, self-microemulsifying drug delivery systems, spray drying, nano approaches, pro-drug approaches and salt synthesis (Pinnameni et al., 2002) have been developed to increase the dissolution rate of water-insoluble drugs.
An attractive possibility is employing a simple solid dispersion technique making use of various hydrophilic carriers (Chiou, Reigelmann, 1971; Dhirendra et al., 2009;
Ansu, Jain, 2011). Solid dispersions (SDs) are deined
as the dispersion of one or more active ingredients in an inert hydrophilic carrier or matrix in a solid state, and are prepared by the fusion, solvent or solvent-fusion method (Chiou, Reigelmann, 1971). This technique enables re-ducing particle size to a nearly molecular level, offers a variety of processing and excipient options that allow for
lexibility when formulating oral delivery systems of poor water-soluble drugs that are cost-effective and signiicant -ly reduced in dosage (Serajuddin, 1999; Dhirendra et al., 2009). It has been widely demonstrated that a hydrophilic carrier dissolves rapidly, exposing the drug particles to
the dissolution medium as ine particles facilitating quick
dissolution and absorption.
The mechanisms for increased dissolution rate may include reduction of crystallite size, solubilization effect of the carrier, absence of aggregation of drug crystallites, improved wettability and dispersability of a drug from the dispersion, dissolution of the drug in the hydrophilic carrier or conversion of the drug to an amorphous state (Craig, 2002; Biswal et al., 2008).
Schizophrenia is a severe non-curable illness of the brain with serious consequences if not properly treated and kept under control. It is the most common form of severe mental illness. Olanzapine (OLZ;2-methyl-4-(4-methyl-1-piperazinyl)-10H-thieno-[2,3-b],[1,5]benzodiazepine) is a relatively new benzodiazepine atypical antipsychotic
medication, which belongs to the class of the
thienoben-zodiazepines and has proven eficacy against the positive
and negative symptoms of schizophrenia, bipolar disor-der and other forms of psychosis. It exhibits poor water
solublility and belongs to Biopharmaceutic Classiication
System (BCS) class II of drugs (low solubility and high permeability), highly bound to plasma protein (about 93%) (Callaghan et al., 1999; Ayala et al., 2006). Following oral administration, Cmax is reached within 5–6 h of dosing. OLZ undergoes extensive pre-systemic metabolism in the liver, resulting in relatively very low oral bioavailability (Cheng et al, 2000; Di NunZio et al., 2008). The objective of this work is to enhance the aqueous solubility of poorly water-soluble drug OLZ by adopting a solid dispersion approach using mannitol as the hydrophilic carrier and to physico-chemically characterize the in vitro dissolution behavior of the solid dispersions.
MATERIAL AND METHODS
Material
OLZ was received as a gift sample from Unichem Laboratories (Mumbai, India). Mannitol was purchased from were SD Fine Chemicals Ltd. (Mumbai, India). So-dium hydroxide, potassium dihydrogen orthophosphate, microcrystalline cellulose (DC grade) and magnesium stearate were also procured from SD Fine Chemicals Ltd. (Mumbai, India). All other solvents and reagents used were of analytical grade.
Methods
Dispersion method
A series of solid dispersions were prepared using a varying ratio of the carrier (mannitol). The level of OLZ was kept constant in all the dispersions. The drug:carrier ratios tried were 1:1, 1:2, 1:4, 1:6, 1:8 and 1:10. OLZ was dissolved in absolute ethanol to get a clear solution. The car-rier was powdered well in a mortar. The OLZ solution was then added to the powdered carrier with constant trituration. The wet solid mixture was dried at 60 °C for 6 h. The dried mass was kept in a dessicator for 12 h. Then the dried mass was powdered and sifted through sieve no.100. The samples are then stored in dessicator until further use (Chowdhary, Rao, 2000; Masataka et al., 2002; Markus et al., 2008).
Phase solubility studies
in screw-capped bottles and shaken in an orbital shaker (Remi Ltd, Mumbai) and incubated at 25 °C and 37 °C for 24 h. Samples with pure drug and water was used as
con-trol. After 24 h, the solutions were iltered using a What
-man ilter paper (0.45 µm, 13 mm, What-man, USA). The iltrate was diluted and analyzed spectrophotometrically at
259 nm (1700 UV-Vis Shimadzu, Japan). The solubility of OLZ in various carriers was calculated using the standard curve [OD=0.1149 × concentration – 0.0031]. The data were used in phase solubility analysis to calculate
vari-ous thermodynamic parameters such as ∆H, ∆S and ∆G
(Higuchi, Connors, 1965; Arias et al., 1999; Cirri et al., 2004; Biswal et al., 2008).
Phase solubility analysis
• Stability constant(Biswal et al., 2008; Singh et al., 2009) The value of apparent stability constant (Ka) of drug–carrier combinations were computed from the phase
solubility proiles as described below:
Eq. 1
Gibbs energy (∆G) was calculated using the formula
∆G = –RT ln Ka Eq. 2
where R is the universal gas constant (8.313 J/mol K), T
the temperature, and Ka the stability constant.
• Enthalpy
The enthalpy change in the systems was calculated from Van’t Hoff equation:
Eq. 3
where R is the universal gas constant (8.313 J/mol K), Ka
the stability constant, and dT the difference in temperature (Kelvin).
• Entropy
The entropy of the system was calculated from the equation
Eq. 4
where ∆H is the enthalpy and ∆G the entropy.
Drug content
The assay of a weighed amount of solid
disper-sions was carried out to determine the drug content. The weighed samples were dissolved in 10 mL of analytical media and stirred by a vortex mixer. The solutions were
iltered using a Whatman ilter paper (0.45 µm, 13 mm, Whatman, USA). Then the iltrate was diluted suitably
and the content was estimated spectrophotometrically (UV-1700, Shimadzu, Japan) at 259 nm using the standard curve, applying a validated method (data not shown).
In vitro dissolution studies
The in vitro dissolution study of all solid dispersions of OLZ in mannitol was carried out on USP dissolution apparatus (Campbell Electronics, Mumbai) and the results were compared with those for pure OLZ. The dissolu-tion vessels contained 900 mL of 0.1 NHCl maintained at 37 °C ± 0.5 °C and paddle speed set at 50 rpm. Solid dispersions equivalent to 20 mg of OLZ were added to the dissolution medium in a powder form. Then, 5 mL samples were withdrawn at 5, 10, 20, 30, 40, 50 and 60 min from the dissolution medium through a graduated pipette equipped with plastic tube end closed with a cotton plug. The pres-ence of cotton plug allows only the dissolved OLZ to be
collected and ilters all the carrier components. The with -drawn sample was replenished with 5 mL of fresh media. The withdrawn samples were analyzed for OLZ content by measuring the absorbance at 259 nm using UV-visible spectrophotometer (UV-1700, Shimadzu, Japan). Three such determinations were carried out for each formulation. The content of OLZ was calculated from the standard curve [OD=0.1149 × concentration+ 0.001(R2 = 0.9999;
p > 0.001). The in vitro dissolution parameters such as cu-mulative per cent drug release and dissolution parameters such as amount released (Q), per cent dissolution eficiency
(% DE), dissolution rate constant (DRC), relative dissolu-tion rate (RDR), dissoludissolu-tion half life (t50%) and time taken to release 85% of drug (t85%) were calculated by applying release data into various equations given below (Cirri et al., 2004; Biswal et al., 2008; Singh et al., 2009).
Dissolution half-life (t50%)
Time taken to release 50% of drug was calculated by
Eq. 5
Relative dissolution rate (RDR)
It is the ratio of the drug released from the samples
with respect to pure drug at speciic time intervals.
Dissolution efficiency (% DE)
It can be deined as the area under the dissolution
trap-ezoidal method and is expressed as a percentage of the area of the rectangle divided by the area of 100% dissolution in the same time:
Eq. 6
Dissolution rate constant (DRC)
A plot of log % drug unreleased versus time was drawn and the slope was calculated using MS Excel 2007 computer programme. Dissolution rate constant was cal-culated from the equation
DRC = Slope * 2.303 Eq. 7
Release kinetics
To study the release kinetics of the drug from the
solid dispersions, the release data were itted in to the fol -lowing equations.
Zero order (K0)
Qt = Q0 + K0t Eq. 8
where Qt is the amount of drug released at time t, Q0 the amount of drug in solution at time t=0 (usually Q0=0) and
K0 is zero-order release constant.
First order constant (K1)
Eq. 9
where Qtis the amount of drug released in time t, Q0 = amount of drug in solution at time t=0 (usually Q0=0) and
K1 is the irst-order release constant.
Higuchi model
Mt = K√t Eq. 10
where Mtis the amount of drug dissolved at
particu-lar time t, K the Higuchi release constant.
Hixson Crowell model
Eq. 11
where W0 is the weight of the drug taken at time t=0 and
Wtis the weight of the drug taken at time t.
Further, in order to better characterize the drug release behavior from the dispersions, the
Korsemeyer-Peppas empirical model was applied:
Eq. 12
where Qt/Q∞ fractional release of drug at time t, kKP a constant comprising the structural characteristics of the formulation and n (the release component) a parameter indicative of the mechanism of drug release. For the particular case of delivery system, n ≤ 0.5 corresponds
to Fickian release (case I), 0.5 < n < 1.0 to an anomalous (non-Fickian) transport, n=1 to a zero-order release kinet-ics (case II) and n >1 to a super case II transport (Costa, Lobo, 2001; Hamid et al., 2006).
Solid State characterization
Fourier Transform Infrared Spectroscopic Studies (FT-IR)
FT- IR spectra of pure OLZ, carriers, physical mix-tures of drug and carrier (1:1) and optimized solid disper-sions were carried out using FTIR spectrophotometer with KBr disc (Jasco - FTIR -1700 spectrophotometer, Japan). All the samples, viz. OLZ, mannitol and physical mixtures (PMs) and solid dispersions, were analyzed in a similar manner. Physical mixtures were prepared by blending individual components in a glass pestle mortar.
X-ray Diffraction Studies (X-RD)
Diffraction patterns (X-ray diffractometer (Philips,
Finland), 40 kV, 30 mA generator with a Cu-Kα radiation
tube) of the pure drug, physical mixtures and selected solid dispersions were scanned over 2Ø range from 2 °C to 50 °Cat the rate of 2 °C per min at 0.02° at 2Ø step size.
Differential scanning calorimetry (DSC) studies
Thermal analysis was carried out using differential
scanning calorimeter (Q 10 DSC TA, Instruments, Waters
Inc., Newcastle, USA) with a liquid nitrogen cooling accessory. The analysis was performed under purge of nitrogen gas (50 cc/min). High-purity indium was used to
calibrate the heat low and heat capacity of the instruments. The sample (5–10 mg), placed in lat-bottomed aluminum pan, was irmLy capped with a lid to provide an adequate
seal. The sample was heated from ambient temperature to 400 °C at pre-programmed heating rate of 10 °C min–1.
Near-infrared (NIR) analysis
NIR spectra of the pure drug and selected samples were recorded using a FT-IR spectrometer (Jasco FT-IR,
were scanned in the wavelength range of 800–2000 nm and absorbance was measured in transmittance mode.
Confocal Raman spectroscopic analysis
The Raman spectra of samples and pure drug were
recorded using confocal Raman spectrophotometer (WI -TEC Alpha 300, Confocal Raman Nd:YAG laser (532 nm, USA)).
Wetting studies
Formulation of tablets
As per the results of the in vitro release studies, the solid dispersion that had the highest concentration of man-nitol was selected as the best releasing solid dispersion from the samples. The tablets of pure OLZ and selected solid dispersions (OMAN 10) were formulated by us-ing 20 mg of pure OLZ and solid dispersions equivalent to 20 mg of OLZ. Each tablet weighed around 250 mg.
Suficient quantity of microcrystalline cellulose (diluent)
and magnesium stearate (lubricant) were added and the resulting product mixed well in a mortar. The mixture was directly compressed in a 10-station rotary tablet punching machine (Rimek, Ltd., Mumbai, India) at a compression pressure of 5 kg/cm2. The wetting studies were carried out only on the tablets made from pure drug and the selected solid dispersions.
Wetting time studies
Five circular tissue papers were placed in a petri dish 10 cm in diameter. Ten mL of 0.5% methylene blue solution, a water-soluble dye, was added to the petri dish. The dye solution was used to identify complete wetting of the tablet surface. A tablet was carefully placed on the surface of the tissue paper in the petri dish at ambient temperature. The time required for water to reach the upper surface of the tablets and to completely wet them was noted as the wetting time. These measurements were
carried out in triplicate. Wetting time was recorded using a
digital watch (Gohel, Patel, 2000; Sunilkumar et al., 2008; Adel et al., 2009).
Water absorption ratio
The weight of the tablet prior to placement in the petri dish was noted (Wb) using a Metler Toledo Digital balance. The wetted tablet was removed and reweighed (Wa). Water absorption ratio (R) was then determined using Eq. 10 (Sunilkumar et al., 2007; Adel et al., 2009).
Eq. 13
In vitro dispersion studies
A tablet was added to 10 mL of phosphate buffer pH 7.4 at 37 °C. The time required for complete dispersion was noted. Three such determinations were carried out (Adel et al., 2009; Shoukri et al., 2009).
Permeation studies
Preparation of egg membrane
The outer shell membrane of the egg of Gallus
Domesticus just located inside the shell exactly under
the hard calciied layer was prepared by immersing the egg in 0.01 N HCl for 6 h to dissolve the calciied layer.
The membrane was cut cautiously to expel the contents of the egg and washed with normal saline solution. The inner membrane was repeatedly washed with water and stored in distilled water (Mehdi et al., 2006; Corti et al., 2009).
Preparation of onion membrane
The middle membrane of the Allium Cepa L. (onion) was peeled or separated with caution by gradual
applica-tion of water in iller to avoid damage to the membrane.
The stripped membranes (3 cm2) without any crack or
oriice were selected and stored in cold water until further
use (Mehdi et al., 2006).
Preparation of tomato membrane
Tomatoes were boiled in hot water for about 15 min. The softened outer layer of tomato was removed carefully
and repeatedly washed with water to remove the leshy
TABLE I - Composition of tablets for wetting studies
Composition Olanzapine (mg) OMAN 10 (mg)
OLZ 20 –
Selected SD (OMAN 10) – ≡ 20 mg of olanzapine (217 mg of SD)
Microcrystalline cellulose 223 26
Magnesium stearate 7 7
parts of tomato. The washed membranes were stored in cold water until further use (Mehdi et al., 2006).
Through natural membrane
All the membranes were inspected by a microscope to ensure their integrity and uniformity. Their thickness was measured by a caliper, and membranes that had thickness similar to a cellophane membrane were used for further studies. The required length of egg, onion or tomato membrane was cut and tied or glued to the bottom (grounded) layer of the diffusion cell with a thread to form an inner compartment.
Ten mL of 0.1 N HCl were added to the inner com-partment and placed in a beaker containing 100 mL of 0.1 NHCl, which acts as an outer compartment. Care was taken to make sure that the level of media in both compart-ments is equal. A magnetic bead was added to the outer compartment to stir the contents during the studies. The entire assembly was placed in a magnetic stirrer (Remi Ltd, Mumbai, India) and temperature was maintained at 37± 1 °C. The weighed amount of the pure drug was added to the inner compartment of the diffusion cell and the studies were performed for duration of 30 min. At predetermined time intervals, samples were withdrawn and the same volume of media was replenished to maintain the sink volume. The solutions were suitably diluted and the absorbance was measured spectrophotometrically at 259 nm (UV-1700, Shimadzu, Japan). The procedure was repeated with the selected solid dispersions (OMAN10) and with each of the membranes (egg, onion, tomato, cel-lulose acetate and celcel-lulose nitrate) (Mehdi et al., 2006).
Through cellulose nitrate and cellulose acetate
Cellulose acetate and cellulose nitrate membrane were procured as readymade membranes and rinsed in distilled water prior to studies. The cellulose nitrate and ac-etate membrane were glued to the bottom (grounded) layer of the diffusion cell and the procedure was repeated in the same way as the diffusion studies were performed using egg and other natural membranes (Mehdi et al., 2006).
The apparent permeability coefficient (Papp) was calculated using the following equation:
Eq. 14
where dq/dt is the linear appearance rates of drug in the receiver solution during sink conditions, A is the surface area of the membrane and C0 the initial drug concentra-tion in donor compartment (Mehdi et al., 2006; Corti, et al., 2005).
Statistical analysis
The difference in the in vitro dissolution proile and
various dissolution parameters was evaluated statistically. The data were tested by two-way analysis of variance.
RESULTS AND DISCUSSION
Physico-chemical characterization
Phase solubility studies
Phase solubility studies were conducted to determine the effect of temperature, solubilization effect of the carrier and the spontaneity of solubilizing process when the drug is physically mixed with mannitol. The thermodynamic parameters of OLZ and its physical mixtures are shown in Table II. The solubility of OLZ was found to show a linear increase with an increase in the amount of carrier and temperature. These results were found to be in accor-dance with the well-established formation of weak soluble complexes (Cirri et al., 2004; Biswal et al., 2008). It is also known from earlier studies that the drug molecules might have transferred from pure water into the aqueous
solution of carriers, which was conirmed in our studies
clearly from the negative thermodynamic parameters like
∆G and ∆H and positive entropy ∆S of physical mixtures.
These indings prove the spontaneous nature of the solubi -lization process. The enhancement of drug solubility in the hydrophilic carrier could also be equally well explained by co-solvency effect of the carrier. It was also suggested that the hydrophilic carriers may interact with the drug mol-ecules by electrostatic bonds and other types of bonding
such as van der Waals forces, and this was the likely cause
for the formation of weakly soluble complexes. The slopes of straight linear relationship was assumed as indicative of
the relative solubilizing eficiency of the carrier (Higuchi,
Connors, 1965; Arias et al, 1999; Cirri et al., 2004; Biswal
et al., 2008; Singh et al., 2009).
Drug content
The assayed drug content in all solid dispersions was found to be in the range of 98–104%, indicating the uniform distribution of the drug in formulations and the suitability of the method used for the formulation of dispersions.
In vitro dissolution studies
The % cumulative release of pure OLZ was found
TABLE II - Thermodynamic parameters of olanzapine physical mixtures with carriers
S. No Carrier Temp.
(°C) Slope Intercept Ka (M
–1) ∆G
(kJ/mol)
∆H (kJ/mol)
∆S (J/mol K)
1 MAN 25 –8.46 3.797 –0.236 –1.958 –1.955 1.951
37 –118.9 10.59 –1.188 –0.787 –0.787 0.784
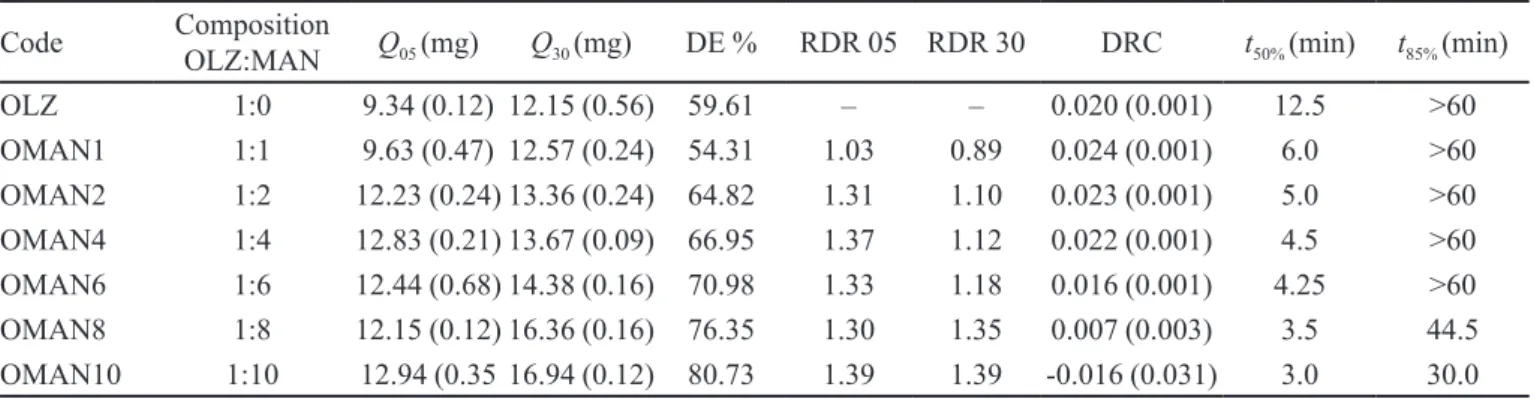
gradually as the amount of carrier in solid dispersions was increased from 1:1 to 1:10 (Figure 1).The in vitro release
data of sample solid dispersions showed a signiicant dif -ference (p > 0.001) in the release rate in comparison with pure OLZ. The in vitro dissolution parameters of the SDs are presented in Table III. It was found that parameters like % cumulative release, amount of drug released, % DE and RDR values were found to exhibit a linear increase with increase in the amount of carrier in dispersions. The other parameters like DRC, t50% and t85 % values were found to decrease with an increase in carrier fraction.
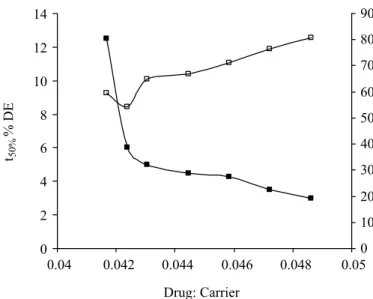
The correlation plot of % DE and t50% is shown in Figure 2. The % DE values were found to increase from 59.61% (for pure OLZ) to 80.73% (for solid dispersions) with 1:10 ratio. The dissolution half-life was found to decrease from 12.5 (pure OLZ) to 3.5 (for OMAN10), and t85% were found to be reduce from 60 min (for pure OLZ) to 30 min (for OMAN 10). Based on these find-ings, it can be inferred that batch OMAN10 was found to
FIGURE 1 - Dissolution proiles of olanzapine–mannitol SDs
compared with pure OLZ. All data points represent the mean of 3 values, n=3. │- OLZ, □- OMAN1, ж-OMAN2, X- OMAN4,
■-OMAN6, ∆- OMAN8 and ●- OMAN10.
FIGURE 2 - Correlation plot for dissolution eficiency (% DE)
and dissolution half-life (t50%). ■- Dissolution half-life and □-%
dissolution eficiency.
exhibit best release behavior than other solid dispersions. The order of OLZ drug release from the solid dispersions could be ranked as: OMAN10 > OMAN > 8 > OMAN> 6 > OMAN4 > OMAN2 > OMAN1 > OLZ.
The difference in t50% and %DE between the pure durg and solid dispersions was evaluated statistically.
When examined by two-way analysis of variance, the t50%
and % DE data showed signiicant difference between the
pure drug and test products (p>0.001).
high, there is a possibility of the drug being dispersed in the molecular form in the carrier structure with reduced crystallinity and this phenomenon would have also as-sisted in increasing the dissolution rate (Arias et al., 1996; Masataka et al., 2002; Cirri et al., 2004; Valizadeh et al., 2004; Nokhodichii et.al., 2007; Karavas et al., 2007).
The release kinetics of the in vitro dissolution data (Table IV) and the regression parameters were analyzed to ascertain the type of drug release from solid disper-sions. Since the co-efficient of correlation r value of Korsemeyer-Peppas model was found to predominate over the r value in other models, the release data were found to
it aptly into Korsemeyer-Peppas kinetic model. Further,
the release exponent n values were found to be well within
0–0.5, suggesting a Fickian type of drug release from the dispersion (Costa, Lobo, 2001; Hamid et al., 2006). The possible mechanism suggested for high release of OLZ
from dispersions was also found to correlate with the ind -ings of release kinetic analysis.
Solid state characterization
FT-IR studies
The FT-IR spectra of OLZ, physical mixtures (1:1) and SDs are presented in Figure 3. Pure OLZ showed characteristic absorptions at 3239 cm–1 (NH and OH stretching), 2929 cm–1 (C–H stretching), 1587 cm–1 (C=C stretching), 1421 cm–1 (C=N stretching) and 1287 cm–1
TABLE III - Dissolution parameters of olanzapine–MAN solid dispersion
Code Composition
OLZ:MAN Q05 (mg) Q30 (mg) DE % RDR 05 RDR 30 DRC t50% (min) t85% (min)
OLZ 1:0 9.34 (0.12) 12.15 (0.56) 59.61 – – 0.020 (0.001) 12.5 >60
OMAN1 1:1 9.63 (0.47) 12.57 (0.24) 54.31 1.03 0.89 0.024 (0.001) 6.0 >60
OMAN2 1:2 12.23 (0.24) 13.36 (0.24) 64.82 1.31 1.10 0.023 (0.001) 5.0 >60
OMAN4 1:4 12.83 (0.21) 13.67 (0.09) 66.95 1.37 1.12 0.022 (0.001) 4.5 >60
OMAN6 1:6 12.44 (0.68) 14.38 (0.16) 70.98 1.33 1.18 0.016 (0.001) 4.25 >60
OMAN8 1:8 12.15 (0.12) 16.36 (0.16) 76.35 1.30 1.35 0.007 (0.003) 3.5 44.5
OMAN10 1:10 12.94 (0.35 16.94 (0.12) 80.73 1.39 1.39 -0.016 (0.031) 3.0 30.0
Values in parenthesis indicates standard deviation: Q05 – Amount released at 05 min (mg)
Q30 – Amount released at 05 min (mg)
% DE – Per cent dissolution eficiency
DRC – Dissolution rate constant
RDR – Relative dissolution rate at speciic time intervals
t50 % – Dissolution half-life
t85% – Time taken to release 85% of drug from dispersions
TABLE IV - Release kinetic parameters of olanzapine–MAN solid dispersions
Code Zero Order First Order Higuchi Hixson Crowell K-P
r2 K
0 r
2 Slope K
1 r
2 Slope r2 Slope r2 n
OLZ 0.796 0.998 0.110 0.009 0.020 0.857 8.24 0.751 0.012 0.993 0.257
OMAN1 0.768 0.819 0.121 0.009 0.021 0.827 8.05 0.703 0.011 0.990 0.258
OMAN2 0.620 0.674 0.177 0.010 0.023 0.637 7.20 0.456 0.009 0.937 0.246
OMAN4 0.646 0.724 0.154 0.009 0.021 0.667 7.60 0.511 0.010 0.947 0.256
OMAN6 0.696 0.845 0.093 0.007 0.016 0.732 8.62 0.629 0.013 0.967 0.284
OMAN8 0.732 0.971 0.021 0.003 0.007 0.778 9.72 0.731 0.017 0.979 0.314
OMAN10 0.775 1.110 0.075 -0.007 -0.016 0.828 10.82 0.877 0.026 0.989 0.342
(C–N stretching) (Ayala et al., 2006; 2007; Hiriyanna
et al., 2008). The characteristic peaks of pure OLZ were
found to be present in the spectra of PM as well as in
solid dispersions. This inding reveals the lack of interac -tion between the drug and the carrier in the samples. It
was also noticed that the signiicant peaks of pure drug at speciic wave number (3239 cm–1) was found to be in reduced form, with less sharpness and more broadness as the amount of mannitol was increased in the samples.
These indings clearly prove the reduction of crystallinity
in the drug molecule present in samples (Ayala et al., 2006; Ayala, 2007; Hiriyanna et al., 2008).
X-ray diffraction analysis
X-ray diffraction spectra of pure OLZ, mannitol, physical mixture (1:1) and batch OMAN 10 are illustrated in Figure 4. The presence of sharp distinct peaks in OLZ spectra indicated its high crystallinity. The carrier
(man-FIGURE 3 -FT-IR spectra of pure olanzapine (OLANZ),
physical mixtures (OMANPM) at 1:1 ratio, solid dispersions (SDs) OMAN1, OMAN2, OMAN4, OMAN6, OMAN 8 and OMAN10.
FIGURE 4 - XRD spectra of pure olanzapine (OLANZ),
mannitol (MAN), physical mixtures (OMANPM) at 1:1 ratio and solid dispersions (SDs) OMAN 10 at 1:10 ratio.
nitol) spectra exhibited a distinct diffraction pattern with prominent peaks at 2Ø of 18.95, 20 and 22.10º (Valizadeh
et al., 2004; Manish et al., 2007). The principal peaks of the drug were found to appear in diffractogram of physical mixture in 1:1 ratio, suggesting the absence of interaction between the drug and the carrier. The prominent peak of OLZ at 2Ø of 5º was found to be reduced in sharpness in the diffractogram of the sample OMAN10.
Further the peaks in sample diffractogram was also found to possess less peak height, low relative intensity
and high full width at half-minimum (FWHM) values than
the peaks corresponding to the pure drug. From these ob-servations, it can be concluded that the crystalline nature of the drug was still maintained, but the relative reduction of diffraction intensity of OLZ suggests that the quality of
the crystal was reduced. These observations conirm the
Differential scanning calorimetry (DSC) studies
The DSC scans of pure OLZ, PGS and optimized solid dispersions (OMAN10) are presented in Figure 5. A sharp single endothermic peak appeared for pure OLZ with the following parameters: onset at 194.36 °C, peak
at 196.40 °C, area of 262.56 mJ and ΔH value of 105.023. These values clearly indicate its high crystalline nature (Ayala et al., 2006; Ayala, 2007).
Two peaks were observed in the sample thermo-gram: one at 165.95 °C (due to carrier) and a very short, reduced endothermic peak at 190.05 °C (of drug) with
a peak area of 65.96 mJ and increased ΔH value. This variation in thermal behavior of selected solid dispersions can be attributed to the fact that the reduced crystallinity or phase transition (from crystalline to amorphous form) had occurred in the drug molecule during the formulation of solid dispersions. These changes in the structure of the drug molecule might have contributed to the enhanced dissolution rate of OLZ from the dispersions (Arias et al., 1999; Valizadeh et al., 2004; Nokodichii et al., 2007).
Near-infrared Analysis
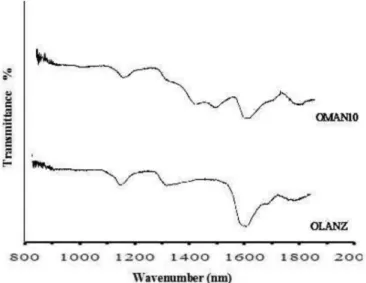
The near-infrared spectra of OLZ and optimized solid dispersions (OMAN10) are compared in Figure 6.
The characteristic peaks of pure OLZ appeared at 1141 and 1581 nm (Ayala et al., 2006; Ayala, 2007). The speciic
peaks of OLZ in spectra of optimized solid dispersions were found to be broader in nature and a slight shift in the peak position in comparison with the spectra of pure OLZ.
These indings indicate the reduction of crystallinity of the
drug present in SDs.
Raman analysis
The Raman spectra of pure OLZ and selected solid dispersions (OMAN10) are compared in Figure 7. The sharp peaks of OLZ appeared at 2435, 1594, 1517, 1460, 1224, 1050, 965, 784 and 480 cm–1 positions (Ayala et al., 2006; Ayala, 2007) in pure drug spectra, which is
indica-FIGURE 5 - DSC thermograms of pure olanzapine, mannitol
and solid dispersions (SDs) at 1:10 ratio.
FIGURE 6 - Near-infrared spectra of pure olanzapine (OLZ) and solid dispersions (SDs) OMAN10.
FIGURE 7 - Raman spectra of olanzapine (OLZ) and SDs
TABLE V - Wettability data of pure olanzapine and selected solid dispersions
Batch Wetting Time (min) Water Absorption Ratio In vitroDispersion Time (min)
OLZ >60 (2.26) 11.49 (1.14) > 60 (1.12)
OMAN10 18 (2.36) 15.86 (0.96) 18 (0.86)
Values in parenthesis indicates standard deviation (n=3).
tive of its high crystallinity. The characteristic peaks of pure OLZ were found to be in much reduced broadness and slight shift towards their lower wave numbers in sample
spectra. These indings clearly suggest that some degree
of structural changes had taken place in the drug molecule when dispersed in hydrophilic carriers.
Wettability studies
The wettability data of pure OLZ and optimized SDs (OMAN 10) are shown in Table V. The wetting time and
in vitro dispersion of pure OLZ was found to be more than
60 minandwater absorption ratio of olanzapine was found to about 11.49. It was observed that tablets prepared with OLZ did not show any sign of structural changes after 60 min and it was also found to retain its compactness during the in vitro dispersion studies.
These results clearly prove the high hydrophobicity, poor wettability and low water absorption potential of OLZ (Sunilkumar et al., 2007). The wetting time and in
vitro dispersion time of sample was found to be 18 min,
much less than the pure OLZ (more than 60 min). The water absorption ratio of sample was found to be higher (15.18) than pure OLZ (11.49), indicating the water ab-sorption potential of mannitol. It was also observed that the tablets were found to absorb water slowly and get disinte-grated into small fragments during the dispersion process.
These observations conirm the increased wettability in
samples and also provide a clear Insight into the role of hydrophilic carriers in the formulations (Sunilkumar et al., 2007; Adel et al., 2009).
Permeation Studies
Natural and synthetic membranes
Permeation studies across various natural mem-branes had been used as a tool to predict the gastrointes-tinal permeation of drugs. Permeation studies were con-ducted across natural membranes like onion, tomato, egg membrane and synthetic membranes like cellulose acetate
and cellulose nitrate. The apparent permeation coeficient
values of pure OLZ and selected solid dispersion batches across the tested membranes are determined and tabulated
in Table VI. The permeation coeficient of the optimized
solid dispersions across the tested membranes was found
to be higher than pure OLZ. These indings prove the per
-meation eficiency of the selected solid dispersions and
the possible reasons attributed to hydrophilic nature of the carrier and increased wettability in samples solid disper-sions (Mehdi et al, 2006; Corti et al., 2006). The possible mechanism suggested for its enhanced aqueous solubility and release rate are particle size reduction, solubilization effect of carrier, change in crystal quality or formation of solid solution, change in surface hydrophobicity of drug particles and increased wettability due to increased water absorption by the carrier. Due to these factors, the drug would dissolve fast in gastric secretions, leading to its higher dissolution and subsequent absorption. Further the membranes in which the permeability studies were con-ducted were proved to be similar to biological membranes and studies across such membranes have been already reported in literature and it had been suggested that per-meation studies across such membranes could be used as predictors for increased permeability of the model drug.
Mechanisms for enhanced release
The possible reasons that might be attributed to increased release rate from solid dispersions are particle size reduction, solubilization effect of carrier, change in crystal quality or formation of solid solution, prevention of aggregation or agglomeration of drug particles in dis-solution medium, change in surface hydrophobicity of
TABLE VI - Apparent permeation coeficient data of OLZ and
selected solid dispersions (OMAN10)
Membrane
Apparent permeation
coeficientPapp (cm s–1)
OLZ OMAN10
Egg 0.001 0.002
Onion 0.001 0.002
Tomato 0.001 0.002
CA 0.004 0.016
CN 0.015 0.018
drug particles and increased wettability due to increased water absorption by the carrier. These postulations were
well supported by the indings of physicochemical char -acterization techniques used for evaluation of solid disper-sions. Further, the suggested reasons for enhanced release were found to be in accordance with the earlier published reports using hydrophilic carriers (Corrigon, 1985; Leuner, Dressman, 2000; Craig, 2002).
CONCLUSION
The approach of the present work was to characteri-ze the solid dispersion of a BCS Class II drug and study its effect on dissolution. The results of the work clearly suggest that the solid dispersions formulated with man-nitol could be developed in fast release dosage forms with
improved oral absorption and therapeutic eficiency. The
solid dispersions could be explored further to establish
pharmacokinetic and pharmacodynamic proiles for real -izing their full potential.
REFERENCES
ADEL, M.A.; SEMREEN, M.; MAZEN, K.; Superdisintegrants for solid dispersions to produce rapidly disintegrating tenoxicam tablets via camphor sublimation. Pharm. Technol, v.1, p.68-74, 2005.
ANSU, S.; JAIN, C.P. Solid dispersion: A promising technique to enhance solubility of poor water soluble drug. Int. J. Drug Deliv., v.3, p.149-170, 2011.
ARIAS, M.J.; GINES, J.M.; MOYANO, J.R. Study by DSC and HSM of the oxazepam- PEG 6000 and oxazepam-D-Mannitol systems, Application to the preparation of solid dispersions. Thermochim. Acta, v.321, p.33-41, 1999.
AYALA, A.P. Polymorphism in drugs investigated by low wave number Raman scattering. Vib. Spectrosc., v.45, p.112-116, 2007.
AYALA, A.P.; SIESLER, H.W.; BOESE, R.; HOFFMANN,
G.G.; POLLA, G.I.; VEGA, D.R. Solid state characterization of olanzapine polymorphs using vibrational spectroscopy. Int. J. Pharm., v.326, p.69-79, 2006.
BISWAL, S.; SAHOO, J,: MURTHY, P.N.; GIRADKAR, R.P.;
AVARI, J.G. Enhancement of dsissoltuion rate of glicliazide suing solid dispersions with polyethylen glycol 6000. AAPS Pharmscitech., v.9, p.563-570, 2008.
CALLAGHAN, J.T.; BERGSTROM, R.F.; PTAK, L.R.; Beasley, C.M. Olanzapine - pharmacokinetic and pharmacodynamic
proile. Clin. Pharmacokinet., v.37, p.177-193, 1999.
CHENG, Y.H.; ILLUM, S.S.; DAVIS, S. Schizophrenia and drug delivery systems. J. Drug Target., v.2, p.107-117, 2000.
CHIOU, W.L.; RIEGELMAN, S. Pharmaceutical applications of
solid dispersions. J. Pharm. Sci., v.60, p.1281-1302, 1971.
CHOWDHARY, K.P.R.; SRISNIVASA RAO, S. Investigation
o f d i s s o l u t i o n e n h a n c e m e n t o f I t r a c o n a z o l e i n superdisintegrants. Drug Dev. Ind. Pharm., v.26, p.1217-1220, 2000.
CIRRI, M.; MURA, P.; RABASCO, A.M.; GINES, J.M.; MOYANO, J.R. Characterization of Ibuproxam binary and ternary dispersion with hydrophilic carriers. Drug Dev. Ind. Pharm., v.30, p.65-74, 2004.
CORTI, G.; FRANCESCA, M.; MARZIA, C.; SANDRA, F; PAOLA, M. Development and evaluation of an in-vitro method for prediction of human drug absorption 1. Assessment of artificial membrane composition. Eur. J. Pharm. Sci., v.27, p.346-353, 2006.
COSTA, P.; LOBO, S. Modeling and comparison of dissolution
proiles. Eur. J. Pharm. Sci., v13, p.123-133, 2001.
CRAIG, D.Q.M. The mechanisms of drug release from solid dispersions in water-soluble polymers. Int. J. Pharm., v.231, p.131-144, 2002.
CORRIGAN, O.I. Mechanisms of dissolution of fast release solid dispersions. Drug Dev. Ind. Pharm., v.11, p.697-724, 1985.
DHIRENDRA, K.L.; UDUPA, N.; ATIN, K. Solid dispersions: A review. Pak. J. Pharm. Sci., v.22, 234-246, 2009.
DINUNZIO, J.C.; WILLILAMS, R.O. CNS disorders – Current
treatment options and the prospects for advanced therapies. Drug. Dev. Ind. Pharm., v.34, p.1141-1167, 2008.
HAMID, A.M.; HARRIS, A.S.; JAWERIA, T. Once daily tablet
formulation and in vitro release evaluation of cefodoxime using hydroxypropylmethyl cellulose tablet: a technical note, AAPS Pharmscitech., v.7, E1- E6, 2006.
HIGUCHI, T.; CONNORS, K.A. Phase-solubility techniques. Adv. Anal. Chem. Instrum., v.4 p.117-212, 1965.
HIRIYANNA, S.G.; BASAVAIAH, K.; GOUD, P.S.K.;
DHAYANIDHII, V.; RAJU, K.; PATIL, H.N.; Identiication
and characterization of olanzapine degradation products under oxidative stress conditions. Acta Chromatogr., v.20, p.81-93, 2008.
KARAVAS, E.; EMMANUEL, G.; SIGALAS, M. P.; AVGOUSTAKIS, K., BIKIARIS, D. Investigation of release mechanism of sparingly water-soluble drug from solid dispersion in hydrophilic carriers based on physical state of drug, particle size distribution and drug-polymer interactions. Eur. J. Pharm. Biopharm., v.66, p.334-347, 2007.
KHAN, K.A.; The concept of dissolution eficiency. J. Pharm.
Pharmacol., v.27, 48-49, 1975.
LIPINSKI, C.A. Poor aqueous solubility: an industry wide problem in drug discovery. Am. Pharm. Rev., v.5, p.82-85, 2002.
LEUNER, C.; DRESSMAN, J. Improving drug solubility for oral delivery using solid dispersions. Eur. J. Pharm. Biopharm., v.50, p.47-60. 2000.
MANISH, T.; GARIMA, C.; ARVIND, K.B. Quantification of olanzapine polymorphs by powder X- ray diffraction technique. J. Pharm. Biomed. Anal., v.43, p.865-872, 2007.
MARKUS, V.; KLAUS, K.; JENNIFER, D. Dissolution improvement of four poor water soluble drugs by co-grinding with commonly used excipients. Eur. J. Pharm. Biopharm., v.68, p.330-337, 2008.
MASATAKA, S.; TAKASHI, U.; YASUO, N.; YASUYUKI, S.; ATSUO, M.; TAKASHI, S. Preparation and dissolution characteristics of Griseofulvin solid dispersions with saccharides. Int. J. Pharm., v.249, p.71-79, 2002.
MEHDI, A.; MARYAM, K.; MONIREH, A. The study of drug permeation through natural membrane. Int. J. Pharm., v.327, p.6-11, 2006.
NATALIJA, Z.; ALES, O.; MARJAN, B.; STANE, S. Physico-chemical properties and dissolution behavior of Nifedipine/ Mannitol solid dispersions prepared by hot melt method. Int. J. Pharm., v.291, p.51-58, 2005.
NOKODICHII, A.; MOHAMMAD, B.J.; VALIZADEH, H.; MOHAMMAD, R.S.S.; KHOSRO, A.; GHOBAD, M.; AMIN, F.; ZEYNAB, A.; Co grinding as an approach to enhance dissolution rate of poor water soluble drugs (Gliclazide). Powder Technol., v.197, p.150-156, 2010.
PINNAMANENI, S.; DAS, N.G.; DAS, S.K. Formulation approaches for orally administered poorly soluble drugs. Pharmazie, v.57, p.291-300, 2002.
SHOUKRI, R.A.; AHMAD, I.S.; SHAMMA, R.N.; In-vitro and in -vivo evaluation of nimesulide lyophilized orally disintegrating tablets. Eur. J. Pharm. Biopharm., v.73, p. 162-171, 2009.
SERAJUDDIN, A.T.M. Solid dispersion of poorly water-soluble drugs: early promises, subsequent problems, and recent breakthroughs. J. Pharm. Sci., v.88, p.1058-1066, 1999.
SINGH, B.; NAVEEN, A.; KATARE, O.P. Studies on dissolution enhancement and mathematical modeling of drug release of a poor water soluble drug using water soluble carriers. Eur. J. Pharm. Biopharm., v.65, p.36-38, 2009.
SUNIL, K.B.; MICHAEL, A.R.; SOUMYAJIT, M.; RAO, Y. Formulation and evaluation of rapidly disintegrating Fenoverine tablets: Effect of superdisintegrant. Drug Dev. Ind. Pharm., v.33, p.1225-1232, 2007.
VALIZADEH, H.; NOKHODICHI, A. Physiochemical characterization of solid dispersions of indomethacin with PEG 6000, Myrj 52,Lactose, Sorbitol, Dextrin and Eudragit E 100. Drug Dev. Ind. Pharm., v.30, p.303-317, 2004