Access to continued-use
medication among older
adults, Brazil
Acesso a medicamentos de uso
contínuo entre idosos, Brasil
I Programa de Pós-Graduação em Saúde Coletiva. Departamento de Epidemiologia. Instituto de Estudos em Saúde Coletiva. Universidade Federal do Rio de Janeiro. Rio de Janeiro, RJ, Brasil
II Instituto de Estudos em Saúde Coletiva. Universidade Federal do Rio de Janeiro. Rio de Janeiro, RJ, Brasil
III Programa de Pós-Graduação em Saúde Coletiva. Instituto de Medicina Social. Universidade Estadual do Rio de Janeiro. Rio de Janeiro, RJ, Brasil
Correspondence: Karynna Pimentel Viana
Rua Dr. Pereira Nunes, 35 apto 302 Ingá 24210-420 Niterói, RJ, Brasil
E-mail: [email protected] Received: 1/30/2014
Approved: 9/11/2014
Article avaiable from: www.scielo.br/rsp
ABSTRACT
OBJECTIVE: To determine the prevalence and associated access factors for all continued-use prescription drugs and the ways in which they can be obtained.
METHODS: Data was obtained from the 2008 Household National Survey. The sample comprised 27,333 individuals above 60 years who reported that they used continued-use prescription drugs. A descriptive analysis and binary and multiple multinomial logistic regressions were performed.
RESULTS: 86.0% of the older adults had access to all the medication they needed, and among them, 50.7% purchased said medication. Those who obtained medication from the public health system were younger (60-64 years), did not have health insurance plans, and belonged to the lower income groups. It is remarkable that 14.0% of the subjects still had no access to any continued-use medication, and for those with more than four chronic diseases, this amount reached 22.0%. Those with a greater number of chronic diseases ran a higher risk of not having access to all the medication they needed.
CONCLUSIONS: There are some groups of older adults with an increased risk of not obtaining all the medication they need and of purchasing it. The results of this study are expected to contribute to guide programs and plans for access to medication in Brazil.
DESCRIPTORS: Aged. Drug Utilization, economics. Drugs of
Continuous Use. Pharmaceutical Preparations, supply & distribution. Population Surveys.
Karynna Pimentel VianaI
Alexandre dos Santos BritoII
Claudia Soares RodriguesIII
2 Access to medication in Brazil Viana KP et al
The aging of the population is a prominent global phenomenon.2,7 In Brazil, individuals above 65
years represented 4.8% of the population in 1991; however, in 2010, this group comprised 7.4%.a The
increase in the aging population has led to a greater frequency of chronic diseases; consequently, an increase in the demand for health services and medi-cation.12,20 In the United States, it is estimated that
approximately one-third of all medication used is for individuals above 60 years.21 In addition, studies
show that the majority of older adults use more than one medication.11,18
Assuring access to essential medication for older adults has been a priority for the BrazilianMedication Policyb and the Statute for the Elderlyc since 2003.
Thus, some of the initiatives of the Brazilian Uniied
RESUMO
OBJETIVO: Analisar a prevalência e fatores associados com o acesso a medicamentos de uso contínuo e formas de sua obtenção.
MÉTODOS: Foram obtidos dados da Pesquisa Nacional por Amostras em Domicílio de 2008. A amostra foi composta por 27.333 indivíduos com idade acima de 60 anos que reportaram utilizar medicamentos de uso contínuo. Foram utilizados modelos de regressão logística multinomial binário e múltipla para análise dos dados.
RESULTADOS: Tiveram acesso a todos os medicamentos 86,0% dos idosos, dos quais 50,7% os obtiveram por compra. Aqueles que os obtiveram do sistema público de saúde eram mais jovens (60-64 anos), não tinham plano de saúde e pertenciam a grupos com menor renda. Dos idosos que usam medicamentos de uso contínuo, 14,0% não receberam nenhum dos medicamentos; para aqueles com mais de quatro doenças crônicas esse valor chegou a 22,0%; aqueles com maior número de morbidades crônicas tiveram maior risco de não conseguir todos os medicamentos.
CONCLUSÕES: Alguns grupos de idosos apresentam risco aumentado de não obter todos os medicamentos necessários e de comprar todos os medicamentos. Esses resultados podem orientar programas e planos de acesso a medicamentos no Brasil.
DESCRITORES: Idoso. Uso de Medicamentos, economia. Medicamentos de Uso Contínuo. Preparações Farmacêuticas, provisão & distribuição. Inquéritos Demográicos
INTRODUCTION
Health System (SUS) have been performed for these purposes, such as the distribution of medication for Alzheimer or Parkinson’s disease,14 or the Programa
Farmácia Popular (People’s Pharmacy Program) and the Programa Saúde Não Tem Preço (Health Has No Price Program),d which offer free medication for
diabetes and hypertension.
Epidemiological research has discovered a high preva-lence of medication use in older adults in Brazil, which varies5,8 based on socioeconomic characteristics and the
seriousness of the disease.5 Thus, it is more dificult or
impossible for certain groups to access said medica-tion. This fact can contribute to problems such as the spending of an uneven amount of family income6 or
under the use of necessary medication.13
a Instituto Brasileiro de Geografia e Estatística. Census first final results: Brazil has a population of 190,755,799 residents. Rio de Janeiro: IBGE; 2010 [cited 2013 Feb 2]. Available from: http://saladeimprensa.ibge.gov.br/en/noticias?view=noticia&id=1&busca=1&idnoticia=1866 b Ministério da Saúde, Secretaria de Políticas de Saúde, Departamento de Formulação de Políticas de Saúde. Política nacional de medicamentos. Brasília (DF); 2001. (Série C. Projetos, Programas e Relatórios, 25).
c Brasil. Lei nº 10.741 de 1º de outubro de 2003. Dispõe sobre o Estatuto do Idoso e dá outras providências. Diario Oficial Uniao. 3 out 2003. Artigo 15, Seção V,§ 2o.
In 2009, Brazilian families spent 56.2 billion reals on medications.e A population-based study conducted in
Florianópolis, SC, Southeastern Brazil, showed that the difference in the amount of income dedicated to the purchase of medications was four times higher for the poor when compared to the wealthier class.6 In turn,
the underuse of medication can lead to worse clinical outcomes and a lower quality of life for patients. It also can increase their spending on secondary and tertiary care and often leads to the need for greater doses of medication, and consequently, a greater risk of adverse events.10,17
Data about access to medication are important tools for characterizing the health system15 and supporting
poli-cies and actions aimed at expanding access to priority groups. In this context, this study aimed to analyze the prevalence of continued-use prescription drugs and the factors associated with accessing and obtaining them.
METHODS
Data obtained from the National Household Survey (PNAD)in 2008f was used seeing that it was the most
recent study containing health questions. The PNAD is a cross-sectional study with national coverage conducted annually with the aim of providing informa-tion about the general characteristics of the populainforma-tion, such as education, work, and income.f
The PNAD sampling plan includes complex samples, incorporating the stratification of sampling units, conglomeration (sample selection in various stages, with compound sampling units), unequal selection probabilities in one or more stages, and adjustments made for the weighting of the sample to calibrate it with the total known population.
Of the 391,868 individuals studied in the PNAD in 2008, those above 60 years who reported that they used continued-use prescription drugs were selected to partici-pate in this study. They totaled 27,333 individuals.
The outcome variable was access to medication and was measured by the following questions:
• Question 1: “The last time that you needed con-tinued-use prescription drugs, how many of them did you receive for free?” Response categories: All, Some, and None.
• Question 2: “Of the continued-use prescription drugs that you did not receive for free, how many of them did you have to buy?” Response categories: All, Some, and None.
The individuals were categorized by their type of access to medication based on their responses to these questions:
• Free – individuals who stated that they had recei-ved all the medication for free, i.e., those who res-ponded “all” to question 1.
• Purchasers – individuals who purchased all their medications, i.e., those who responded “none” to question 1 and “all” to question 2.
• Mixed – individuals who received some of their medication for free and purchased the rest, i.e., those who responded “some” to question 1 and “all” to questions 2.
• Partial or no access – individuals who only recei-ved or purchased some of the medication they nee-ded (either for free or through purchase) or did not receive or purchase any medication. This group includes those who responded “some” to ques-tion 1 and “some” or “none” to quesques-tion 2, as well as those who responded “none” to question 1 and “some” or “none” to question 2.
The group that responded as receiving the drugs for free was analyzed in this study as though they received SUS drugs. This is because they are used on a regular basis, and although some individuals may have received the drugs from friends, relatives, health plans, or another source, it is likely that these represent a small percentage of those who receive medication.
The independent variables were chosen according to the Andersen theoretical model1 (1995) and the availability
of the PNAD. This model has often been used in studies investigating access to and use of health services.19
The independent variables were geographic region (North, Northeast, Southeast, South, and Midwest), age range (60-64, 65-69, 70-74, and ≥ 75 years), sex (feminine and masculine) location of home (urban and rural), perceived health status (good or very good, regular, and bad or very bad), number of morbidities stated (0, 1, 2-3, and ≥ 4), medical consultation in the last twelve months (yes or no), regularly seeks the same health service (yes or no), and income (group 1, group 2, and group 3). As for the reported morbidity variable, only the 12 morbidities investigated in the PNAD were included, i.e., spine diseases or back pain; arthritis or rheumatism, cancer, diabetes, bronchitis or asthma, hypertension, heart disease, chronic kidney failure, depression, tuberculosis, tendinitis or tenosy-novitis, and cirrhosis.
e Instituto Brasileiro de Geografia e Estatística. Conta-satélite de Saúde Brasil - 2007-2009: despesas de consumo intermediário e final da administração pública: uma análise dos dados de medicamentos. Rio de Janeiro: IBGE; 2012. (Contas Nacionais, 37).
4 Access to medication in Brazil Viana KP et al
The income group variable was constructed from the monthly family income per capita available on the National Household Survey database. The cutoff points for each income group were chosen to categorize three income groups, seeking greater homogeneity within the deined categories. The income groups were deined as group 1 – individuals with family income per capita above the 90th percentile, i.e., monthly family income
greater than R$1,635.00, group 2 – family incomes between the 90th percentile and the 50th, i.e., monthly
family income between R$460.00 and R$1,635.00, and group 3 – monthly per capita income below the 50th percentile, i.e., those with a family monthly
per capita income less than R$460.00.g
Prevalence rates were estimated for each type of access to continued-use prescription drugs and for each type of access by income group.
The statistical association between the dependent and independent variables was assessed using the Chi-square test. The variables associated with the dependent vari-able (p < 0.05) in the bivariate analysis were included in a multivariate multinomial logistic regression model.
Analyses were performed using SPSS for Windows software, version 17, and we took the sample weights and structural information of the sampling plan (conglomerates and stratiication) into consideration. To maintain the use of sample size in the inferences made, corrected sample weights were used for adjust-ment purposes (said weights were deined by the ratio between the natural weights of the design and their arithmetic mean).
RESULTS
Table 1 presents a description of the population studied and the frequency of each type of access, according to socioeconomic, demographic, and health variables. The majority of older adults who reported using continued-use prescription drugs came from the Southeast and had the following characteristics: they were women, resided in urban areas, had health insurance plans, and had at least one chronic disease.
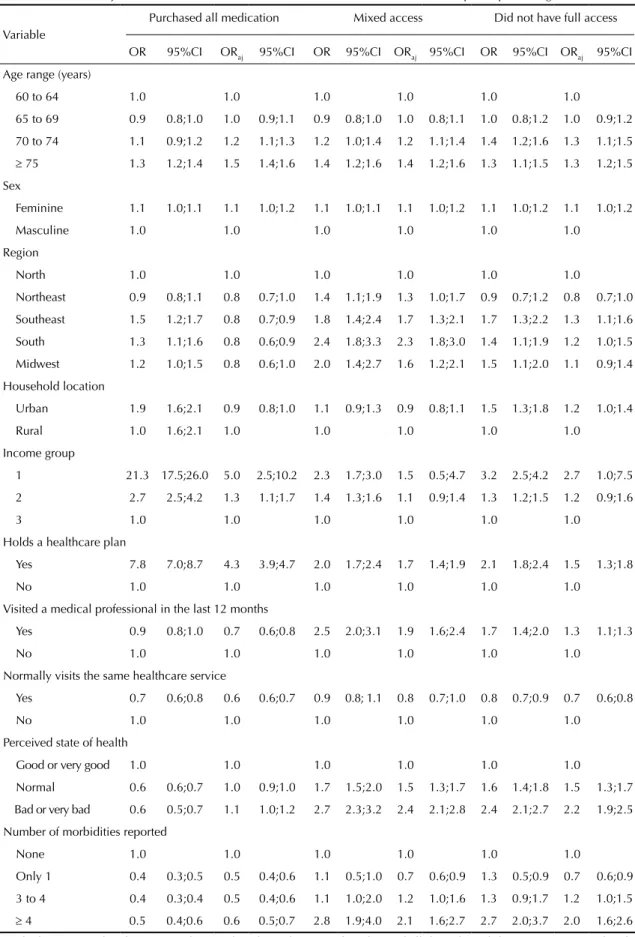
The majority (86.0%) of older adults had access to continued-use prescription drugs the last time they needed them. The Figure shows that the majority of older adults bought all their continued-use prescrip-tion drugs the last time they needed them (41.6%), and 14.1% of them did not have any access to the medica-tion through health services. The majority of the latter group (14.1%) received some medication and bought the rest, 5.4% never obtained any medication, 3.2%
did not receive any medication but bought some, and 1.4% received some medication but did not buy any.
Those who belonged to income group 3 (lower income) and those living in rural areas had a higher prevalence of full free access to medication. On the other hand, in all of the other subgroups analyzed, the main method of access was by purchase. The groups whose individ-uals with a higher prevalence of a total lack of access to medication reported that their health was bad or very bad, mainly belonged to income group 3 (lower income) and had four or more chronic diseases (Table 1).
Table 2 shows the results of the bivariate and multivar-iate multinomial analyses, in which the group of indi-viduals who received all their medication for free was compared to the other three groups, i.e., those who had full access by purchase, those who had mixed access, and who did not have full access. Given that they were deemed statistically signiicant in the bivariate anal -ysis, all control variables were included in the multi-variate analysis. Adjusted association measurements (Table 2) showed that the possibility of purchasing the medication, compared to those who received it all free of charge, was higher for older adults who had health insurance (OR = 7.4), belonged to older age groups, consulted at least one doctor in the last 12 months (OR = 0.9) and did not always return to the same health-care service (OR = 0.7).
The possibility of having mixed access to medication was greater for older adults who had a worse state of health, a greater number of medical visits in the last 12 months, held health insurance plans, and belonged to the older age groups, when compared to those who had free access.
The possibility of not having full access, when compared to those who obtained all their medications for free, was greater for those who had a worse state of health, a greater number of morbidities, did not visit the same healthcare center, were in the older age groups, and were residents of the South or Southeast regions.
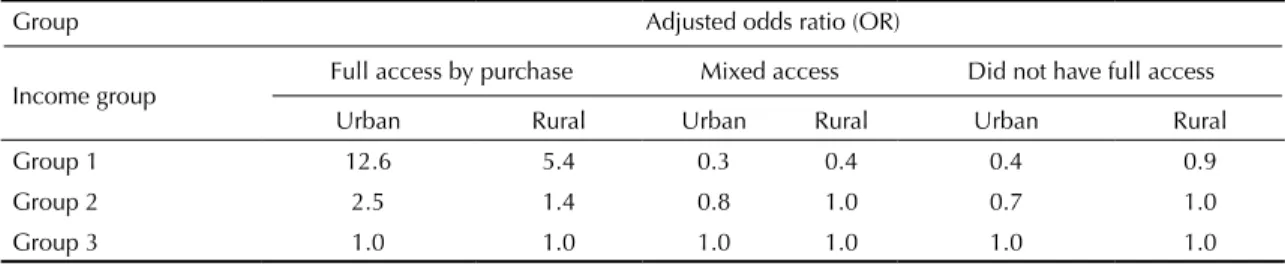
Out of all the variables tested, only the socioeconomic variable and the location of the household were statis-tically signiicant. The measurements of the ratios of possibility of access to medication for these variables are presented in Table 3.
In the interaction (Table 3) analysis, the chance of purchasing all medications needed compared to receiving all for free was greater in urban areas, in income groups 1 and 2, and in income group 1, regard-less of the location of the household. In income group 3 (lowest income), there was no difference between urban and rural households. On the other hand, the possibility of having mixed access to medication compared to
5
Variable
n % Prevalence % 95%CI Prevalence % 95%CI Prevalence % 95%CI Prevalence % 95%CI
Age range (years)
60 to 64 7,573 27.7 33.6 32.3;34.9 42.7 41.3;44.2 10.6 9.7;11.5 13.1 12.2;14.0
65 to 69 6,453 23.3 34.5 33.2;35.9 40.8 39.3;42.3 10.6 9.7;11.7 14.0 13.0;15.1
70 to 74 5,244 19.2 30.0 28.6;31.5 42.8 41.1;44.5 11.6 10.6;12.8 15.6 14.3;16.9
≥ 75 8,063 29.5 26.9 25.7;28.2 47.0 45.6;48.5 11.9 11.0;12.8 14.1 13.1;15.2
Sex
Masculine 10,373 38.0 32.5 31.0;33.6 43.0 41.8;44.2 10.7 9.9;11.5 13.8 12.9;14.7
Feminine 16,960 62.0 30.4 29.5;31.3 43.9 42.8;44.9 11.5 10.8;12.1 14.3 13.6;15.0
Region
North 1,086 4.0 35.8 33.1;38.7 43.4 40.4;46.4 7.5 6.4;8.9 13.3 11.5;15.2
Northeast 6,118 22.4 39.1 37.3;40.9 39.2 37.4;41.1 10.3 9.2;11.5 11.3 10.3;12.5
Southeast 13,852 50.6 28.0 26.9;29.2 46.1 44.6;47.6 10.5 9.6;11.4 15.4 14.4;16.5
South 4,540 17.0 29.1 27.0;31.3 41.9 39.5;44.2 15.1 13.3;17.1 13.9 12.5;15.5
Midwest 1,647 6.0 31.2 28.9;33.6 43.1 40.5;45.8 11.3 9.7;13.1 14.4 12.5;16.5
Location
Urban 23,583 86.3 29.6 28.7;30.4 45.3 44.3;46.3 10.9 10.2;11.5 14.3 13.6;15.0
Rural 3,750 13.7 41.3 39.0;43.6 32.7 30.4;35.1 13.0 11.3;14.8 13.0 11.5;14.8
6
Access to medication in Br
azil
V
iana KP et al
Continuation
Income group
1 2,568 9.4 9.9 8.7;11.2 76.4 74.5;78.3 4.7 4.0;5.6 9.0 7.8;10.3
2 10,848 39.6 26.0 24.9;27.2 49.3 48.0;50.6 11.4 10.5;12.3 13.3 12.5;14.2
3 12,700 46.5 41.9 40.7;43.0 28.9 27.8;30.1 12.9 12.1;13.8 16.3 15.4;17.3
Missing 1,216 4.2
Held a healthcare plan
Yes 9,446 34.6 13.2 12.4;14.1 68.7 67.2;69,9 7.9 7.2;8.7 10.2 9.3;11.1
No 17,887 65.4 40.7 39.7;41.7 30.3 29.3;31.3 12.9 12.1;13.6 16.2 15.4;17.0
Visited a medical professional in the past 12 months
Yes 24,907 91.1 30.9 30.0;31.7 42.9 41.9;43.8 11.7 11.1;12.4 14.5 13.9;15.2
No 2,425 8.9 34.5 32.3;36.8 50.7 48.3;53.1 5.2 4.3;6.3 9.6 8.3;11.1
Normally visits the same healthcare service
Yes 22,014 80.5 32.2 31.3;33.1 42.2 41.2;43.3 11.5 10.8;12.2 14.1 13.4;14.8
No 5,319 19.5 26.9 25.3;28.5 49.0 47.2;50.7 9.9 8.9;10.9 14.3 13.1;15.6
Perceived state of health
Good or very good 9,837 36.0 29.8 28.6;31.1 54.4 53.0;55.8 6.7 6.1;7.3 9.1 8.4;9.9
Normal 12,812 46.9 33.1 32.0;34.1 39.4 38.2;40.6 12.1 11.3;12.9 15.5 14.6;16.4
Bad or very bad 4,668 17.1 28.9 27.3;30.5 32.2 30.5;33.8 18.1 16.7;19.5 20.9 19.5;22.4
Number of morbidities reported
None 1,840 6.7 21.1 19.1;23.3 65.2 62.6;67.7 5.7 4.6;7.1 8.0 6.7;9.5
1 7,821 28.7 36.9 35.6;38.2 46.9 45.5;48.4 6.8 6.2;7.5 9.4 8.6;10.2
3 to 4 12,931 47.3 32.1 31.0;33.2 40.9 39.8;42.1 12.0 11.2;12.9 15.0 14.1;15.8
Figure. Prevalence of the type of access to continued-use medication by older adults.
31.1% 43.6% 11.2% 14.1% 0.0 5.0 10.0 15.0 20.0 25.0 30.0 35.0 40.0 45.0 50.0 (%) Free access Access by purchase Mixed access
Did not have full access
having free access did not present a large difference in regards to region for all income groups. The possibility of not having full access compared to that of acquiring medication for free was less for the members of income group 1 living in urban areas (OR = 0.4).
DISCUSSION
The results of this study showed that a signiicant proportion of older adults who use medication regu-larly had access to medication the last time they needed it. However, these results were different between subgroups of varying socioeconomic levels, demo-graphic regions, and state of health. Furthermore, more than 50.0% of the older adults who had access to medication purchased all the medication they needed. A signiicant percentage of older adults (86.0%) had access to all the continued-use prescription drugs the last time they needed them roughly the same as has been found in other studies, despite the differences in methodologies used.8,15 As has already been mentioned,
this prevalence varied between subgroups. The lack of access to medication, which affected 14.0% of older adults, reached 22.0% in older adults who had four or more chronic diseases.
Ensuring access to medication is considered one of the millennium goals and has often been discussed in the literature.16 Consequently, understanding the aging
population (which is the main consumer of medica-tions) in terms of their access to and use of drugs is extremely important when trying to achieve this goal. Thus, the results of this study showed that the older adults who were in the group that did not receive all their medications had worse states of health, (a greater number of chronic diseases and a worse perceived state of health) and were in older age ranges than those who
had free access. This could be due to the fact that the public health system only offers treatment and medi-cation for certain types of illnesses, which inherently deprives some patients of the possibility of obtaining medication for at least one disease.
The majority of older adults bought all or part of their continued-use prescription drugs, a fact that was already highlighted in the medical literature.5 In this study,
approximately 29.0% of the older adults who belonged to the lowest income group (Group 3) bought all their continued-use prescription drugs the last time they needed them, which could certainly compromise their household incomes, even for basic needs.
The possibility of purchasing medication was greater for those who lived in urban areas and belonged to the higher income groups (Groups 1 and 2). This may be due to the fact that urban areas have more pharma-cies than rural areas. However, different factors could also lead individuals to purchase medication instead of accessing public healthcare services, such as a lack of availability of medication through public chan-nels, which appears to be the cause of the problem.5
Furthermore, the availability of generic medications in the public healthcare system is lower than expected, and consequently, patients tend to purchase their medication in private pharmacies.5 However, the individuals who
reported purchasing medications may be buying them at a low price via the People’s Pharmacy Program. The inability to differentiate this group in the analysis is a limitation of this study.
Access to medications was associated with state of health and sociodemographic variables. In general, when compared with the other groups, individuals who had free access were in the youngest age range of older adults, returned more often to the same places for health care, had consulted a doctor in the last 12 months, and did not have health insurance. These results are similar to what was found in other studies that characterized the popu-lation that received free medications through the SUS.3,4
The absence of a recall period is also a limitation to this study, and it does not allow for comparability with other studies and may not capture the full scale of the problem, since it does not deine how long the patients may be without their medication. The group that reported obtaining all their medication free of charge is also a limiting factor because of the fact that although they have been categorized as using the SUS, there may be other older adults in the group who received the free medication by other means.
Income has been identiied as one of the single best indicators of lifestyle in epidemiological studies.9
8 Access to medication in Brazil Viana KP et al
Table 2. Crude and adjusted odds ratios of factors associated with access to continued-use prescription drugs.*
Variable
Purchased all medication Mixed access Did not have full access
OR 95%CI ORaj 95%CI OR 95%CI ORaj 95%CI OR 95%CI ORaj 95%CI
Age range (years)
60 to 64 1.0 1.0 1.0 1.0 1.0 1.0
65 to 69 0.9 0.8;1.0 1.0 0.9;1.1 0.9 0.8;1.0 1.0 0.8;1.1 1.0 0.8;1.2 1.0 0.9;1.2
70 to 74 1.1 0.9;1.2 1.2 1.1;1.3 1.2 1.0;1.4 1.2 1.1;1.4 1.4 1.2;1.6 1.3 1.1;1.5
≥ 75 1.3 1.2;1.4 1.5 1.4;1.6 1.4 1.2;1.6 1.4 1.2;1.6 1.3 1.1;1.5 1.3 1.2;1.5
Sex
Feminine 1.1 1.0;1.1 1.1 1.0;1.2 1.1 1.0;1.1 1.1 1.0;1.2 1.1 1.0;1.2 1.1 1.0;1.2
Masculine 1.0 1.0 1.0 1.0 1.0 1.0
Region
North 1.0 1.0 1.0 1.0 1.0 1.0
Northeast 0.9 0.8;1.1 0.8 0.7;1.0 1.4 1.1;1.9 1.3 1.0;1.7 0.9 0.7;1.2 0.8 0.7;1.0
Southeast 1.5 1.2;1.7 0.8 0.7;0.9 1.8 1.4;2.4 1.7 1.3;2.1 1.7 1.3;2.2 1.3 1.1;1.6
South 1.3 1.1;1.6 0.8 0.6;0.9 2.4 1.8;3.3 2.3 1.8;3.0 1.4 1.1;1.9 1.2 1.0;1.5
Midwest 1.2 1.0;1.5 0.8 0.6;1.0 2.0 1.4;2.7 1.6 1.2;2.1 1.5 1.1;2.0 1.1 0.9;1.4
Household location
Urban 1.9 1.6;2.1 0.9 0.8;1.0 1.1 0.9;1.3 0.9 0.8;1.1 1.5 1.3;1.8 1.2 1.0;1.4
Rural 1.0 1.6;2.1 1.0 1.0 1.0 1.0 1.0
Income group
1 21.3 17.5;26.0 5.0 2.5;10.2 2.3 1.7;3.0 1.5 0.5;4.7 3.2 2.5;4.2 2.7 1.0;7.5
2 2.7 2.5;4.2 1.3 1.1;1.7 1.4 1.3;1.6 1.1 0.9;1.4 1.3 1.2;1.5 1.2 0.9;1.6
3 1.0 1.0 1.0 1.0 1.0 1.0
Holds a healthcare plan
Yes 7.8 7.0;8.7 4.3 3.9;4.7 2.0 1.7;2.4 1.7 1.4;1.9 2.1 1.8;2.4 1.5 1.3;1.8
No 1.0 1.0 1.0 1.0 1.0 1.0
Visited a medical professional in the last 12 months
Yes 0.9 0.8;1.0 0.7 0.6;0.8 2.5 2.0;3.1 1.9 1.6;2.4 1.7 1.4;2.0 1.3 1.1;1.3
No 1.0 1.0 1.0 1.0 1.0 1.0
Normally visits the same healthcare service
Yes 0.7 0.6;0.8 0.6 0.6;0.7 0.9 0.8; 1.1 0.8 0.7;1.0 0.8 0.7;0.9 0.7 0.6;0.8
No 1.0 1.0 1.0 1.0 1.0 1.0
Perceived state of health
Good or very good 1.0 1.0 1.0 1.0 1.0 1.0
Normal 0.6 0.6;0.7 1.0 0.9;1.0 1.7 1.5;2.0 1.5 1.3;1.7 1.6 1.4;1.8 1.5 1.3;1.7
Bad or very bad 0.6 0.5;0.7 1.1 1.0;1.2 2.7 2.3;3.2 2.4 2.1;2.8 2.4 2.1;2.7 2.2 1.9;2.5
Number of morbidities reported
None 1.0 1.0 1.0 1.0 1.0 1.0
Only 1 0.4 0.3;0.5 0.5 0.4;0.6 1.1 0.5;1.0 0.7 0.6;0.9 1.3 0.5;0.9 0.7 0.6;0.9
3 to 4 0.4 0.3;0.4 0.5 0.4;0.6 1.1 1.0;2.0 1.2 1.0;1.6 1.3 0.9;1.7 1.2 1.0;1.5
≥ 4 0.5 0.4;0.6 0.6 0.5;0.7 2.8 1.9;4.0 2.1 1.6;2.7 2.7 2.0;3.7 2.0 1.6;2.6
categorize three different income groups with established proportions. However, it is possible that the values used did not fully relect Brazilian economic groups.
Another limitation of the study is that people tend to underestimate their drug needs;4 therefore, the results
about necessary medication that was not obtained should be interpreted with caution.4
This study provides nationally representative data on the prevalence of the types of access to medication
and investigates possible factors associated with each type of access. It indicates that there are still older adults who did not have full access to continued-use prescription drugs the last time they needed them, and even more signiicantly, that those in lower income groups continue buying the medication they need. In conclusion, it is expected that this study will be able to guide actions aimed at achieving greater availability and quality of pharmaceutical care in the public health system in Brazil.
Table 3. Odds ratio adjusted for comparison among household location, socioeconomic status, and the type of access to
continued-use prescription drugs. Brazil, 2008.*
Group Adjusted odds ratio (OR)
Income group
Full access by purchase Mixed access Did not have full access
Urban Rural Urban Rural Urban Rural
Group 1 12.6 5.4 0.3 0.4 0.4 0.9
Group 2 2.5 1.4 0.8 1.0 0.7 1.0
Group 3 1.0 1.0 1.0 1.0 1.0 1.0
* Reference groups: Free full access and income group 3. Group 1: Monthly family income per capita ≥ R$1,635.00, Group 2:
per capita monthly income between R$460.00 and R$1,635.00, and Group 3: Monthly family income R$460.00.
1. Andersen RM. Revisiting the behavioral model and
access to medical care: does it matter? J Health Soc
Behav. 1995;36(1):1-10.
2. Anderson GF, Hussey PS. Population aging: a comparison among industrialized countries.
Health Aff (Millwood). 2000;19(3):191-203. DOI:10.1377/hlthaff.19.3.191
3. Aziz MM, Calvo MC, Schneider IJC, Xavier AJ, d´Orsi E. Prevalência e fatores associados ao acesso a medicamentos pela população idosa em uma capital do sul do Brasil: um estudo de base populacional.
Cad Saude Publica. 2011;27(10):1939-50. DOI:10.1590/S0102-311X2011001000007
4. Bertoldi AD, Barros AJD, Wagner A, Ross-Degman D, Hallal PC. A descriptive review of the methodologies used in household surveys on medicine
utilization. BMC Health Serv Res. 2008;8:222-30.
DOI:10.1186/1472-6963-8-222
5. Bertoldi AD, Barros AJ, Wagner A, Ross-Degnan D, Hallal PC. Medicine access and utilization in a population covered by primary health care
in Brazil. Health Policy. 2009;89(3):295-302.
DOI:10.1016/j.healthpol.2008.07.001
6. Boing AC, Bertoldi AD, Peres KG. Desigualdades socioeconômicas no gasto e comprometimento da renda com medicamentos no Sul do Brasil.
Rev Saude Publica. 2011;45(5):897-905. DOI:10.1590/S0034-89102011005000054
7. Camarano AA, Kanso S, Melo Jl. Como vive o idoso brasileiro. In: Camarano AA, organizadora. Os novos
idosos brasileiros, muito além dos 60? Rio de Janeiro: IPEA; 2004. Capítulo 1; p.25-73.
8. Carvalho MF, Pascom ARP, Souza-Júnior PRB, Damacena GN, Szwarcwald CL. Utilization of medicines by the Brazilian population, 2003.
Cad Saude Publica. 2005;21(Suppl 1):S100-8. DOI:10.1590/S0102-311X2005000700011
9. Galobardes B, Shaw M, Lawlor DA, Lynch JW, Davey Smith G. Indicators of socioeconomic position (part 1). J Epidemiol Community Health. 2006;60(1):7-12. DOI:10.1136/jech.2004.023531
10. Gurwitz JH, Rochon P. Considerations in designing an ideal medication-use system: lessons from caring for the
elderly. Am J Health Syst Pharm. 2000;57(6):548-51.
11. Jorgensen T, Johansson S, Kennerfalk A, Wallander MA, Svärdsudd K. Prescription drug use, diagnoses,
and healthcare utilization among the elderly. Ann
Pharmacother. 2001;35(9):1004-9. DOI:10.1345/ aph.10351
12. Lima-Costa MF, Barreto S, Giatti L, Uchôa E. Desigualdade social e saúde entre idosos brasileiros: um estudo baseado na Pesquisa Nacional por Amostra
de Domicílios. Cad Saude Publica. 2003;19(3):745-57.
DOI:10.1590/S0102-311X2003000300007
13. Luz TCB, Loyola Filho AI, Lima-Costa MF. Estudo de base populacional da subutilização de medicamentos por motivos financeiros entre idosos na Região Metropolitana de Belo Horizonte, Minas Gerais,
Brasil. Cad Saude Publica. 2009;25(7):1578-86.
DOI:10.1590/S0102-311X2009000700016
10 Access to medication in Brazil Viana KP et al
14. Miyata DF, Vagetti GC, Fanhani JGP, Andrade OG. Políticas e programas na atenção à saúde do idoso:
um panorama nacional. Arq Cienc Saude Unipar.
2005;9(2):135-40.
15. Paniz VM, Fassa AG, Facchini LA, Bertoldi
AD, Piccini RX, Tomasi E, et al.Acesso a
medicamentos de uso contínuo em adultos e idosos nas regiões Sul e Nordeste do Brasil.
Cad Saude Publica. 2008;24(2):267-80. DOI:10.1590/S0102-311X2008000200005
16. Ritz LS, Adam T, Laing R. A bibliometric study of publication patterns in access to medicines research in
developing countries. South Med Rev. 2010;3(1):2-6.
17. Rochon PA, Gurwitz JH. Prescribing for seniors: neither
too much nor too little. JAMA. 1999;282(2):113-5.
DOI:10.1001/jama.282.2.113
18. Rozenfeld S. Prevalência, fatores associados e mau uso de medicamentos entre os idosos: uma
revisão. Cad Saude Publica. 2003;19(3):717-24.
DOI:10.1590/S0102-311X2003000300004
19. Travassos C, Martins M. Uma revisão sobre os conceitos de acesso e utilização de serviços de
saúde. Cad Saude Publica. 2004;20(Supl 2):S190-8.
DOI:10.1590/S0102-311X2004000800014
20. Veras R, Parahyba MI. O anacronismo dos modelos assistenciais para os idosos na área da saúde: desafios para o setor privado.
Cad Saude Publica. 2007;23(10):2479-89. DOI:10.1590/S0102-311X2007001000022
21. Williams CM. Using medications appropriately in
older adults. Am Fam Physician. 2002;66(10):1917-24.
Research partially supported by the Fundação de Amparo à Pesquisa do Rio de Janeiro (FAPERJ – Case E-26/102 357/2013).
Based on the master’s thesis of Viana KP, titled: “Utilização e acesso a medicamentos de uso contínuo em idosos no Brasil
segundo os dados da PNAD 2008”, presented to the Programa de Pós-Graduação em Saúde Coletiva do Instituto de Estudos