ABSTRACT: Objective: To investigate factors associated with seven or more prenatal visits, in Brazil, in 2013. Methods: Cross-sectional study from the database ofInformation System on Live Births. The association of explanatory variables was tested with prenatal visits by means of the analysis of single and multiple multinomial regressions. The spatial distribution of prenatal visits according to the Brazilian municipalities was also analyzed. Results: It was found that 2.7% of pregnant women attended no prenatal visit and 63.1% attended 7 or more. The chance to attend 7 or more prenatal visits was higher among pregnant women aged 40 years or more, with 12 years or more of schooling, living with a roommate, living in the South and Southeast regions, who had a triplet or more pregnancy, with gestational age of 42 weeks or more, and who had children with normal birth weight. Signiicant regional disparities were identiied in the prevalence of women with seven or more prenatal visits. Conclusion: Although Brazil has a Uniied Health System that provides universal prenatal care, the use of this service is uneven according to geographic, demographic, and socioeconomic characteristics. Keywords: Prenatal care. Information systems. Uniied Health System. Risk factors. Health inequalities. Brazil.
Regional diferences and factors associated
with the number of prenatal visits in Brazil:
analysis of the Information System on Live
Births in 2013
Diferenças regionais e fatores associados ao número de consultas de pré-natal
no Brasil: análise do Sistema de Informações sobre Nascidos Vivos em 2013
Juliana Cristine dos AnjosI, Antonio Fernando BoingI
IPostgraduate Program in Public Health, Universidade Federal de Santa Catarina – Florianópolis (SC), Brazil.
Corresponding author: Antonio Fernando Boing. Universidade Federal de Santa Catarina. Departamento de Saúde Pública. Campus Universitário, Trindade, CEP: 88040-970, Florianópolis, SC, Brasil. E-mail: [email protected]
Conlict of interests: nothing to declare – Financial support: none.
INTRODUCTION
Access to prenatal care is associated with better health outcomes for pregnant women and newborns. This care is essential to prevent and/or early detect maternal and fetal patholo-gies, promoting the healthy development of the baby and reducing the risk to the pregnant women1. By monitoring the pregnancy since the irst quarter there is greater possibility of
the mother undergo laboratory tests, reducing maternal and child morbidity and mortality. Consequently, the results are better intrauterine growth, higher birth weight, fewer occur-rences of prematurity and neonatal mortality, and, for the mother, lower rate of complica-tions during pregnancy and at delivery1.
Studies show that the higher the number of prenatal visits, the lower the neonatal2 and
maternal3,4 mortality rates, the prevalence of prematurity3, the low birth weight5,6, and the
hypertension during pregnancy3,4. In this scenario, the anti-tetanus vaccination coverage7
and supplementation with ferrous sulfate7 are also greater.
Owing to these beneits indicated by the literature and in order to improve access, cov-erage, and quality of prenatal care in Brazil, the Ministry of Health launched, in 2000, the Program of Humanization in Prenatal and Birth (PHPN). Among other guidelines, the document recommends that pregnant women attend at least six prenatal visits during preg-nancy: one in the irst quarter, two in the second, and three in the third1.
Studies that analyzed the factors associated with low number of prenatal care visits found that this negative outcome is more common among women with low education8,
pregnant adolescents2,8, with high parity6,8, and living without a partner6. However, in Brazil,
RESUMO:Objetivo: Investigar os fatores associados à realização de sete ou mais consultas pré-natal, no Brasil, no ano de 2013. Métodos: Realizou-se estudo transversal com base no banco de dados do Sistema de Informações sobre Nascidos Vivos. Testou-se a associação de variáveis exploratórias com a realização de consultas pré-natal por meio da análise de regressão multinomial simples e múltipla. Também foi analisada a distribuição espacial da realização de consultas pré-natal segundo os municípios brasileiros. Resultados: Veriicou-se que 2,7% das gestantes não realizaram consulta natal e 63,1% realizaram 7 ou mais consultas. A chance de realizar 7 ou mais consultas pré-natal foi maior entre as gestantes com 40 anos ou mais, com 12 anos ou mais de escolaridade, que viviam com um companheiro, que residiam nas regiões Sul e Sudeste, que tinham gestação tripla ou mais, com idade gestacional de 42 semanas ou mais e que tiveram ilhos com peso normal ao nascer. Identiicou-se expressiva desigualdade regional na prevalência de gestantes com sete ou mais consultas pré-natal. Conclusão: Apesar de o Brasil possuir um Sistema Único de Saúde que oferece assistência pré-natal universal, o uso desse serviço é desigual segundo características geográicas, demográicas e socioeconômicas das gestantes.
published studies refer to municipal and/or regional data2,6,8,and the national data are
essen-tially descriptive9.
To increase knowledge on attending prenatal visits in a country marked by social and economic inequalities and diferences in the access to health services — despite the assis-tance to pregnant women be ofered free under a public and universal health system — is essential to support health policies and actions in the area. Therefore, the present study aimed at investigating the factors associated with conducting prenatal visits in Brazil in 2013.
METHODS
We conducted a cross-sectional study based on microdata coming from Information System on the Live Births (SINASC). Implemented by the Ministry of Health in 1990 to gather epidemiological information concerning births throughout the national territory, SINASC is based on the Declaration of Live Birth (DNV), which includes an extensive set of data on the mother, prenatal care, childbirth, and newborn10.
The population of this study consisted of all live births in 2013 in Brazil. We opted for the year 2013 because it was the last period with complete data available in the system when this research was carried out. The information was obtained in October 2015, based on SINASC microdata, which was made available by the Department of Technology of the Uniied Health System (SUS), and on those of public domain. Initially available in DBC format (database con-tainer), the data were expanded to DBF (database iles) and then converted to DTA (data).
The outcome analyzed was the number of prenatal visit attended by the pregnant women, categorized into four groups by SINASC “no prenatal visit,” “1–3 prenatal visits,” “4–6 pre-natal visits,” and “7 or more prepre-natal visits.” The independent variables were mother’s age (“40 years or more,” “30–39 years,” “20–29 years,” and “up to 19 years”); schooling in years (“illiterate,” “1–3 years”, “4–7 years”, “8–11 years,” and “12 or more”); living with partner (“no,” “yes”); skin color/race of the newborn (“yellow,” “indigenous,” “black,” “white,” and “brown”); region of residence (“Midwest,” “North,” “South,” “Northeast,” and “Southeast”); type of pregnancy (“single,” “twin,” and “triplet or more”); gestational age (“up to 36 weeks,” “ 37–41 weeks,” “42 weeks or more”); and low birth weight (“yes,” “no”).
variable were obtained for all Brazilian municipalities and plotted on a map. The construc-tion and analysis of the database were carried out by means of software TabWin32 (Ministry of Health, Brazil) and Stata 13.1 (Stata Corporation, College Station, USA).
RESULTS
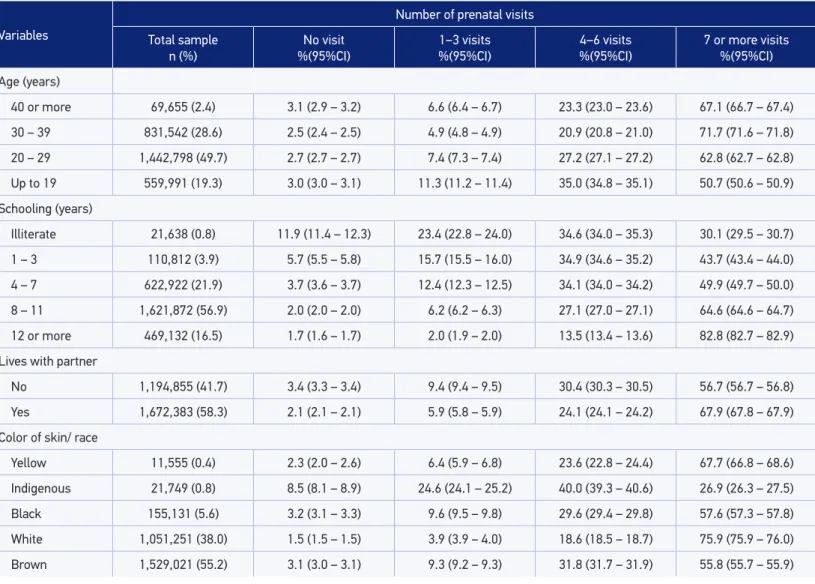
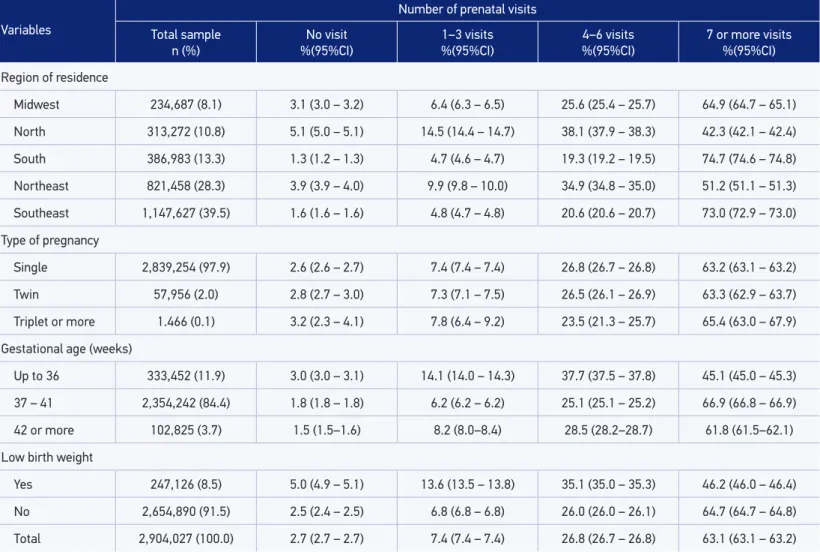
In 2013, 2,904,027 births were registered in Brazil. The average age of pregnant women was 26.0 years (standard deviation of 6.6 years), 55.2% were brown, and 73.4% had eight years or more of schooling. Nearly two in three (63.1%) pregnant women had seven or more prenatal visits. The highest prevalence of occurrence of 7 or more prenatal visits was observed among women who lived in the South Region (74.7%), were aged between 30 and 39 years (71.7%), had 12 years or more of schooling (82.8%), lived with a partner (67.9%), had babies classiied as white (75.9%), had three pregnancies or more (65.4%), had between 37 and 41 weeks of gestation (66.9%), and had children with normal birth weight (64.7%) (Table 1).
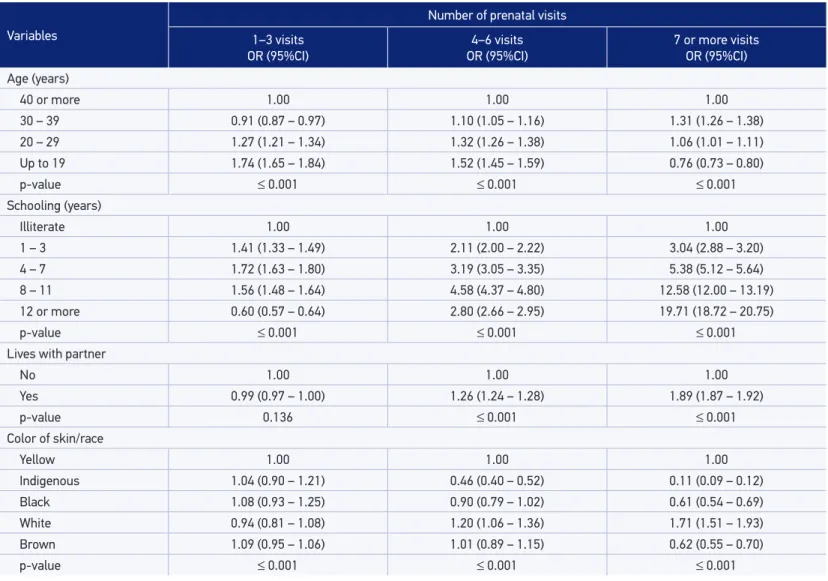
In the crude analysis, all the investigated variables were statistically associated with the prenatal visits attendance (Table 2). Women aged 30–39 years were 1.31 times more likely to have 7 or more prenatal visits in relation to have none when compared to women aged 40 years or more. Pregnant women living with a partner, who had more years of schooling, who had 42 weeks or more of gestation, and had children with normal birth weight showed greater chances to attend seven or more prenatal doctor visits in relation to the reference group.
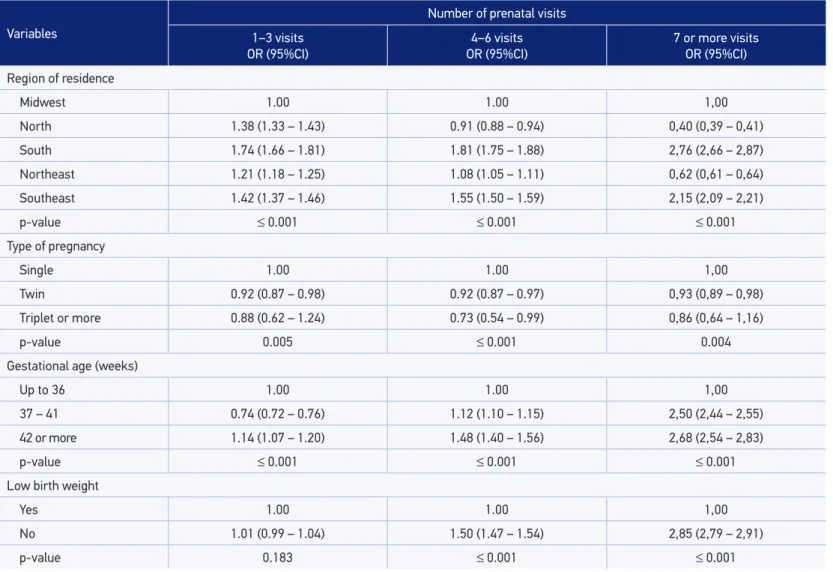
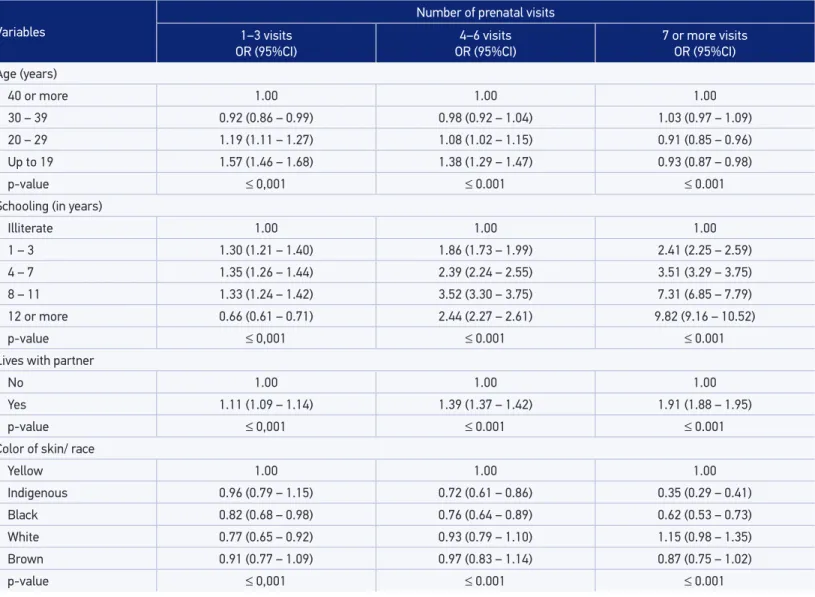
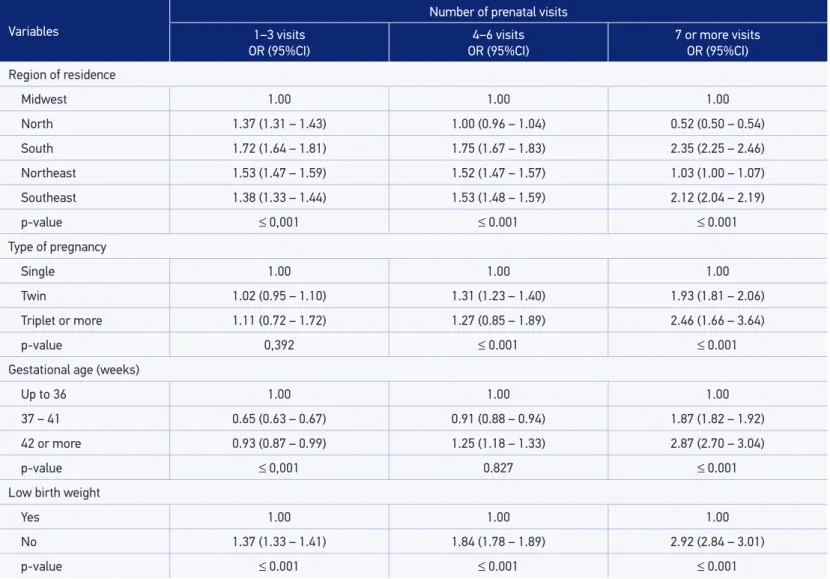
Table 3 shows the variables that remained associated with prenatal visits attendance after the adjusted analysis. The association between the occurrence of seven or more prenatal visits and women aged 30–39 years was not maintained. It is worth noting that women with 12 or more years of schooling were 9.82 times more likely to have 7 or more prenatal visits in relation to do not have any visit, when compared to illiterate women. Women who had babies classiied as indigenou and black were less likely to have seven or more prenatal visits in relation to no prenatal visit when compared to women who had babies classiied as yel-low. In addition, residents in the South and Southeast regions also showed greater chances to perform seven or more visits compared to the reference category.
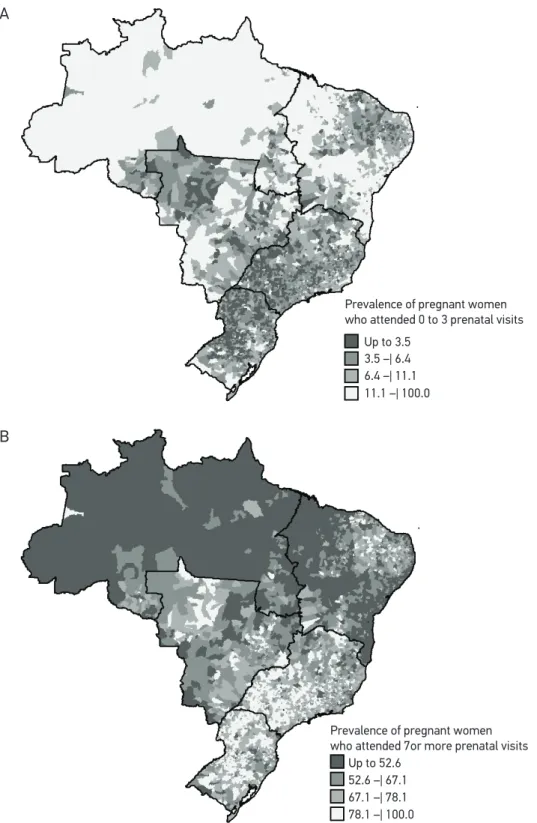
As for the spatial analysis, there were wide regional diferences in the occurrence of pre-natal visits. In the North region, there is greater proportion of municipalities with low prev-alence of occurrence of seven or more prenatal visits and high prevprev-alence of zero to three prenatal visits, whereas in South and Southeast there is greater proportion of municipalities with high percentages of seven or more prenatal visits (Figures 1A and 1B).
DISCUSSION
Table 1. Distribution of risk factors associated with prenatal visits attendance, according to demographic and socioeconomic variables. Brazil, 2013.
Variables
Number of prenatal visits Total sample
n (%)
No visit %(95%CI)
1–3 visits %(95%CI)
4–6 visits %(95%CI)
7 or more visits %(95%CI)
Age (years)
40 or more 69,655 (2.4) 3.1 (2.9 – 3.2) 6.6 (6.4 – 6.7) 23.3 (23.0 – 23.6) 67.1 (66.7 – 67.4)
30 – 39 831,542 (28.6) 2.5 (2.4 – 2.5) 4.9 (4.8 – 4.9) 20.9 (20.8 – 21.0) 71.7 (71.6 – 71.8)
20 – 29 1,442,798 (49.7) 2.7 (2.7 – 2.7) 7.4 (7.3 – 7.4) 27.2 (27.1 – 27.2) 62.8 (62.7 – 62.8)
Up to 19 559,991 (19.3) 3.0 (3.0 – 3.1) 11.3 (11.2 – 11.4) 35.0 (34.8 – 35.1) 50.7 (50.6 – 50.9)
Schooling (years)
Illiterate 21,638 (0.8) 11.9 (11.4 – 12.3) 23.4 (22.8 – 24.0) 34.6 (34.0 – 35.3) 30.1 (29.5 – 30.7)
1 – 3 110,812 (3.9) 5.7 (5.5 – 5.8) 15.7 (15.5 – 16.0) 34.9 (34.6 – 35.2) 43.7 (43.4 – 44.0)
4 – 7 622,922 (21.9) 3.7 (3.6 – 3.7) 12.4 (12.3 – 12.5) 34.1 (34.0 – 34.2) 49.9 (49.7 – 50.0)
8 – 11 1,621,872 (56.9) 2.0 (2.0 – 2.0) 6.2 (6.2 – 6.3) 27.1 (27.0 – 27.1) 64.6 (64.6 – 64.7)
12 or more 469,132 (16.5) 1.7 (1.6 – 1.7) 2.0 (1.9 – 2.0) 13.5 (13.4 – 13.6) 82.8 (82.7 – 82.9)
Lives with partner
No 1,194,855 (41.7) 3.4 (3.3 – 3.4) 9.4 (9.4 – 9.5) 30.4 (30.3 – 30.5) 56.7 (56.7 – 56.8)
Yes 1,672,383 (58.3) 2.1 (2.1 – 2.1) 5.9 (5.8 – 5.9) 24.1 (24.1 – 24.2) 67.9 (67.8 – 67.9)
Color of skin/ race
Yellow 11,555 (0.4) 2.3 (2.0 – 2.6) 6.4 (5.9 – 6.8) 23.6 (22.8 – 24.4) 67.7 (66.8 – 68.6)
Indigenous 21,749 (0.8) 8.5 (8.1 – 8.9) 24.6 (24.1 – 25.2) 40.0 (39.3 – 40.6) 26.9 (26.3 – 27.5)
Black 155,131 (5.6) 3.2 (3.1 – 3.3) 9.6 (9.5 – 9.8) 29.6 (29.4 – 29.8) 57.6 (57.3 – 57.8)
White 1,051,251 (38.0) 1.5 (1.5 – 1.5) 3.9 (3.9 – 4.0) 18.6 (18.5 – 18.7) 75.9 (75.9 – 76.0)
Brown 1,529,021 (55.2) 3.1 (3.0 – 3.1) 9.3 (9.2 – 9.3) 31.8 (31.7 – 31.9) 55.8 (55.7 – 55.9)
Variables
Number of prenatal visits Total sample
n (%)
No visit %(95%CI)
1–3 visits %(95%CI)
4–6 visits %(95%CI)
7 or more visits %(95%CI)
Region of residence
Midwest 234,687 (8.1) 3.1 (3.0 – 3.2) 6.4 (6.3 – 6.5) 25.6 (25.4 – 25.7) 64.9 (64.7 – 65.1)
North 313,272 (10.8) 5.1 (5.0 – 5.1) 14.5 (14.4 – 14.7) 38.1 (37.9 – 38.3) 42.3 (42.1 – 42.4)
South 386,983 (13.3) 1.3 (1.2 – 1.3) 4.7 (4.6 – 4.7) 19.3 (19.2 – 19.5) 74.7 (74.6 – 74.8)
Northeast 821,458 (28.3) 3.9 (3.9 – 4.0) 9.9 (9.8 – 10.0) 34.9 (34.8 – 35.0) 51.2 (51.1 – 51.3)
Southeast 1,147,627 (39.5) 1.6 (1.6 – 1.6) 4.8 (4.7 – 4.8) 20.6 (20.6 – 20.7) 73.0 (72.9 – 73.0)
Type of pregnancy
Single 2,839,254 (97.9) 2.6 (2.6 – 2.7) 7.4 (7.4 – 7.4) 26.8 (26.7 – 26.8) 63.2 (63.1 – 63.2)
Twin 57,956 (2.0) 2.8 (2.7 – 3.0) 7.3 (7.1 – 7.5) 26.5 (26.1 – 26.9) 63.3 (62.9 – 63.7)
Triplet or more 1.466 (0.1) 3.2 (2.3 – 4.1) 7.8 (6.4 – 9.2) 23.5 (21.3 – 25.7) 65.4 (63.0 – 67.9)
Gestational age (weeks)
Up to 36 333,452 (11.9) 3.0 (3.0 – 3.1) 14.1 (14.0 – 14.3) 37.7 (37.5 – 37.8) 45.1 (45.0 – 45.3)
37 – 41 2,354,242 (84.4) 1.8 (1.8 – 1.8) 6.2 (6.2 – 6.2) 25.1 (25.1 – 25.2) 66.9 (66.8 – 66.9)
42 or more 102,825 (3.7) 1.5 (1.5–1.6) 8.2 (8.0–8.4) 28.5 (28.2–28.7) 61.8 (61.5–62.1)
Low birth weight
Yes 247,126 (8.5) 5.0 (4.9 – 5.1) 13.6 (13.5 – 13.8) 35.1 (35.0 – 35.3) 46.2 (46.0 – 46.4)
No 2,654,890 (91.5) 2.5 (2.4 – 2.5) 6.8 (6.8 – 6.8) 26.0 (26.0 – 26.1) 64.7 (64.7 – 64.8)
Total 2,904,027 (100.0) 2.7 (2.7 – 2.7) 7.4 (7.4 – 7.4) 26.8 (26.7 – 26.8) 63.1 (63.1 – 63.2)
95%CI: 95% conidence interval.
Table 2. Crude analysis of the risk factors associated with prenatal visits attendance according to demographic and socioeconomic variables. Brazil, 2013.
Variables
Number of prenatal visits 1–3 visits
OR (95%CI)
4–6 visits OR (95%CI)
7 or more visits OR (95%CI)
Age (years)
40 or more 1.00 1.00 1.00
30 – 39 0.91 (0.87 – 0.97) 1.10 (1.05 – 1.16) 1.31 (1.26 – 1.38)
20 – 29 1.27 (1.21 – 1.34) 1.32 (1.26 – 1.38) 1.06 (1.01 – 1.11)
Up to 19 1.74 (1.65 – 1.84) 1.52 (1.45 – 1.59) 0.76 (0.73 – 0.80)
p-value ≤ 0.001 ≤ 0.001 ≤ 0.001
Schooling (years)
Illiterate 1.00 1.00 1.00
1 – 3 1.41 (1.33 – 1.49) 2.11 (2.00 – 2.22) 3.04 (2.88 – 3.20)
4 – 7 1.72 (1.63 – 1.80) 3.19 (3.05 – 3.35) 5.38 (5.12 – 5.64)
8 – 11 1.56 (1.48 – 1.64) 4.58 (4.37 – 4.80) 12.58 (12.00 – 13.19)
12 or more 0.60 (0.57 – 0.64) 2.80 (2.66 – 2.95) 19.71 (18.72 – 20.75)
p-value ≤ 0.001 ≤ 0.001 ≤ 0.001
Lives with partner
No 1.00 1.00 1.00
Yes 0.99 (0.97 – 1.00) 1.26 (1.24 – 1.28) 1.89 (1.87 – 1.92)
p-value 0.136 ≤ 0.001 ≤ 0.001
Color of skin/race
Yellow 1.00 1.00 1.00
Indigenous 1.04 (0.90 – 1.21) 0.46 (0.40 – 0.52) 0.11 (0.09 – 0.12)
Black 1.08 (0.93 – 1.25) 0.90 (0.79 – 1.02) 0.61 (0.54 – 0.69)
White 0.94 (0.81 – 1.08) 1.20 (1.06 – 1.36) 1.71 (1.51 – 1.93)
Brown 1.09 (0.95 – 1.06) 1.01 (0.89 – 1.15) 0.62 (0.55 – 0.70)
p-value ≤ 0.001 ≤ 0.001 ≤ 0.001
Variables
Number of prenatal visits 1–3 visits
OR (95%CI)
4–6 visits OR (95%CI)
7 or more visits OR (95%CI)
Region of residence
Midwest 1.00 1.00 1,00
North 1.38 (1.33 – 1.43) 0.91 (0.88 – 0.94) 0,40 (0,39 – 0,41)
South 1.74 (1.66 – 1.81) 1.81 (1.75 – 1.88) 2,76 (2,66 – 2,87)
Northeast 1.21 (1.18 – 1.25) 1.08 (1.05 – 1.11) 0,62 (0,61 – 0,64)
Southeast 1.42 (1.37 – 1.46) 1.55 (1.50 – 1.59) 2,15 (2,09 – 2,21)
p-value ≤ 0.001 ≤ 0.001 ≤ 0.001
Type of pregnancy
Single 1.00 1.00 1,00
Twin 0.92 (0.87 – 0.98) 0.92 (0.87 – 0.97) 0,93 (0,89 – 0,98)
Triplet or more 0.88 (0.62 – 1.24) 0.73 (0.54 – 0.99) 0,86 (0,64 – 1,16)
p-value 0.005 ≤ 0.001 0.004
Gestational age (weeks)
Up to 36 1.00 1.00 1,00
37 – 41 0.74 (0.72 – 0.76) 1.12 (1.10 – 1.15) 2,50 (2,44 – 2,55)
42 or more 1.14 (1.07 – 1.20) 1.48 (1.40 – 1.56) 2,68 (2,54 – 2,83)
p-value ≤ 0.001 ≤ 0.001 ≤ 0.001
Low birth weight
Yes 1.00 1.00 1,00
No 1.01 (0.99 – 1.04) 1.50 (1.47 – 1.54) 2,85 (2,79 – 2,91)
p-value 0.183 ≤ 0.001 ≤ 0.001
Table 3. Adjusted analysis of risk factors associated with prenatal visits attendance according to demographic and socioeconomic variables. Brazil, 2013.
Variables
Number of prenatal visits 1–3 visits
OR (95%CI)
4–6 visits OR (95%CI)
7 or more visits OR (95%CI)
Age (years)
40 or more 1.00 1.00 1.00
30 – 39 0.92 (0.86 – 0.99) 0.98 (0.92 – 1.04) 1.03 (0.97 – 1.09)
20 – 29 1.19 (1.11 – 1.27) 1.08 (1.02 – 1.15) 0.91 (0.85 – 0.96)
Up to 19 1.57 (1.46 – 1.68) 1.38 (1.29 – 1.47) 0.93 (0.87 – 0.98)
p-value ≤ 0,001 ≤ 0.001 ≤ 0.001
Schooling (in years)
Illiterate 1.00 1.00 1.00
1 – 3 1.30 (1.21 – 1.40) 1.86 (1.73 – 1.99) 2.41 (2.25 – 2.59)
4 – 7 1.35 (1.26 – 1.44) 2.39 (2.24 – 2.55) 3.51 (3.29 – 3.75)
8 – 11 1.33 (1.24 – 1.42) 3.52 (3.30 – 3.75) 7.31 (6.85 – 7.79)
12 or more 0.66 (0.61 – 0.71) 2.44 (2.27 – 2.61) 9.82 (9.16 – 10.52)
p-value ≤ 0,001 ≤ 0.001 ≤ 0.001
Lives with partner
No 1.00 1.00 1.00
Yes 1.11 (1.09 – 1.14) 1.39 (1.37 – 1.42) 1.91 (1.88 – 1.95)
p-value ≤ 0,001 ≤ 0.001 ≤ 0.001
Color of skin/ race
Yellow 1.00 1.00 1.00
Indigenous 0.96 (0.79 – 1.15) 0.72 (0.61 – 0.86) 0.35 (0.29 – 0.41)
Black 0.82 (0.68 – 0.98) 0.76 (0.64 – 0.89) 0.62 (0.53 – 0.73)
White 0.77 (0.65 – 0.92) 0.93 (0.79 – 1.10) 1.15 (0.98 – 1.35)
Brown 0.91 (0.77 – 1.09) 0.97 (0.83 – 1.14) 0.87 (0.75 – 1.02)
p-value ≤ 0,001 ≤ 0.001 ≤ 0.001
Variables
Number of prenatal visits 1–3 visits
OR (95%CI)
4–6 visits OR (95%CI)
7 or more visits OR (95%CI) Region of residence
Midwest 1.00 1.00 1.00
North 1.37 (1.31 – 1.43) 1.00 (0.96 – 1.04) 0.52 (0.50 – 0.54)
South 1.72 (1.64 – 1.81) 1.75 (1.67 – 1.83) 2.35 (2.25 – 2.46)
Northeast 1.53 (1.47 – 1.59) 1.52 (1.47 – 1.57) 1.03 (1.00 – 1.07)
Southeast 1.38 (1.33 – 1.44) 1.53 (1.48 – 1.59) 2.12 (2.04 – 2.19)
p-value ≤ 0,001 ≤ 0.001 ≤ 0.001
Type of pregnancy
Single 1.00 1.00 1.00
Twin 1.02 (0.95 – 1.10) 1.31 (1.23 – 1.40) 1.93 (1.81 – 2.06)
Triplet or more 1.11 (0.72 – 1.72) 1.27 (0.85 – 1.89) 2.46 (1.66 – 3.64)
p-value 0,392 ≤ 0.001 ≤ 0.001
Gestational age (weeks)
Up to 36 1.00 1.00 1.00
37 – 41 0.65 (0.63 – 0.67) 0.91 (0.88 – 0.94) 1.87 (1.82 – 1.92)
42 or more 0.93 (0.87 – 0.99) 1.25 (1.18 – 1.33) 2.87 (2.70 – 3.04)
p-value ≤ 0,001 0.827 ≤ 0.001
Low birth weight
Yes 1.00 1.00 1.00
No 1.37 (1.33 – 1.41) 1.84 (1.78 – 1.89) 2.92 (2.84 – 3.01)
p-value ≤ 0.001 ≤ 0.001 ≤ 0.001
Table 3. Continuation.
Prevalence of pregnant women who attended 0 to 3 prenatal visits
Up to 3.5 3.5 –| 6.4
11.1 –| 100.0 6.4 –| 11.1
Prevalence of pregnant women who attended 7or more prenatal visits
Up to 52.6 52.6 –| 67.1
78.1 –| 100.0 67.1 –| 78.1
A
B
associated with higher prevalence of seven or more prenatal visits, greater schooling, living with partner, residing in the Southeast and South, having at least three pregnan-cies, having gestational age of 42 weeks or more, and having children with normal birth weight stood out.
Older women (aged 40 years or older) were more likely to attend seven or more prenatal visits. However, the data available in the literature are controversial. Whereas research indicates greater adherence to prenatal care among women aged 40 years or more, owing to the higher prevalence of maternal and fetal complications11,12, especially
preeclampsia, gestational diabetes, miscarriage, chromosomal abnormalities, maternal mortality, intrapartum meconium, low birth weight, fetal growth restriction, and mac-rosomia11,12, other studies suggest that pregnant women in older ages tend to perform
less than seven prenatal visits because they are multiparous, they became pregnant long after the last pregnancy, and they also justify not attending prenatal visits owing to the existence of priority events13.
The level of education was another factor signiicantly associated with the occurrence of seven or more prenatal visits. Joshi et al. 14, in a study carried out in Nepal, found that
the chances of attending four or more prenatal visits grew with better educational level of the pregnant women analyzed, being seven times higher when extreme groups of school-ing were compared to each other. Similarly, in Colombia, Osorio et al.15 found that higher
levels of education (higher education) led to greater access and attendance of at least four prenatal visits during pregnancy.
The socioeconomic status of the individuals inluences on their access to the childcare services16. Mothers with higher levels of education better understand the information and
the actions that occur around, and are more capable of pursuing, processing, and applying the knowledge they acquired16,17. The level of education inluences the attitude of women
toward the information they receive, and the most educated have greater autonomy, ask more questions, and are more likely to be heard by the health professionals18.In addition,
women with better education are more worried with the signs of complications in preg-nancy, better understand the need for spacing births, and tend to adopt healthy eating hab-its, in order to avoid risks for them and for the baby17.
The association between living with partner and higher prevalence of seven or more prenatal visits is similar to the indings of other authors19,20.Family, friends, and husband/
partner seem to play an important role during pregnancy, which is a period that demands a lot of emotional stability21,22. The partner is the leading provider of social support in caring
for the mother and baby23, and their presence, support, and protection during pregnancy
provide greater environmental control and autonomy for the pregnant women. In addition, they contribute to the maintenance of mental health, to coping with stressful times21,22, and
consequently to greater adherence to prenatal care19,20.
(up to 36 weeks of gestation) of 23.3% among mothers who did not have access to prena-tal visits, whereas those who attend 7 or more prenaprena-tal visits showed prevalence of only 4% (p < 0.001). Bezerra et al.25, in a research conducted at the University Hospital of the
Universidade de São Paulo (HU/USP), found that to attend up to three prenatal visits was
associated with the occurrence of preterm birth (OR 4.26), compared with seven or more visits. However, it is worth noting that women with premature births probably attended less prenatal consultations, which may overvalue the association of the number of prena-tal visits with gestational age.
Having children with normal birth weight was associated with the attendance at seven or more prenatal visits. Research conducted in Campinas, São Paulo, based on data from 14,444 declarations of live births found that women who had less than seven prenatal visits were more likely to have children with low birth weight, both among women with preterm labor and those with gestational age greater than or equal to 37 weeks26. Similarly, a study
developed in São Paulo found relative risk of 2.0 for low weight among women who had 0–3 prenatal visits and 1.4 for those who attended 4–6 visits, compared to women who attended 7 or more prenatal visits5.
The occurrence of seven or more prenatal visits proved to be signiicantly associated with twin, triplet, or more pregnancies. In multiple pregnancies, perinatal mortality tends to be higher than in single pregnancies and increases with the number of fetuses. Moreover, prematurity, fetal growth retardation, occurrence of fetal malformations, and incidence of disease such as preeclampsia, occur more frequently. With regard to the mother, the development of hypertensive disorders, anemia, and bleeding appear as the most common among various complications27. Therefore, the establishment of an appropriate prenatal
care can prevent and/or minimize the problems arising from multiple pregnancies, leading to increased number of prenatal visits, as observed in this study.
Residing in the South and Southeast regions was statistically associated with the occur-rence of seven or more prenatal visits. According to data from the Brazilian Institute of Geography and Statistics (IBGE), since 2000, after the implementation by the Ministry of Health of the rules that deined six or more visits to the doctor as an adequate prenatal care, the prevalence of attendance at 7 or more prenatal visits has increased from 43.7% in 2000 to 54.5% in 2006 and 61.1% in 201028. The prevalence found in this study (63.1%)
corroborates this evolution; however, the signiicant interregional inequalities that were observed in this study with regard to the attendance of prenatal visits in Brazil should be highlighted. Whereas the South and Southeast regions had 74.7 and 73.0%, respectively, of pregnant women with 7 or more prenatal visits, in the North and Northeast these ratios were 42.3 and 51.2%, respectively.
Studies carried out in diferent countries show the occurrence of inadequate prenatal care in less favored regions29,30. Heaman et al.29, in a research developed in Manitoba, Canada, found
of income quintile in all analyzed regions (East Asia and Paciic, Europe and Central Asia, Latin America and Caribbean, Middle East and North Africa, South Asia and Sub-Saharan Africa). In South Asia, for example, only 27% of the poorest women attended at least one prenatal visit, as opposed to 82% of the richest pregnant women30.
As this is a cross-sectional study, this research presents some limitations, such as the inabil-ity to establish causal and/or temporal relationships. Moreover, the information obtained by means of secondary data always requires caution. Their quality can be hindered by under-reporting, by the lack of standardization and/or errors in data collection, and may vary according to regions and demographic characteristics, which may create or reinforce artii-cial diferences between groups. However, SINASC is a fundamental tool for the understand-ing of the epidemiological proile, for plannunderstand-ing and evaluatunderstand-ing the health action plan for the mother and for the baby — its quality has been greatly improved and now conigures as a reliable information system10.
It is worth noting that this study examined the number of prenatal visits only. Studies that also incorporate in their analysis the quality of the health care provided are essential to supply a broader picture of the prenatal care in the country.
CONCLUSION
The results of this study show that although Brazil has a public health system that pro-vides universal prenatal care, the use of this service is uneven according to the demographic, socioeconomic, and geographical characteristics. Among them, mainly the lower level of education of the pregnant women, not living with a partner, and living in the North and Northeast regions stood out for the lower prevalence of prenatal visits.
Within this context, to promote actions that intend to eliminate these inequities, espe-cially by strengthening the actions of primary health care, should be an ethical commitment of the Uniied Health System (SUS). It is worth mentioning the importance of ensuring the early identiication of the pregnant women to classify the pregnancy as high or low risk according to the SUS protocols, and of facilitating pregnant women’s commute to prena-tal visits as well as ensuring the link between pregnant women and health teams with the proper care of all the needs that arise during pregnancy.
CONTRIBUTORS
1. Brasil. Ministério da Saúde. Secretaria de Políticas de Saúde. Área Técnica da Mulher. Programa de Humanização no Pré-natal e Nascimento. Rev Bras Saúde Mat Infant 2002; 2: 69-71. DOI: http://dx.doi. org/10.1590/S1519-38292002000100011
2. Pereira PMH, Frias PG, Carvalho PI, Vidal SA, Figueiroa JN. Mortalidade neonatal hospitalar na coorte de nascidos vivos em maternidade-escola na Região Nordeste do Brasil, 2001-2003. Epidemiol Serv Saúde 2006; 15(4): 19-28. DOI: http://dx.doi.org/10.5123/ S1679-49742006000400003
3. Bezerra EHM, Alencar Júnior CA, Feitosa RFG, Carvalho AAA. Mortalidade materna por hipertensão: índice e análise de suas características em uma maternidade-escola. Rev Bras Ginecol Obstet 2005; 27(9): 548-53. DOI: http://dx.doi.org/10.1590/ S0100-72032005000900008
4. Chaim SRP, Oliveira SMJV, Kimura AF. Hipertensão arterial na gestação e condições neonatais ao nascimento. Acta Paul Enferm 2008; 21(1): 53-8.
5. Kilsztajn S, Rossbach A, Carmo MSN, Sugahara GTL. Assistência pré-natal, baixo peso e prematuridade no Estado de São Paulo, 2000. Rev Saúde Pública 2003; 37(3): 303-10.
6. Gama SGN, Szwarcwald CL, Sabroza AR, Branco VC, Leal MC. Fatores associados à assistência pré-natal precária em uma amostra de puérperas adolescentes em maternidades do município do Rio de Janeiro, 1999-2000. Cad Saúde Pública 2004; 20(Suppl. 1): S101-11.
7. Gomes RMT, César JA. Perfil epidemiológico de gestantes e qualidade do pré-natal em unidade básica de saúde em Porto Alegre, Rio Grande do Sul, Brasil. Rev Bras Med Fam Comunidade 2013; 8(27): 80-9. DOI: http://dx.doi.org/10.5712/rbmfc8(27)241
8. Melo EC, Oliveira RR, Nonaka RH, Mathias TAF. Fatores relacionados ao parto cesáreo, baixa cobertura de pré-natal e baixo peso ao nascer. REAS [Internet] 2013; 2(1): 47-59.
9. Brasil. Ministério da Saúde. Secretaria de Vigilância em Saúde. Departamento de Análise de Situação de Saúde. Saúde Brasil 2011: uma análise da situação de saúde e a vigilância da saúde da mulher. Brasília: Ministério da Saúde; 2012.
10. Jorge MHPM, Laurenti R, Gotlieb SLD. Análise da qualidade das estatísticas vitais brasileiras: a experiência de implantação do SIM e do SINASC. Ciên Saúde Colet 2007; 12(3): 643-54. DOI: http://dx.doi.org/10.1590/ S1413-81232007000300014
11. Ziadeh SM. Maternal and perinatal outcome in nulliparous women aged 35 and older. Gynecol Obstet Invest 2002; 54(1): 6-10. DOI: 64689
12. Andrade PC, Linhares JJ, Martinelli S, Antonini M, Lippi UG, Baracat FF. Resultados perinatais em grávidas com mais de 35 anos: estudo controlado. Rev Bras Ginecol Obstet 2004; 26(9): 697-701. DOI: http:// dx.doi.org/10.1590/S0100-72032004000900004
13. Cecatti JG, Faúndes A, Surita FGC, Aquino MMA. O impacto da idade materna avançada sobre os resultados da gravidez. Rev Bras Ginecol Obstet 1998; 20(7): 389-94. DOI: http://dx.doi.org/10.1590/ S0100-72031998000700004
14. Joshi C, Torvaldsen S, Hodgson R, Hayen A. Factors associated with the use and quality of antenatal care in Nepal: a population-based study using the demographic and health survey data. BMC Pregnancy and Childbirth 2014; 14: 94. DOI: 10.1186/1471-2393-14-94
15. Osorio AM, Tovar LM, Rathmann K. Individual and local level factors and antenatal care use in Colombia: a multilevel analysis. Cad Saúde Pública 2014; 30(5): 1079-92.
16. Haidar FH, Oliveira UF, Nascimento LFC. Escolaridade materna: correlação com os indicadores obstétricos. Cad Saúde Pública 2001; 17(4): 1025-9. DOI: http:// dx.doi.org/10.1590/S0102-311X2001000400037
17. Shen C, Williamson JB. Maternal mortality, women’s status, and economic dependency in less developed countries: a cross-national analysis. Soc Sci Med1999; 49(2): 197-214.
18. Caldwell JC. Education as a factor in mortality decline: an examination of Nigerian data. Population Studies 1979; 33(3): 395-413. DOI: 10.2307/2173888
19. Raleigh VS, Hussey D, Seccombe I, Hallt K. Ethnic and social inequalities in women’s experience of maternity care in England: results of a national survey. J R Soc Med 2010; 103(5): 188-98. DOI: 10.1258/jrsm.2010.090460
20. Rowe RE, Magee H, Quigley MA, Heron P, Askham J, Brocklehurst P. Social and ethnic differences in attendance for antenatal care in England. Public Health 2008; 122(12): 1363-72. DOI: 10.1016/j.puhe.2008.05.011
21. Coutinho DS, Baptista MN, Morais PR. Depressão pós-parto: prevalência e correlação com o suporte social. Infanto Rev Neuropsiquiatr Infanc e Adolesc 2002; 10(2): 63-71.
22. Dessen MA, Braz MP. Rede social de apoio durante transições familiares decorrentes do nascimento de ilhos. Psic Teor e Pesq 2000; 16(3): 221-31. DOI: http:// dx.doi.org/10.1590/S0102-37722000000300005
23. Halim N, Bohara AK, Ruan X. Healthy mothers, healthy children: does maternal demand for antenatal care matter for child health in Nepal? Health Policy Plan 2011; 26(3): 242-56. DOI: 10.1093/heapol/czq040
24. Aragão VM, da Silva AA, de Aragão LF, Barbieri MA, Bettiol H, Coimbra LC, et al. Risk factors for preterm births in São Luís, Maranhão, Brazil. Cad Saúde Pública 2004; 20(1): 57-63. DOI: http://dx.doi.org/10.1590/ S0102-311X2004000100019
25. Bezerra LC, Oliveira SMJV, Latorre MRDO. Prevalência e fatores associados à prematuridade entre gestantes submetidas à inibição de trabalho de parto prematuro. Rev Bras Saúde Mater Infant 2006; 6(2): 223-9. DOI: http://dx.doi.org/10.1590/S1519-38292006000200010
26. Carniel EF, Zanolli ML, Antônio MARGM, Morcillo AM. Determinantes do baixo peso ao nascer a partir das Declarações de Nascidos Vivos. Rev Bras Epidemiol 2008; 11(1): 169-79. DOI: http://dx.doi.org/10.1590/ S1415-790X2008000100016
27. Gérardin P, Boumahni B, Choker G, Carbonnier M, Gabrièle M, Heisert M, et al. Twin pregnancies in Southern Reunion Island: a three-year cross-sectional
study of risk factors and complications. J Gynecol Obstet Biol Reprod (Paris) 2006; 35(8 Pt 1): 804-12.
28. Brasil. Ministério do Planejamento, Orçamento e Gestão. Instituto Brasileiro de Geograia e Estatística – IBGE. Diretoria de Pesquisas. Coordenação de População e Indicadores Sociais. Estudos e Pesquisas: informação demográica e socioeconômica número 32. Síntese de Indicadores Sociais: uma análise das condições de vida da população brasileira 2013. Rio de Janeiro: IBGE; 2013.
29. Heaman MI, Green CG, Newburn-Cook CV, Elliott LJ, Helewa ME. Social inequalities in use of prenatal care in Manitoba. J Obstet Gynaecol Can 2007; 29(10): 806-16.
30. Paruzzolo S, Mehra R, Kes A, Ashbaugh C. Targeting poverty and gender inequality to improve maternal health. Washington, D.C.: International Center for Research on Women; 2010.
Received on: 10/29/2015