1. Federal Rural University of Rio de Janeiro. Institute of Education. Department of Physical Education and Sports. Research Group in Kinanthropometry, Human Per-formance and Strength Training. Seropédica, RJ, Brazil.
2. Federal University of Santa Catarina, Florianópolis. Center of Sports. Department of Physical Education. Group for Research in Kinanthropometry and Human Performance. Florianópolis, SC, Brazil.
3. Oswaldo Cruz Foundation. National School of Public Health Sergio Arouca. Rio de Janeiro, RJ, Brazil.
Received: 18 April 2013 Accepted: 16 September 2013
Prevalence and factors associated with
overweight in adults - Brazil, 2008-2009
Prevalência e fatores associados ao excesso de peso em
adultos - Brasil, 2008-2009
Vladimir Schuindt da Silva1
Israel Souza1
Diego Augusto Santos Silva2
Maria de Jesus Mendes da Fonseca3
Abstract– he worldwide overweight prevalence showed a rapid increase in recent
decades, featuring a true global epidemic. he aim of this study was to determine the overweight prevalence (BMI ≥ 25kg/m2) and possible associations with socioeconomic
and demographic indicators for adults in Brazil. his epidemiological study analyzed data from the population of adults aged 20-59 years (n = 101 308 637) included in the 2008-2009 Brazilian Family Budget Survey (POF) conducted in all geographic regions of Brazil. he nutritional status assessment used the Body Mass Index, which was categorized as normal weight and overweight according to cutof points recommended by the World Health Organization. As socioeconomic and demographic indicators, sex, age, color-race, education, income, and geographic region were analyzed. Crude and adjusted Poisson regression was performed. he results showed that the overweight prevalence was 47.7%, and the groups with the highest prevalence were adults aged 20-59 years, males, black skin color, schooling from 6 to 9 years , income of 1/4 ≥ minimum wage <1/2 and living in Southern Brazil. Almost half of adults in Brazil are overweight. Strategic actions aimed at reducing the overweight prevalence among adults in Brazil are needed to combat the obesity epidemic.
Key words: Cross-sectional studies; Obesity; Overweight.
Resumo– A prevalência mundial de excesso de peso apresentou um rápido aumento nas últimas décadas, caracterizando uma verdadeira epidemia mundial. O presente estudo teve como objetivo veriicar a prevalência de excesso de peso (IMC ≥ 25kg/m2) e as possíveis
Overweight prevalence in adults in Brazil Silva et al.
INTRODUCTION
he World Health Organization1 has estimated that in 2008, 1.4 billion
people worldwide were overweight (Body Mass Index - BMI ≥ 25 kg/m²), and the estimate for 2015 is an increase of 900 million people. In addition, a survey with 88% of the global population estimated that for 2030, 3.3
billion people around the world will be overweight2.
In Brazil, estimates also indicate an increase in overweight prevalence among adults. From 1975 to 2003, for example, the overweight prevalence
increased from 25% to 40%, approximately3,4. Brazilian recent surveys have
shown an increase in these values. he Surveillance of Risk and Protective Factors for Chronic Diseases by Telephone Interviews, 2011, showed that overweight ranged from 39.8% to 55.4% in the entire adult population of
the 26 state capitals and Federal District5.
here are several health complications from overweight such as hy-pertension, cardiovascular diseases, type-2diabetes mellitus, some types of cancer, psychological and orthopedic problems, social problems and early
mortality6. Besides these health complications, excess weight causes high
costs to health systems. In the United States of America (USA), overweight-associated cardiovascular diseases generated a direct cost of US$ 147 billion
in 20097. In the United Kingdom (UK), over £$ 3 billion were spent by
the public health system with overweight8. In South Korea, the total costs
represented 3.7% of national health expenditures in 20059.
In Brazil, 8% of the Gross Domestic Product (GDP) is annually spent
with health10. Expenditures with all diseases related to overweight,
includ-ing hospitalizations, medical visits and medications are around US$ 2.1 billion per year, and this amount does not include indirect costs of treat-ment such as transportation, caregivers, work absenteeism, early retiretreat-ment
and death11.
In this regard, initiatives to combat and prevent overweight are urgent worldwide. herefore, population surveys are the irst step to help identi-fying overweight prevalence and encourage future intervention/guidance policies in the population. Furthermore, the identiication of demographic and socioeconomic factors associated with this outcome can identify sub-populations more vulnerable to having excess weight. About demographic and socioeconomic aspects, systematic reviews have shown that depending
on the location investigated, overweight-related factors can be diferent12,13.
Given the above, the present study aimed to estimate the overweight prevalence and evaluate possible associations between this outcome and demographic and socioeconomic indicators in adults throughout Brazil.
METHODOLOGICAL PROCEDURES
(which helped in the evaluation and implementation of health policies in the 2008-2009 POF, in particular the nutritional status assessment) and the World Bank (within the Human Development Technical Assistance Loan - HDTAL project). he POF complied with all ethical standards es-tablished by the research ethics with humans in Brazil and was approved
by the National Health Council14.
Based on the 2008-2009 POF, a two-stage cluster sampling plan was adopted with geographic and statistical stratiication of the primary sam-pling units, which corresponded to the census tracts of the 2000 Census geographic base, from the structure ofered by the master sample designed by IBGE for the Integrated Household Surveys under construction. he
secondary sampling units were the permanent domiciles14.
he allocation of the total census tracts selected in each stratum was proportional to the total number of domiciles. In the 2008-2009 POF, the efective sample size was 4696 sectors, corresponding to an expected number of 59.548 domiciles. he number of domiciles with interview per census tract was established according to the survey area: 12 domiciles in
urban areas, 16 in rural areas14.
In this study, the population of adults aged 20 to 59 years (except preg-nant and lactating women) was selected, totaling 101.308.637 individuals of both sexes in the ive Brazilian regions. Pregnant and lactating women were excluded from the study because such situations afect their body mass.
he collection and recording of information were directly made in the domiciles selected, along with their residents by assisted interview, with recurrence to the informant’s memory during a period of nine consecu-tive days, by survey agents hired and trained by IBGE through the use of laptops in approximately 70% of the domiciles surveyed. In the remainder, the collection and recording of information were performed with the use
of printed questionnaires14.
Anthropometric measurements of body mass and height were col-lected by IBGE’s survey agents, which were trained to standardize the data collection and followed recommendations contained in the Survey Agent
Manual14. Body mass was measured using a portable electronic scale with
resolution of 100 grams and maximum capacity of 150 kilograms. Height
was measured using a KaWe® portable stadiometer for adults, with internal
retractable tape measure with accuracy of 0.1 centimeters and length of
300 centimeters14. To measure body weight and height, the subjects should
is barefoot and wearing light clothing in order not to bias the mass body14.
From the collection of body mass and height of individuals, BMI was calculated by dividing body mass in kilograms by the squared height in
meters. Initially, BMI was classiied as underweight (BMI < 18.50kg/m2),
normal weight (18.50 ≥ BMI ≤ 24.99kg/m2), overweight (25.00 ≥ BMI ≤
Overweight prevalence in adults in Brazil Silva et al.
To facilitate interpretation of data and achieve the research objectives, underweight and normal weight categories were grouped into a single
category called Eutrophic (BMI ≤ 24.99kg/m2). Overweight and obesity
were grouped and called Overweight (BMI ≥ 25.00kg/m²).
he socioeconomic and demographic data used in this study were extracted from the 2008-2009 POF questionnaires: POF 1 - Questionnaire of Domicile and Residents Characteristics (used to investigate the domicile characteristics, relate its residents, and to investigate the characteristics of residents) and POF 5 - Questionnaire of Work and Individual Income (used to record work features; income and deductions with transfers; in-comes and deductions on rent, use or exploitation of property and rents, royalties, patents, other income and deductions, and inancial applications and withdrawals). hus, independent variables such as age (20 to 59), sex (male and female); self-reported color (white, black, and brown),
school-ing (low: ≤ 5; intermediate: 6-9, high: ≥ 10), per capita income based on
minimum wage (MW) at that time (R$ 415) (≤ 1/4(1) MW; 1/4 ≥ MW < 1/2; 1/2 ≥ MW < 1; 1 ≥ MW < 2; 2 ≥ MW < 5; ≥ 5 MW); domicile region (Northern, Northeastern, Southeastern, Southern, and Midwestern) were deined. Variable age was continuously used in this study, because it was decided to investigate the year-by-year trend of increasing or decreasing the overweight prevalence. he other skin color categories investigated by IBGE (yellow and Indian) were removed from the tables due to the low percentage of the adult population of Brazil included in these categories; however, they were maintained in association analyses.
Descriptive and inferential statistics was applied. Poisson regression
analysis was used by means of robust estimation15 with log link function
to assess the association between independent variables and the outcome (overweight: BMI ≥ 25.00kg/m²), in which gross and adjusted prevalence ratio and conidence interval of 95% were estimated. All independent variables showing association with the outcome with p<0.10 in the crude analysis were considered for the multivariate analysis.
Data were processed and analyzed using the Statistical Package for the
Social Sciences® 18.0 for Windows (SPSS Inc., Chicago, USA).
RESULTS
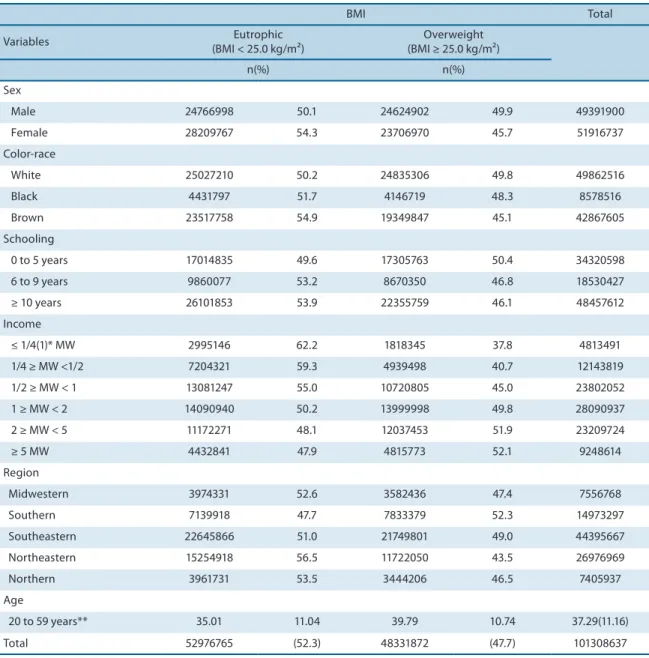
In the total sample, there was a 2.6% prevalence of underweight, 49.7% normal weight, 33.6% overweight and 14.1% obesity, which demonstrates overweight prevalence (BMI ≥ 25.00kg/m²) of 47.7% (Table 1).
adults had probability of about 3% and 5%, respectively, of excess weight greater than brown adults; individuals with low schooling level had 3% to 6% higher prevalence of being overweight (BMI ≥ 25.00kg/m²) than those with higher schooling; low-income adults showed approximately 20% higher likelihood of being overweight (BMI ≥ 25.00kg/m²) than higher-income adults, and Brazilians living in the southern region of the country had higher overweight (BMI ≥ 25.00kg/m²) prevalence than those living in Northern Brazil.
Table 1. Sample distribution in relation to socioeconomic and demographic characteristics according to Body Mass Index (BMI). Brazil, 2008-2009 (n = 101.308.637).
BMI Total
Variables (BMI < 25.0 kg/m²)Eutrophic (BMI ≥ 25.0 kg/m²)Overweight
n(%) n(%)
Sex
Male 24766998 50.1 24624902 49.9 49391900
Female 28209767 54.3 23706970 45.7 51916737
Color-race
White 25027210 50.2 24835306 49.8 49862516
Black 4431797 51.7 4146719 48.3 8578516
Brown 23517758 54.9 19349847 45.1 42867605
Schooling
0 to 5 years 17014835 49.6 17305763 50.4 34320598
6 to 9 years 9860077 53.2 8670350 46.8 18530427
≥ 10 years 26101853 53.9 22355759 46.1 48457612
Income
≤ 1/4(1)* MW 2995146 62.2 1818345 37.8 4813491
1/4 ≥ MW <1/2 7204321 59.3 4939498 40.7 12143819
1/2 ≥ MW < 1 13081247 55.0 10720805 45.0 23802052
1 ≥ MW < 2 14090940 50.2 13999998 49.8 28090937
2 ≥ MW < 5 11172271 48.1 12037453 51.9 23209724
≥ 5 MW 4432841 47.9 4815773 52.1 9248614
Region
Midwestern 3974331 52.6 3582436 47.4 7556768
Southern 7139918 47.7 7833379 52.3 14973297
Southeastern 22645866 51.0 21749801 49.0 44395667
Northeastern 15254918 56.5 11722050 43.5 26976969
Northern 3961731 53.5 3444206 46.5 7405937
Age
20 to 59 years** 35.01 11.04 39.79 10.74 37.29(11.16)
Total 52976765 (52.3) 48331872 (47.7) 101308637
Overweight prevalence in adults in Brazil Silva et al.
DISCUSSION
he main inding of this study was that overweight (BMI ≥ 25.00kg/m²) afected 47.7% (33.6% overweight and 14.1% obese) of the Brazilian adult population and was more prevalent with advancing age, being male, in black-white adults and with low schooling and low income, and residents in southern Brazil. his study is characterized by using data from the latest Brazilian survey with representative sample of adults from all geographic regions of the country. his allowed us identifying the Brazilian popula-tion in terms of excess weight and which populapopula-tion subgroups have been most afected by this outcome.
his study showed a trend of increasing overweight prevalence with increasing age, indicating that each year lived represented a probability around 2% for the individual to become overweight (BMI ≥ 25.00kg/m²). his phenomenon has been observed both when overweight is measured
by BMI16, as when measured by anthropometric indicators17,18. Possible
Table 2. Unadjusted and adjusted prevalence ratio (PR) for overweight (BMI ≥ 25 kg/m²) according to socioeconomic and demographic characteristics. Brazil, 2008-2009.
Variables
Unadjusted PR
(CI95%) p
Adjusted PR*
(CI95%) p
Age 1.020 (1.020-1.020) < 0.001 1.019 (1.019-1.019) < 0.001
Sex
Male 1.092 (1.091-1.092) < 0.001 1.104 (1.103-1.104) < 0.001
Female 1 1
Color-race
White 1.103 (1.103-1.104) < 0.001 1.033 (1.033-1.034) < 0.001
Black 1.071 (1.070-1.072) < 0.001 1.055 (1.054-1.055) < 0.001
Brown 1 1
Schooling
0 to 5 years 1.093 (1.092-1.093) < 0.001 1.030 (1.030-1.031) < 0.001 6 to 9 years 1.014 (1.014-1.015) < 0.001 1.067 (1.067-1.068) < 0.001
≥ 10 years 1 1
Income
≤ 1/4(1)** MW 1.378 (1.377-1.380) < 0.001 1.241 (1.239-1.243) < 0.001 1/4 ≥ MW <1/2 1.373 (1.371-1.375) < 0.001 1.265 (1.264-1.267) < 0.001 1/2 ≥ MW < 1 1.319 (1.318-1.321) < 0.001 1.230 (1.228-1.231) < 0.001 1 ≥ MW < 2 1.192 (1.191-1.194) < 0.001 1.142 (1.141-1.143) < 0.001 2 ≥ MW < 5 1.077 (1.075-1.078) < 0.001 1.057 (1.055-1.058) < 0.001
≥ 5 MW 1 1
Region
Midwestern 1.019 (1.018-1.020) < 0.001 0.963 (0.961-0.964) < 0.001
Southern 1.125 (1.124-1.126) < 0.001 1.013 (1.012-1.014) < 0.001
Southeastern 1.053 (1.053-1.054) < 0.001 0.959 (0.958-1.960) < 0.001
Northeastern 0.934 (0.934-0.935) < 0.001 0.934 (0.933-0.934) < 0.001
Northern 1 1
such as reduced metabolism and hormonal changes that may contribute
to increased adiposity levels19. However, aging itself does not justify the
increase in overweight. Other factors that were not investigated in this study, such as inadequate lifestyle (sedentary lifestyle, poor eating habits, stress) may increase the magnitude with which increasing age is associated
with overweight / obesity20.
Males were more likely to become overweight than females. Similar
results were observed in other studies4,5,16. he literature emphasizes that
males are more vulnerable to modiiable health risk factors compared to
females, such as alcohol use, smoking and poor eating habits20. his is
alarming when considering the lower use of health services by males, es-pecially for health prevention, and the increased morbidity and mortality
rates caused by cardiovascular diseases when compared with females21.
Black and white Brazilian adults had a higher overweight prevalence than brown adults. Brazil is an interbred country, which features various ethnic racial characteristics. Color-race can be considered a feature that relects the socioeconomic conditions in low- and middle-income
coun-tries22. Given that black subject (poorest part of the Brazilian population)
had higher odds of being overweight, it could be inferred that such indi-viduals are impacted from health inequities and require macro-structural
modiications to change this overweight scenario23. For white skin color
individuals, one possible explanation for the high overweight prevalence compared to those of brown skin color may be the socioeconomic status, since in Brazil, white skin color individuals compose the population with
more inancial resources in diferent geographical regions23.
Inverse association between schooling and excess weight was observed ater adjustment for other demographic and socioeconomic variables. his characteristic was shown in systematic reviews of studies on obesity and
socioeconomic status in adults12,13. Schooling is considered a proxy of
peo-ple’s socioeconomic status and is constantly reported in studies on health
inequities20,23. Socioeconomic conditions are considered distal causes of
diseases; therefore, the socioeconomic status is an important determinant
of the health status of populations13.
As occurred for education, low-income individuals had higher over-weight prevalence compared to those of higher income. Previous studies
also showed this condition12,13. One of these studies analyzed data related
to adults from diferent continents around the world and reported that low-income people and those with low socioeconomic status have worse access to health services for the diagnosis and treatment of chronic dis-eases such as obesity, when compared to individuals of higher income and
higher socioeconomic status24. In Brazil, low-income individuals oten face
Overweight prevalence in adults in Brazil Silva et al.
still be afected by the lack of access to media, being unaware of the services
that may be disclosed in the media25. hus, campaigns of prevention and
treatment of obesity and greater social justice in terms of access to educa-tion, employment and health services can help low-income people to ight and prevent obesity.
Adults living in southeastern Brazil were more likely to be overweight than those living in northern Brazil. One of the possible explanations for this inding may be the cultural characteristics of each region. Brazil’s gov-ernment considers the Southern regions of Brazil as the most developed in the country, while the northern region is the less socially and economically
developed26. Economic development has been associated with some features
considered obesogenic, such as sedentary activities (i.e. watching TV, using the computer, playing video games etc..), eating habits (high consumption
of processed foods), insuicient practice of activity physical and stress27.
One limitation of this study was the use of secondary data, which are susceptible to information record problems. However, the team of data collection and recording of information was trained by specialized technicians to decrease chances of such errors. Furthermore, the cross-sectional design of the study does not allow establishing a cause and efect relationship between independent and dependent variables. Longitudinal studies are relevant because they estimate useful measures for assessing the signiicance of the disease in the community and are valuable for the
planning of health services28.
CONCLUSION
It was concluded that overweight (BMI ≥ 25.00kg/m²) afects almost half of the adult Brazilian population, being more pronounced with increasing age, black and white individuals, those with low education level and low income and those living in southern Brazil. Such indings are worrisome because the overweight prevalence (BMI ≥ 25.00kg/m²) is increasing compared to previous surveys. hus, changes in the macro-structure of the Brazilian society, for example, better income distribution, educational opportunity to the entire population and access to health information for all social classes can reduce the overweight prevalence and the impact of this disease on the Brazilian health system.
Acknowledgments
To the Coordination of Improvement of Higher Level Personnel (CAPES) for the doctoral scholarship granted to Vladimir Schuindt da Silva.
REFERENCES
1. World Health Organization. Obesity and overweight. Fact sheet Nº. 311. Geneve; WHO; 2013.
4. Silva VS, Petroski EL, Souza I, Silva DAS. Prevalência e fatores associados ao excesso de peso em adultos do Brasil: um estudo de base populacional em todo território nacional. Rev Bras Ciênc Esporte, 2012;34(3):713-26.
5. Ministério da Saúde. Vigitel Brasil 2011: vigilância de fatores de risco e proteção para doenças crônicas por inquérito telefônico: estimativas sobre frequência e distribuição sociodemográica de fatores de risco e proteção para doenças crôni-cas nas capitais dos 26 Estados brasileiros e no Distrito Federal em 2011. Brasília: Ministério da Saúde; 2012.
6. World Health Organization. Obesity: preventing and managing the global epi-demic. Report of a WHO Consultation on Obesity. Technical Report Series Nº. 894. Geneve: WHO; 1998.
7. Finkelstein EA, Trogdon JG, Cohen JW, Dietz W. Annual medical spending attribut-able to obesity: payer-and service-speciic estimates. Health Af, 2009;28(5):822-31. 8. Allender S, Rayner M. he burden of overweight and obesity-related ill health in
the UK. Obes Rev 2007;8(5):467-73.
9. Kang JH, Jeong BG, Cho YG, Song HR, Kim KA. Socioeconomic costs of overweight and obesity in Korean adults. J Korean Med Sci, 2011;26(12):1533-40.
10. Paim J, Travassos C, Almeida C, Bahia L, Macinko J. he Brazilian health system: history, advances, and challenges. Lancet, 2011;377(9779):1778-97.
11. Bahia L, Coutinho ESF, Barufaldi LA, Abreu GA, Malhão TA, Souza CPR, et al. he costs of overweight and obesity-related diseases in the Brazilian public health system: cross-sectional study. BMC Public Health (Online) 2012;12(440). 12. González D, Nazmi A, Victora CG. Childhood poverty and abdominal obesity in
adulthood: a systematic review. Cad Saúde Pública, 2009;25(Supl. 3):427-40. 13. Monteiro CA, Moura EC, Conde WL, Popkin BM. Socioeconomic status and
obesity in adult populations of developing countries: a review. Bull World Health Organ, 2004;82(12):940-6.
14. Instituto Brasileiro de Geograia e Estatística. Pesquisa de Orçamentos Familiares (POF) 2008-2009: Antropometria e estado nutricional de crianças, adolescentes e adultos no Brasil. Rio de Janeiro: Instituto Brasileiro de Geograia e Estatística; 2010. 15. Kahn HA., Sempos CT. Statistical methods in epidemiology. New York: Oxford
University Press; 1989.
16. Gigante DP, Moura EC, Sardinha LMV. Prevalência de excesso de peso e obesidade e fatores associados, Brasil, 2006. Rev Saúde Pública, 2009;43(Supl. 2):83-9. 17. Castanheira M, Olinto MTA, Gigante DP. Associação de variáveis
sócio-demográ-icas e comportamentais com a gordura abdominal em adultos: estudo de base populacional no Sul do Brasil. Cad Saúde Pública 2003;19(Supl. 1):55-65.
18. Olinto MTA, Nácul LC, Dias-da-Costa JS, Gigante DP, Menezes AMB, Macedo S. Níveis de intervenção para obesidade abdominal: prevalência e fatores associados. Cad Saúde Pública, 2006;22(6):1207-15.
19. World Health Organization. he world health report 2002 - Reducing risks, pro-moting healthy life. Geneve; WHO; 2002.
20. Silva DA, Peres KG, Boing AF, González-Chica DA, Peres MA. Clustering of risk behaviors for chronic noncommunicable diseases: a population-based study in southern Brazil. Prev Med, 2013;56(1):20-4.
21. Ministério da Saúde. Política nacional de atenção integral a saúde do homem: princípios e diretrizes. Brasília: Ministério da Saúde; 2009.
22. Kurian AK, Cardarelli KM. Racial and ethnic diferences in cardiovascular disease risk factors: a systematic review. Ethn & Dis, 2007;17(1):143-52.
Overweight prevalence in adults in Brazil Silva et al.
Corresponding author
Vladimir Schuindt da Silva Grupo de Pesquisa em Cineantropometria, Performance Humana e Treinamento de Força Departamento de Educação Física e Desportos.
Universidade Federal Rural do Rio de Janeiro
BR-465, Km 7, s/nº – Campus Universitário – Ecologia Cep 23890-000 – Seropédica, RJ, Brasil.
E-mail: [email protected]
24. Di Cesare M, Khang YH, Asaria P, Blakely T, Cowan MJ, Farzadfar F, et al. Inequalities in non-communicable diseases and effective responses. Lancet, 2013;381(9866):585-97.
25. Ministério da Saúde. Diretrizes e recomendações para o cuidado integral de doenças crônicas não-transmissíveis: promoção da saúde, vigilância, prevenção e assistência. Brasília: Ministério da Saúde; 2008.
26. Ministério do Desenvolvimento Social. Índice de desenvolvimento da família. Brasília: Ministério do Desenvolvimento Social; 2009.
27. Wells JC, Marphatia AA, Cole TJ, McCoy D. (2012). Associations of economic and gender inequality with global obesity prevalence: understanding the female excess. Soc Sci Med, 2012;75(3):482-90.