See discussions, stats, and author profiles for this publication at:
https://www.researchgate.net/publication/278688853
A Life Cycle Assessment (LCA) study of iron ore
mining
Article
in
Journal of Cleaner Production · June 2015
DOI: 10.1016/j.jclepro.2015.05.140READS
246
2 authors:
Hélio Ferreira
1
PUBLICATION0
CITATIONSSEE PROFILE
Mariangela Garcia Praça Leite
Universidade Federal de Ouro Preto
29
PUBLICATIONS38
CITATIONSSEE PROFILE
All in-text references underlined in blue are linked to publications on ResearchGate, letting you access and read them immediately.
A Life Cycle Assessment study of iron ore mining
H
elio Ferreira
a,*, Mariangela Garcia Praça Leite
a,baPostgraduate Program in Environmental and Socioeconomical Sustainability, Federal University of Ouro Preto, University Campus- Escola de Minas,
Hydraulics Laboratory, Brazil
bGeology Department, Federal University of Ouro Preto, University Campus, Brazil
a r t i c l e
i n f o
Article history: Received 13 May 2014 Received in revised form 19 May 2015
Accepted 27 May 2015 Available online 17 June 2015
Keywords: Environment
Environmental management Life Cycle Assessment Mining
Iron ore
a b s t r a c t
This paper assessed the cradle-to-gate life cycle of an iron ore mining. The study was based on pro-duction data from an open pit mine located in the Iron Quadrangle/Brazil. The functional unit was defined as“one tonne of iron ore concentrate produced”and the data used were collected directly from the company's production reports covering the time of one year. The evaluation included the classifi-cation and characterization of life cycle impacts, not including normalization and weighting as well as sensitivity analysis of results. The evaluation of impacts used SimaPro-7, Ecoinvent 2.0, Eco indicator'99 and IPCC 2007. The results indicated that the use of grinding media in the processes is the main source of environmental impacts in the iron ore production chain, highlighting its contribution to life cycle im-pacts on human health and quality of ecosystems. Ore transportation by conveyor belts powered by electricity was more efficient in relation to the generation of impacts on the abiotic resources depletion and on climate changes than ore transportation by diesel trucks because the electricity generation matrix in Brazil has significant participation from hydroelectric plants.
©2015 Elsevier Ltd. All rights reserved.
1. Introduction
Iron is the fourth most abundant element and accounts for about 5% of the earth's crust. Commonly found in the form of iron ore, iron has been used for over four thousand years in the making of weapons and tools. Essential part in the manufacture of steel, it is difficult to imagine modern society without iron ore. The estimated world reserve of this mineral good is about 170,000 million tonnes of crude iron ore, and Brazil accounts for 18% of this total (USGS, 2013; Statista, 2015a). According toUSGS (2013), the total annual production should be over 607 million tonnes in 2000 to 1670 million tonnes in 2015, which undoubtedly will increase impacts derived from this activity. World's third largest producer, Brazil is responsible for 25% of world exports, which corresponds to eight times the production in the European Union and six times pro-duction in the United States (USGS, 2015; Statista, 2015b).
Iron ore extraction is almost exclusively performed on surface mines through open pit mining operations, which is characterized by high productivity and low security risks compared to under-ground mining systems. However, this mining method has
significant environmental impacts that need to be properly assessed in order to make it a sustainable activity (Ripley et al., 1996). LCAeLife Cycle Assessmenteis currently one of the most promising methods to evaluate and rank environmental aspects and impacts of a product (Durucan et al., 2006; Blengini et al., 2012). Life Cycle Assessment (LCA) is an environmental approach that considers the quantification of natural resource consumption and pollutant emissions of a product, not only in the production phase, but also in the earlier stages of production (manufacturing of inputs and raw materials) and the later stages of use of this product to its disposal as waste (Blengini et al., 2012). This is therefore a comprehensive tool for the quantification and interpretation of environmental impacts of a product or service from cradle to the grave. However, depending on the nature and intended purpose of a LCA study, the system limits in study can be modified, resulting in the evaluation of any other cradle-to-gate or door-to-gate system (Awuah-Offei and Adekpedjou, 2011).
Although the LCA technique has been used to assess environ-mental impacts associated with various production processes of the mining industry since the end of the last century (Hake et al., 1998; Azapagic and Clift, 1999; Guo et al., 2002; Valderrama et al., 2012), its use in the evaluation of mining processes and processing of mineral resources is still very limited (Durucan et al., 2006), which is in part due to the difficulty of quantifying the various inputs and *Corresponding author. Tel.:þ55 31 3222 8413.
E-mail address:[email protected](H. Ferreira).
Contents lists available atScienceDirect
Journal of Cleaner Production
j o u r n a l h o m e p a g e :w w w . e l s e v i e r . c o m / l o c a t e / j c l e p r o
http://dx.doi.org/10.1016/j.jclepro.2015.05.140
outputs involved (Norgate et al., 2007). Moreover, as each ore corresponds to specific geological, exploitation and processing conditions, environmental impacts are different for each mineral good extracted, requiring specific studies for each case (Norgate and Haque, 2010). This is particularly true for operations with iron ore, where existing studies show the mining processes reduced to a step within the steel production system (Li et al., 2002; Norgate et al., 2007; Bieda, 2012).
There are few studies on the application of LCA to specific mining systems (Awuah-Offei and Adekpedjou, 2011; Blengini et al., 2012.). Among these, those related to coal production in the USA (Ditsele, 2010; Ditsele and Awuah-Offei, 2012) and South Af-rica (Mangena and Brent, 2006); bauxite in the USA (Durucan et al., 2006) and in Australia (Norgate and Haque, 2010); Copper in 11 countries in South and North America, Asia and Oceania (Northey et al., 2013.); red clay in Spain (Bovea et al., 2007); and gold in Australia, North America, Africa and Asia (Mudd, 2007) stand out. So far, only the study byNorgate and Haque (2010)presented results of the application of Life Cycle Assessment in an iron mine; however, focusing its analysis on impacts related to water and energy consumption and emissions related to global warming. Seeking tofill this gap, this study evaluated the effect of mining activities and cradle-to-gate iron ore processing in a mine in Brazil. To this end, water use, land use, energy consumption and use of key inputs were evaluated. The following categories of impacts were also quantified: damage to human health; loss of ecosystem qual-ity; abiotic resources depletion and climate changes.
2. Iron ore surface mining product system
2.1. Case study
This paper presents a survey of environmental aspects and im-pacts related to the iron ore life cycle based on primary data of the process used by Samarco Mineraçao in its plant in Germano, Iron~
Quadrangle/Brazil.
The Samarco operations, typical of a complex for iron ore exploitation in surface mines, involve mining, processing and pelletizing activities. Iron ore is extracted from Alegria mines, with average grade of 43%. The final product, iron ore concentrate, exclusively dedicated for export (34 customers in 25 countries) is delivered through its own sea terminal in the city of Anchieta-ES-Brazil. The concentrate is transported to the port through two iron ore pipelines 400 km long.
The production of Samarco in 2012 was 23 million tonnes/year of pellets, a little over 6% of Brazil's total production that year.
2.2. Product system
The iron ore production system target of this study is composed of three units: Mining, Processing and Support System. The mining activity can be described by operations of dismantling, loading and transportation of ore and waste. Dismantling is done mainly by tractors or dozers and to a lesser extent with the use of explosives. Loaders load trucks with waste and shippers feed conveyor belts with ore. Waste is transported tofinal repositories exclusively by off-road diesel trucks, but ore is transported to the processing fa-cilities mostly by electric conveyor belts. Mining activities use tractors, excavators, loaders, diesel trucks and stationary equip-ment such as shippers and electric conveyor belts. The environ-mental aspects of this processing unit are characterized by diesel and electricity consumption, land occupation and transformation, generation of waste rocks that are arranged in waste dumps and generation of particulate matter and combustion gases emitted into the air.
In Processing, ore is crushed and classified into particle size sieves and then feed the Concentration Plant. In the Concentration Plant, ore undergoes a milling step to release silica and then is conducted toflotation cells where silica is removed to form two products: tailings (primarily SiO2) and concentrate (mainly Fe2O3).
The tailings are conducted to dams forfinal disposal and water recovery, while concentrate is led to a secondary grinding for adjustment of the final particle size. Processing activities use crushers, screens, mills and water pumps, all electric driven. Grinding processes use ball grinders composed of metallic alloys. In the concentration step, the main chemicals used are: amine, starch and caustic soda. The environmental aspects of this process step are related to the consumption of reagents and inputs, as well as to the generation of industrial effluents through emissions to tailings dams.
The Support System describes the impacts of personnel and generation transportation activities, in addition to transportation and disposal of industrial waste. In personnel transportation ac-tivities, buses and trucks are used and the transportation of in-dustrial waste is done by trucks, all diesel driven. The executive transportation of people in travels is done by gasoline cars. Envi-ronmental aspects are linked to fuel consumption and emissions of exhaust gases.
The scope of this study considered all impacts generated from the steps of ore mining (cradle) to thefinal delivery of concentrated ore (gate). Cradle activities also comprise previous activities such as extraction, production and transportation of raw materials, sup-plies and equipment to the company, as well as the generation of electricity and its transmission to the mining site. To this end,“one tonne of iron ore concentrate at the gate” was considered as a functional unit.
Fig. 1shows the initial product system for extraction and pro-cessing of iron ore in surface mining using the cradle-to-gate approach.
3. Life cycle inventory analysis
For the mining activity, data on production and consumption of the following inputs were collected: diesel in mining equipment, electricity on conveyor belts, explosives and land use and occupa-tion with mining, waste dumps and industrial facilities. For the definition of impacts related to the recovery of areas, the expected degraded area up to total ore extraction during the company's life cycle was calculated.
For Processing, in addition to the total concentrate production and the total amount of ore fed, the following consumptions were also assessed: water, electricity, chemicals (amines, starches, caustic soda, etc.) and grinding media. Wastewaters from pro-cessing that are directed to tailings dams were also quantified.
The survey of impacts of the Support System covered the kilo-meters traveled both for transportation of personnel and for collection and disposal of all waste generated in the process. All vehicles used are powered by diesel or gasoline. Regarding waste, all information related to the generation of metallic and non-metallic industrial waste, organic waste used for composting and industrial waste contaminated with oil and grease for incineration, as well as data on the internal transport of waste through diesel trucks was surveyed.
Fig. 2shows thefinal product system used for determining LCI. From primary data on inputs, outputs and emissions, life cycle inventory was elaborated for the three Processes units: Mining, Processing and Support Systems (Table 1).
are generated by previous activities) were estimated by the Ecoinvent 2.0 database, which although based on industries in Europe (Frischknecht and Rebitzer, 2005) was used as an approxi-mation due to the lack of an equivalent database for the industry in Brazil. To calculate the impact of the Life Cycle InventoryeLCI, the Eco-indicator'99 was used (Goedkoop and Spriensma, 2001), which presents its results into three categories of impacts, namely: damage to human health, damage to ecosystem quality and natural resources depletion. The impacts on climate changes were calcu-lated using the IPCC-2007 method.Fig. 3shows how methodolo-gies used to assess life cycle impacts relate to Life Cycle Inventory spreadsheet.
4. Life Cycle Impact Assessment
Table 2shows the results of the life cycle impacts evaluation (LCIA). The presentation of results was performed by the levels of impact categories, showing the units of processes where increased environmental impacts were observed and in which activities the
most significant impacts can be found. The two major impacts of each category will be presented below. In addition, the results achieved for emissions related to global warming will also be presented.
4.1. Impacts on human health
4.1.1. Emission of inhalable inorganic compounds
This impact showed total value of 5.610 5DALY/tonnes of concentrate produced.Fig. 4shows the impact potential in terms of percentage of the main inhalable inorganic compounds in this study.Table 3shows the participation (% of total impact) of the main company's activities in relation to the emission of inhalable inorganic substances.
The emission offine inhalable particles (PM-10 and PM-2.5) is the main aspect responsible for this impact, with 81% of the total. The results show that only the ore mining activity is involved in 56% of the total impact. The results also show that grinding machines are important contributors to the emission of inhalable inorganic
Fig. 1.Initial product system.
substances, with about 10% of this impact, highlighting the emis-sion of particulate material during the production of this raw ma-terial (steel metallurgy). Dispersed in all systems, an 11% participation of nitrogen oxides is observed, which are derived from fuel combustion by mobile devices, for example, in mining activities, recovery of areas and support systems (adding 7.34% of the impact). Another source of emission of inhalable inorganic substances is the burning of natural gas in the production of grinding media (10.63%) and biomass in electricity generation (2.9%) used in the production of various inputs and operation of machines and lighting in the mining and processing activities.
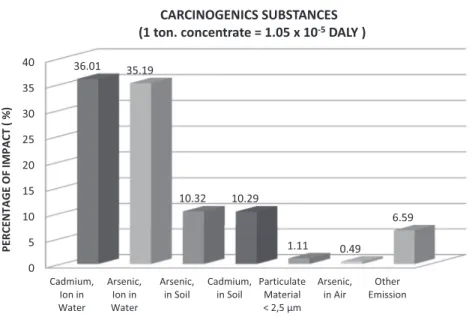
4.1.2. Emission of carcinogenic substances
The impact of emissions of carcinogenic substances obtained the value of 1.0510 5DALY per tonne of concentrate produced.Fig. 5 shows the participation of each of these carcinogenic substances in terms of percentage of the total impact.Table 4shows the partic-ipation of the company's activities in relation to the emissions of carcinogenic substances.
The inventory showed the presence of cadmium and arsenic ions in tailings dams as the main responsible for this impact, with 69% of the total, this because they receive all the effluents from the ore processing steps. As these elements are not found in the
Table 1
Life cycle inventory.
Impacts from mining for 1.0 kg iron ore produced
Diesel consumption 2.110 4 kg
DIESEL/kgORE
8.8710 3 MJ/kg
ORE
Conveyor belt 4.7310 9 m
BELT/kgORE
Electricity consumption 1.1310 3 kwh/kg
ORE
Explosives 8.7810 3 kg
EXPL/kgORE
Surface mining equipments 2.3810 10 kgEQP/kgORE
Land use Mining occupied area 9.0510 7 m2.yr./kgORE
Mining modified area 1.2110 8 m2.yr./kg
ORE
Plants occupied area 9.3110 7 m2.yr./kg
ORE
Plants modified area 1.2410 10 m2/kg
ORE
Plants impacts 4.7710 11 m2/kg
ORE
Land reclamation Modified area 1.2110 8 m2/kg
ORE
Diesel consumption 8.8710 3 MJ/kgORE
Impacts from iron ore treatment for 1.0 kg concentrate produced
Iron ore consumption 2.32 kgORE/kgCONC
Water consumption 8.7410 4 m3/kg
CONC
Electricity consumption 9.8610 1 kwh/kg
CONC
Amines consumption 1.2110 4 kg/kg
CONC
Other chemicals consumption 6.8410 6 kg/kgCONC
Floculant consumption 3.1310 5 kg/kg
CONC
Coagulant consumption 1.6710 6 kg/kg
CONC
Starch consumption 1.1710 3 kg/kg
CONC
NaOH consumption 6.8410 4 kg/kg
CONC
Slaked lime consumption 9.7310 6 kg/kg
CONC
Grinding media consumption 1.1510 3 kg/kgCONC
Industrial wastes issues 0.43 kg/kgCONC
Impacts from support systems people transportation and wastes management
Buses 0.031 km/DMTCONC
Pickups and vans 0.085 km/DMTCONC
Cars 0.031 km/DMTCONC
Waste transportationeTrucks 0.09 MJ/DMTCONC
Organic wastes 1.3510 3 kg/DMTCONC
Industrial wastes (Tiles and conveyor belts) 1.0310 2 kg/DMT
CONC
Industrial wastes (Civil construction) 5.4410 3 kg/DMT
CONC
Grease wastes (to incineration) 2.010 3 kg/DMT
CONC
analysis made in the waters of dams, a likely explanation for this impact is that these ions enter the process by wear of grinding media during ore processing and reach the dam along with the effluent.
The inventory also shows that due to mining and land recovery activities, arsenic and cadmium appear in elemental form as soil contaminants, and this contribution may be explained as coming
from the steel manufacturing process that makes up the mobile equipment. Inputs also appear as large responsible for this impact, namely: electricity (As-soil, 6.44%), corn starch (Cd-soil 5.19%). The modeling done by Eco-indicator 99 showed that cadmium and arsenic are emitted through the use of fertilizers (used in the pro-duction of plant origin inputs) and electricity generation (in part using biomass as fuel in thermal power plants).
4.2. Impacts on the quality of ecosystems
4.2.1. Ecotoxicityeemissions of toxic substances for ecosystems This impact was quantified in 20.8 PAFm2 x/tonne of concentrate produced.Fig. 6shows that the main contribution with ecotoxicity potential are emissions of metals such as chromium, nickel, zinc and copper, either in the elementary form as in the ionic form.
The inventory inTable 5shows that the most responsible for these emissions are grinding media that contribute, throughout their life cycle, with more than 83% of the total impact. The con-tributions of Crþ2and other ions to the atmosphere can be
attrib-uted to emissions during the metallurgical process in the manufacture of grinding media. Tailings dams are the sector that most contributes to impacts related to the disposal of copper, nickel and cadmium ion in water bodies, accounting for 6% of the total impact. Again, the wear of grinding media in the ore grinding process is the main source of these ions.
Table 2
Life cycle impact assessment results.
Eco-Indicator 99 Impacts on human health For 1.00 DMT Conc Carcinogenic substances 1.0510 5DALY Inhalable organic material 1.9010 8DALY Inhalable inorganic material 5.0610 5DALY
Climate changes 3.3910 6DALY
Radiation 5.2410 8DALY
Ozone depletion 8.9610 10DALY
Damage to ecosystem For 1.00 DMT Conc
Ecotoxicity 20.8 PAF. m2.yr.
Acidification/Eutrofication 0.561 PDF. m2.yr.
Land use 5.26 PDF. m2.yr.
Natural resources depletion For 1.00 DMT Conc Mineral resources depletion 44.8 MJSurplus Fossil fuel depletion 16.5 MJSurplus IPCC 2007 Impacts on the climate changes For 1.00 DMT Conc
Greenhouse gases emissions 23.32 kg CO2 eq
Fig. 4.Description of the impacts on human health related to the inhalable inorganic material emissions.
Table 3
Inhalable inorganic substances emissions.
Inhalable inorganic material
Unit process Activities Partic. Material
(2.5e10mM)
Partic. Material (<2.5mM)
Nitrogen oxide Sulfur dioxide Ammonia Others %
Mining Rom vale 5.33 2.25 3.48 0.52 11.58
Mining Operation 46.30 9.60 55.90
Mining operation trucks 1.11 1.28 0.18 2.57
Waste rock transportation trucks 0.85 1.04 0.12 2.01
Land reclamation 1.25 1.54 0.16 2.95
Mining plant 1.89 1.89
Totals 51.63 15.06 7.34 2.87 76.90
Iron ore treatment Vale concentrate 3.41 1.44 2.23 0.33 7.41
Minding media 3.09 5.74 1.04 0.71 0.05 10.63
Electricity 0.66 0.75 0.68 2.09
Corn starch 0.39 0.32 0.41 1.12
Plant operation 1.65 1.65
Totals 7.16 7.18 4.41 0.71 0.32 3.12 22.90
Support systems Buses, cars, trucks, etc. 0.11 0.09 0.20
4.2.2. Land use
The impact caused by land use and transformation showed a total value of 5.26 PDF. m2.year/tonne of concentrate produced.
Fig. 7 shows the contribution of the main activities for the impact on land use.Table 6shows the participation of each activity in the impact on land use.
This inventory shows that most of the impacts on land use is linked to processing raw materials (43.05% of the total), which are derived from agricultural activities (occupied areas) related to the production of corn and cassava starch and therefore outside pro-cesses directly developed by the mining company. Mining activity accounts for 33.35% of this impact due to the transformation of land in mining and industrial area and its occupation during the time of company activity. Impacts associated with diesel fuel consumption refer to the mixture of 5% of biodiesel, which is primarily derived from soybean oil, and this input requires large areas for soybean planting. The same occurs for the electricity consumed, which is mostly composed of hydroelectric sources with the transformation and occupation of large areas for the installation of power plants.
4.3. Abiotic resource depletion impacts
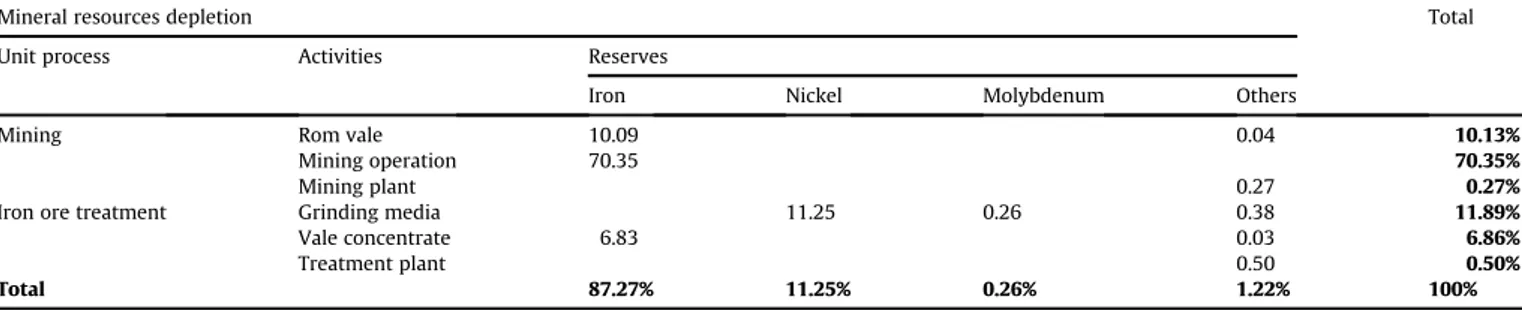
4.3.1. Mineral resource depletion
Mineral resource depletion impacts totaled 44.8 MJ Surplus/ tonne of concentrate produced.Fig. 8shows the process activities, highlighting the natural resources depletion andTable 7shows the participation (% of total impact) of the company's activities in relation to mineral resource depletion impacts.
The main contribution to Mineral resource depletion was the iron ore mining activity, with about 80% of the impact. However, grinding media have a significant participation in this impact, around 11%. The inventory of environmental impacts revealed that this value is almost entirely due to nickel extraction for the pro-duction of grinding media.
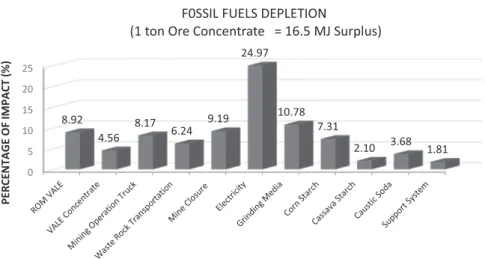
4.3.2. Fossil fuel depletion
The total impact related to the consumption of fossil fuels totaled 16.5 MJ Surplus/tonne of concentrate produced, lower than that found byNorgate and Haque (2010)for iron mine, which was 152.7 MJ Surplus/tonne of concentrate produced.Fig. 9shows that
Fig. 5.Description of the impacts on human health related to the carcinogenic substances emissions.
Table 4
Carcinogenics substances emissions.
Carcinogenic substances
Unit process Activities Particulate material (<2.5mM) As in soil Cd in soil Cdeion, water Aseion, water As in air Others Total
Mining Rom vale 0.46 0.21 0.32 0.85 4.46%
Mining operation 0.65
Mining operation trucks 0.13 0.17 0.19
Mining operation loaders 0.17 0.09 0.12
Land reclamation 0.20 0.16
Mining plant 0.74
1.11 0.51 0.78 2.06
Iron ore treatment Vale concentrate 3.23 3.50 0.34 95.40%
Waste dam 35.92 33.15
Electricity 6.44 1.37
Corn starch 5.19 0.39
Cassava starch 0.96 0.15
Minding media 2.04 0.49 1.47
Plant operation 0.76
9.67 9.65 35.92 35.19 0.49 4.48
Support systems Buses, cars, trucks, etc. 0.09 0.05 0.14
Fig. 6.Description of the damage to ecosystems related to the ecotoxicity from some emissions.
Table 5 Ecotoxicity.
Ecotoxicity
Unit process Activities Cr II air Cr VI air Cr VI soil Ni air Ni ion water Zn air Cu ion water Lead air Cd ion water Others %
Mining Rom vale 0.65 0.08 0.16 0.98 1.87
Plants 0.08 0.16 0.14 0.38
Trucks 0.27 0.11 0.38
Loaders 0.09 0.24 0.33
Operation 0.73 0.73
Sub-total 1.01 0.16 0.32 2.20 3.69
Iron ore treatment Vale concentrate 0.01 0.01 0.04 0.10 0.06 0.02 0.01 0.01 0.69 0.95
Waste dam 1.87 1.93 1.26 1.17 6.23
Grinding media 61.77 1.53 1.97 7.74 6.25 1.70 2.18 83.14
Electricity 1.22 0.40 1.33 2.95
Operation 2.83 2.83
Sub-total 61.77 1.54 1.23 2.41 9.71 6.31 1.95 1.71 1.27 8.20 96.1
Support systems Buses, cars, trucks, etc. 0.11 0.10 0.21
Sub-total 0.21
Total 62.78 1.54 1.23 2.57 9.71 6.63 2.96 1.71 1.27 0.11 100
the consumption of electricity was the most relevant aspect related to fossil fuel depletion, accounting for 25% of the total impact. If evaluated from the perspective of the Brazilian electricity, unlike in Australia, it has low dependence on fossil fuels, and must be the cause found for the large difference found between inventories.
Table 8shows the participation (% of total impact) of the com-pany's activities in relation to impacts on the depletion of these resources. Once all the processes studied depend on energy, it is expected that most of these processes contribute in some way to this category of impact, either by the consumption of fuels (diesel, natural gas or fuel oil) or by the national grid electricity con-sumption, comprising about 10% of energy from fossil sources. This portion is relatively low when compared to other countries or even the world average, which depends on average of 80% of fossil fuels (MME, 2013).
Diesel consumption in mining activities equipment significantly participates in the composition of the impact of fossil fuel depletion (Table 8), with 34% of the total impact (trucks with loaders and transport of waste). Grinding media appear with 10.78% of the total impact on fossil fuels due to the consumption in production and transportation to the company. The remainder of this impact is due to the production and transportation of raw materials used in the concentration plant such as corn starch, cassava starch, and caustic soda. Impacts caused by Support Systems are basically due to fuel consumption in the transport of waste and personnel.
4.4. Impacts on climate changes (Global warming)
4.4.1. Greenhouse gases (GHG)
The total impact found for this category was 13.32 kgCO2eq/
tonne of concentrate produced, very similar to that found by
Norgate and Haque (2010), which was 11.9 kgCO2eq/tonne of
concentrate produced. Fig. 10 highlights that the electricity consumed in the process has in its life cycle the potential to produce almost the same amount of GHG emitted by all other inputs in their own life cycles together. The production and transportation of grinding media is the second largest contributor to this impact, followed by chemicals used in oreflotation: starch, caustic soda and amine. These data show that due to specific processes, GHG emissions are around 5 kgCO2eq (i.e., about 37% of
the total impact).
Table 9shows that this aspect is basically due to the burning of diesel fuel in virtually all activities of the process under study. An analysis of these issues shows that the most responsible are pre-vious processes, external to the company. Thus, the most significant contributions to this impact come from inputs used in the ore beneficiation process, electricity, grinders, starches, amine, caustic soda and other inputs, totaling 8.53 kgCO2eq (63.39% of total).
Table 6 Land use.
Land use
Unit process Activities Occupation
land
Soy planting Cornfield Cassava planting
Sugar cane plantation
Hydro power plant
Others Total
Mining Rom vale 3.45 3.45%
Mining operation 28.36 28.36%
Mining operation (Bio-Diesel) 7.15 7.15%
Reclamation land (Bio-diesel) 4.75 4.75%
Plant 1.00 1.00%
Iron ore treatment Vale concentrate 1.54 1.54%
Starch 30.89 12.16 43.05%
Electricity 3.00 5.40 8.40%
Plant 1.86 1.86%
Support systems Diesel 0.44 0.44%
Total 33.35% 12.34% 30.89% 12.16% 3.00% 5.40% 2.86% 100%
Fig. 8.Description of the impacts on abiotic resources related to the mineral resource depletion.
Table 7
Mineral resources depletion.
Mineral resources depletion Total
Unit process Activities Reserves
Iron Nickel Molybdenum Others
Mining Rom vale 10.09 0.04 10.13%
Mining operation 70.35 70.35%
Mining plant 0.27 0.27%
Iron ore treatment Grinding media 11.25 0.26 0.38 11.89%
Vale concentrate 6.83 0.03 6.86%
Treatment plant 0.50 0.50%
Fig. 9.Description of the impacts on abiotic resources related to the fossil fuels depletion.
Table 8
Fossil fuels depletion.
Fossil fuels depletion
Unit process Activities Reserves Total
Crude oil Natural Gas Natural coal Others
Mining Rom vale 7.92 0.97 0.03 8.92
Mining operation trucks 7.40 0.74 0.03 8.17
Waste rock transportation 5.94 0.30 6.24
Mining operation loaders 3.76 0.64 0.03 4.43
Mine closure (Reclamation) 8.74 0.45 9.19
Others 2.04 2.04
Iron ore treatment Electricity 15.66 8.75 0.56 24.97
Grinding media 5.76 3.83 0.91 0.28 10.78
Corn starch 3.89 3.38 0.04 7.31
Cassava starch 1.09 1.00 0.02 2.10
Caustic soda 1.37 2.10 0.21 3.68
Vale concentrate 4.03 0.52 0.01 4.56
Others 5.80 5.80
Support systems Buses, cars, trucks, etc. 1.63 0.18 1.81
Total 100.00%
5. Conclusions
LCAeLife cycle assessmenteproved to be a powerful tool in the assessment of environmental impacts produced by an iron open pit mine. The impact assessment has identified grinding media as an important contributor in different categories, such as the emission of inhalable inorganic substances with 10.63% in this category, ecotoxicity with 83.14%, mineral resource depletion with 11.89%, inorganic substances with 10.63% and fossil fuel depletion with 10.78%. Therefore, if life cycle is considered, this input is of paramount importance for any guidance with respect to environ-mental management of an iron mine.
Diesel consumption in mining activities equipment is presented as the main source of fossil fuel depletion, totaling 36% of the total impact. This could suggest the adoption of an increased use of biodiesel as an alternative in order to minimize“climate changes” and“consumption of fossil fuels”impacts. However, since plant fuel has other impacts related to extensive crop plantations, for example, “land use” and“emissions of carcinogenic substances”, these aspects should be considered before carrying out a simple fuel exchange. The results also show how mining can influence the production chain of its inputs and impacts associated with this chain. For example, the area required to obtain some inputs such as starch is as significant as the area needed for ore mining and tail-ings dams. That is, many times, the lower use of inputs can be more significant for environmental conservation than the limitation of its own production, proving that the eco-efficiency concept propa-gates environmental benefits obtained for the entire chain of the process under analysis.
Acknowledgments
The authors would like to thank Samarco Mineraç~ao for support and sponsorship for the conduction of this work. They also thank GEOCLOCK professionals, Engineer Thales Crivelli Nunes, future Engineer Lucas de Paula Couto Ferreira for support and in particular Engineer Rodigo Dutra, Samarco's Environment Manager.
References
Awuah-Offei, K., Adekpedjou, A., 2011. Application of life cycle assessment in the mining industry. J. LCA 16, 82e89 (accessed 28.02.15.).http://www.elsevier.
com/locate/jlca.
Azapagic, A., Clift, R., 1999. Life cycle assessment as a tool for improving process performance: a case study on boron products. J. LCA 4 (3), 133e142 (accessed 02.03.15.).http://www.elsevier.com/locate/jlca.
Bieda, B., 2012. Life cycle inventory processes of the Mittal Steel Poland (MSP) S.A. in Krakow, Polandeblast furnace pig iron productionea case study. J. Life Cycle Assess. 17, 787e794 (accessed 02.03.15.).http://www.elsevier.com/locate/jlca. Blengini, G.A., Garbarino, E., Solar, S., Shields, D.J., Hamor, T., Vinai, R.,
Agioutantis, Z., 2012. Life cycle assessment guidelines for the sustainable pro-duction and recycling of aggregates: the Sustainable aggregates Resource Management Project (SARMa). J. Clean. Prod. 27, 177e181 (accessed 10.12.13.).
www.elsevier.com/locate/jclepro.
Bovea, M.D., Saura, U., Ferrero, J.L., Giner, J., 2007. Cradle-to-gate study of red clay for use in the ceramic Industry. J. LCA 12 (6), 439e447 (accessed 02.03.15.).
http://www.elsevier.com/locate/jlca.
Ditsele, O., Awuah-Offei, K., 2012. Effect of mine characteristics on life cycle impacts of US surface coal mining. J. Life Cycle Assess. 17, 287e294 (accessed 08.08.13.).
www.elsevier.com/locate/jlca.
Ditsele, O., 2010. Application of Life Cycle Assessment to Estimate Environmental Impacts of Surface Coal Mining. Faculty of Graduate School of the Missouri University of Science and Technology, Missouri. USA, p. 253.
Durucan, S., Korre, A., Munoz-Melendez, G., 2006. Mining life cycle modelling: a cradle-to-gate approach to environmental management in the minerals In-dustry. J. Clean. Prod. 14, 1057e1070 (accessed 13.02.12.).http://www.elsevier.
com/locate/jclepro.
Frischknecht, R., Rebitzer, G., 2005. The ecoinvent database system: a compre-hensive web-based LCA database. J. Clean. Prod. 13 (2005), 1337e1343 (accessed 28.02.15.).http://www.elsevier.com/locate/jclepro.
Goedkoop, M., Spriensma, R., 2001. The Eco-indicator 99ea Damage Oriented
Method for Life Cycle Impact Assessment. Pre-consultants B.V., Third ed. Amerfoort, The Netherlands, p. 144.
Guo, X., Xiao, S., Xiao, X., Li, Q., Yamamoto, R.i, 2002. LCA case study for lead and zinc production by an imperial smelting process in Chinaea brief presentation. J. LCA 7 (5), 276.http://www.elsevier.com/locate/jlca(accessed 28.02.15.). Hake, Jürgen-F., Landwehr, U., Schreiber, A., 1998. Integrated analysis of metallic
resourceflowsea report on a new research programme. J. LCA 3 (4), 182e183.
http://www.elsevier.com/locate/jlca(accessed 28.02.15.).
Li, G., Nie, Z., Zhou, H., Di, X., Liu, Y., Zuo, T., 2002. An accumulative model for the comparative life cycle assessment case study: iron and steel process. J. LCA 7 (4), 225e229.http://www.elsevier.com/locate/jlca(accessed 28.02.15.). Mangena, S.J., Brent, A.C., 2006. Application of a life cycle impact assessment
framework to evaluate and compare environmental performances with eco-nomic values of supplied coal products. J. Clean. Prod. 14, 1071e1084.http://
www.elsevier.com/locate/jclepro(accessed 24.09.12.).
MMEeMinisterio das Minas e Energia, 2013. Anuario Estatístico de Energia Eletrica, pp. 23e63. Brasília, DF, Brasil.http://www.mme.gov.br/(accessed 28.02.15.). Mudd, G.M., 2007. Global trends in gold mining: towards quantifying
environ-mental and resource sustainability? Resour. Policy 32, 42e56.http://www.
elsevier.com/locate/resourpol/(accessed 16.03.13.).
Norgate, T., Haque, N., 2010. Energy and greenhouse gas impacts of mining and mineral processing operations. J. Clean. Prod.http://www.elsevier.com/locate/ jcleproFebruary 18: 266e274. (accessed 15.04.13.).
Norgate, T.E., Jahanshahi, S., Rankin, W.J., 2007. Assessing the environmental impact of metal production processes. J. Clean. Prod. 15, 838e848.www.elsevier.com/
locate/jclepro(accessed 02.03.15.).
Northey, S., Haque, H., Mudd, G., 2013. Using sustainability reporting to assess the environmental footprint of copper mining. J. Clean. Prod. 40, 118e128. Monash Table 9
Greenhouse gases emissions.
Greenhouse gas emissions
Unit process Activities Impact Total
Kg CO2eq %
Mining Rom vale 0.50 3.75 23.94%
Mining operation trucks 0.72 5.40
Waste rock transportation 0.50 3.75
Mining operation loaders 0.43 3.23
Conveyor belt 0.16 1.20
Backhoe 0.07 0.53
Mine plant 0.07 0.53
Mine closure (Land reclamation) 0.74 5.55
Iron ore treatment Electricity 4.20 31.53 67.13%
Grinding media 2.26 16.99
Starch 1.18 8.86
Amine 0.11 0.83
Caustic soda 0.69 5.18
Vale concentrate 0.41 3.08
Others inputs 0.09 0.66
Support systems Buses, cars, trucks, etc. 1.19 8.93 8.93%
University, Clayton, Victoria, Australia.http://www.elsevier.com/locate/jclepro
(accessed 15.04.14.).
Ripley, E.A., Redmann, R.E., Crowder, A.A., 1996. Environmental Effects of Mining. St. Lucie Press, Delray Beach, p. 356.
StatistaeThe Statistics Portal, 2015a. World Reserves of Iron Ore by Country.http://
www.statista.com/statistics/267381/world-reserves-of-iron-ore-by-country/
(accessed 28.02.15.).
StatistaeThe Statistics Portal, 2015b. Top Exporting Countries of Iron Ore.http://
www.statista.com/statistics/300328/top-exporting-countries-of-iron-ore/
(accessed 28.02.15.).
USGSeUnited States Geological Service, 2013. Review of Selected Global Mineral
Industries in 2011 and an Outlook to 2017, p. 37.
USGSeUnited States Geological Service, 2015. Mineral Commodity Summaries,
January, pp. 84e85.
Valderrama, C., Granados, R., Cortina, J.L., Gasol, C.M., Guillem, M., Josa, A., 2012. Implementation of best available techniques in cement manufacturing: a life-cycle assessment study. J. Clean. Prod. 25, 60e67.http://www.elsevier.com/