Research article
New approach for reduction of diesel consumption by comparing
different mining haulage con
fi
gurations
Edmo da Cunha Rodovalho
a,*, Hernani Mota Lima
b,1, Giorgio de Tomi
c,2 aInstitute of Science and Technology, Federal University of Alfenas, BrazilbDepartment of Mining Engineering, Federal University of Ouro Preto, Brazil cDepartment of Mining and Petroleum Engineering, University of S~ao Paulo, Brazil
a r t i c l e
i n f o
Article history:
Received 14 September 2015 Received in revised form 25 February 2016 Accepted 26 February 2016 Available online 3 March 2016
Keywords:
Fuel consumption Statistics
Mathematical modelling Mining haulage operations
a b s t r a c t
The mining operations of loading and haulage have an energy source that is highly dependent on fossil fuels. In mining companies that select trucks for haulage, this input is the main component of mining costs. How can the impact of the operational aspects on the diesel consumption of haulage operations in surface mines be assessed? There are many studies relating the consumption of fuel trucks to several variables, but a methodology that prioritizes higher-impact variables under each specific condition is not available. Generic models may not apply to all operational settings presented in the mining industry. This study aims to create a method of analysis, identification, and prioritization of variables related to fuel consumption of haul trucks in open pit mines. For this purpose, statistical analysis techniques and mathematical modelling tools using multiple linear regressions will be applied. The model is shown to be suitable because the results generate a good description of the fuel consumption behaviour. In the practical application of the method, the reduction of diesel consumption reached 10%. The imple-mentation requires no large-scale investments or very long deadlines and can be applied to mining haulage operations in other settings.
©2016 Elsevier Ltd. All rights reserved.
1. Introduction
In large open pit mines, load and haul operations are commonly performed by haul trucks and excavators. Among the operations performed in an open pit mine, haulage has the highest operating cost. Over the past years, this method has been widely discussed due to the significant increase in its operating costs (Curry et al., 2014). This is justified on the basis of inputs such as diesel oil and tyres. According toBozorgebrahimi et al. (2003), transport opera-tions account for 46% of the mining operation costs. In addition, the
fuel ranksfirst in the composition of these costs.
Against this background, mining companies seek to reduce operational costs by controlling the consumption of these inputs. By applying techniques that reduce the consumption of supplies, the mining industry can become more economical and sustainable (Gomes et al., 2015). Therefore, assessment of the variables that influence diesel consumption becomes essential to ensure the competitiveness of the mining industry. However, the mining in-dustry lacks a methodology able to select and measure the opera-tional aspects that have more or less influence on fuel consumption. Filling this gap would represent a tangible method of management and control of the operating costs of haul trucks. Effective control of the consumption of fossil fuels also improves mining companies’ environmental performances, reducing their greenhouse gas emissions.
The purpose of this paper is to build a methodology to identify and classify the operational variables that influence the fuel oil consumption of haul trucks. In addition, it aims to develop actions that reduce fuel consumption. With the use of statistical analysis and multivariate linear regression tools, which are applied to the modelling of fuel consumption behaviour, it is possible to manage *Corresponding author. Universidade Federal de Alfenas, Instituto de Ci^encia e
Tecnologia, Rod. Jose Aurelio Vilela, 11999, BR 267 km 533, Cidade Universitaria, 37715-400, Poços de Caldas, MG, Brazil.
E-mail addresses: [email protected], edmo.rodovalho@gmail. com(E.C. Rodovalho),[email protected](H.M. Lima),[email protected](G. de Tomi).
1 Permanent address: Universidade Federal de Ouro Preto, Escola de Minas,
Departamento de Engenharia de Minas, Campus Universitario Morro do Cruzeiro, 35400-000, Ouro Preto, MG, Brazil.
2 Permanent address: Universidade de S~ao Paulo, Escola Politecnica,
Departa-mento de Engenharia de Minas e de Petroleo, Av. prof. Mello Moraes, 2373, Labo-ratorio LAPOL, Cidade Universitaria, 05508-900, S~ao Paulo, SP, Brazil.
Contents lists available atScienceDirect
Journal of Environmental Management
j o u r n a l h o m e p a g e : w w w . e l s e v i e r . c o m / l o c a t e / j e n v m a n
the mining operation costs. After the identification and classifi ca-tion of these variables by degree of influence, it will be possible to use prioritization tools to establish the management actions. These actions should be applied on an industrial scale to seek to validate the management method. This study used real data from a large open pit mine. The results obtained were validated at the same open pit mine.
2. Methodology
In large iron mines the overburden and ore transport costs have a direct relationship with the diesel consumption. Due to the growing production demand, it is becoming necessary to use off-road trucks with increasingly large capacities, leading to increased energy consumption.Shafiee and Topal (2012)claim that the estimation, cost simulation, and operating performance anal-ysis can be done through the use of graphical analanal-ysis of tables and equations. All of these features are intended to identify a pattern linked to a particular operating configuration. This pattern is used as a reference to estimate indicators and support decisions in similar operating conditions. In order to identify and investigate the aspects that affect fuel consumption in haulage operations is necessary to delimit a period of one year for data collection. The studies were developed in a large iron mine in the Quadrilatero Ferrífero (Brazil). After this step, prioritization tools were applied to identify actions which can reduce the diesel consumption.
The development of this methodology is not limited to addressing the economic aspects but also has great potential to promote sustainability in mining operations. The key to reducing greenhouse gas emissions and, therefore, reducing diesel con-sumption begins with the development of management tools able to identify and address issues that strongly influence consumption (Levesque et al., 2014).
2.1. Driving and human factors related to fuel consumption
In order to understand the behaviour of fuel consumption in mine haul operations, one should not be limited to mechanical parameters (Australian Government, 2010). However, it is neces-sary to evaluate the influence of the human factor on the behaviour of this variable. Operators’ performance is supported by their driving style. This feature differs under conditions of acceleration, breaking, cornering, speed variations, and manoeuvres. Besides these, there are other associated conditions that influence the performance of the production process, such as weather and topographic conditions (Shafiee and Topal, 2012). It is clear that all of these points are addressed in specific operational training for driving haul trucks. However, mine operation teams comprise a heterogeneous group with respect to the capability to execute each of the process steps in the most safe, economical, and productive way possible.
The first step of this study seeks to establish a method to measure the variability in fuel consumption between the teams by considering their heterogeneity regarding the experience and ability to operate equipment. This condition exists within each team or between one team and another. In addition, teams are subjected to diverse operating circumstances such as weather and haul road conditions, night shifts, visibility, and availability of resources.
A period of one year was assumed for assessment in order to consistently cover all subject teams, variables, and operating con-ditions. One year was considered sufficient to submit all teams to the climate seasonality that occurs during the year. An onboard system of sensors in trucks has been developed for evaluating the equipment performance and operating conditions regarding diesel
consumption. A report by theAustralian Government (2010) in-dicates that the diversity of haul road conditions has a direct effect on fuel consumption.Fig. 1illustrates the topographic surface of the operating mining area where the studies were developed.
The lines represent the active haul roads used by trucks, with their grades, between load and dumping points. The segment formed by the points A and B forms the route AB, while the points C and D form the route CD. These routes were selected so that the influence of the operators’performance could be evaluated in a broad and representative way. The route CD represents the waste rockflow and the route AB the iron oreflow.Fig. 2illustrates the elevation profile of the route AB, whileFig. 3shows the elevation profile of the route CD. Points A and C are loading points and B and D are dumping ones. Haul route AB is considered a favourable gradient because the trucks are loaded down the ramp and gravity helps the movement. The CD profile is considered unfavourable because the loaded trucks go up the ramps. On these roads the trucks must overcome rolling resistance, generated by the friction of the tyres with the pavement, and gradient resistance. The per-formance of the haul trucks depends on the design of the mine haul roads and gradient variations (Thompson and Visser, 2006). In this way all the teams and operators are subject to different types of haul roads.
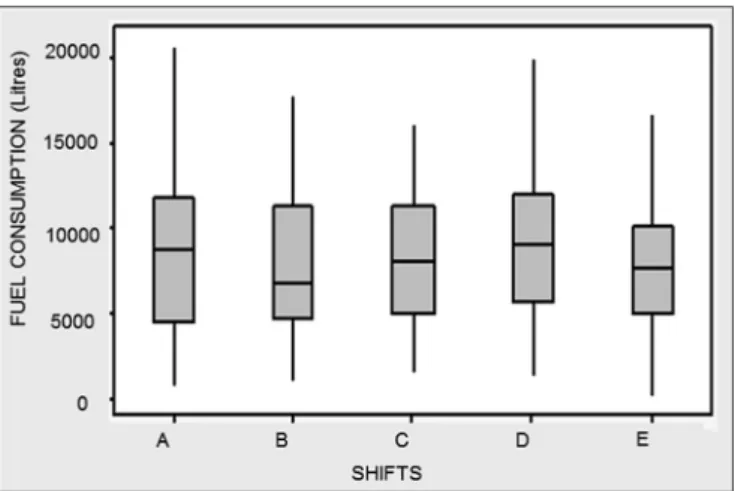
The studied mine operation has a transportfleet of mechanical and electromechanical trucks, both of which have the same load capacity. All truck drivers are able to operate bothfleets’ equip-ment. The evaluation of the human factor was performed consid-ering mechanical trucks on routes AB and CD for one year. Descriptive statistical analysis was thefirst step in assessing the data generated by thefive mine operation teams. Boxplot graphics were used to perform this analysis and check for outliers. It is also necessary to evaluate whether there are significant differences in terms of absolute diesel consumption between teams. For this it is necessary to perform a normality test to assess thep-value. This standard defines the use of parametric or non-parametric methods to measure the relevance of variability between samples (Montgomery and Runger, 2007). If the variability between teams is not significant, one can consider that there is no difference in consumption between them. Thus, technical heterogeneity be-tween operators does not correspond to different consumption patterns, which eliminates the influence of the human factor.
For the route AB, 239 measurements of thefive teams were performed. Each measurement represents an absolute consump-tion of diesel in a 6-h shift.Fig. 4shows a graphical representation of descriptive statistics using a boxplot graph corresponding to the fuel consumption on the AB path. Fig. 5 illustrates the graph referring to the route CD boxplot. InFig. 4one can observe the absence of outliers and that the B team had the lowest median. Fig. 5also shows no presence of outliers. Outliers are points that indicate consumption above normal during the research. Each point represents a shift with consumption above normal. On this route team D showed lower variability. From the boxplot graphics one can observe the variations of the median between the teams. But it is not possible to state that the variability between the teams is relevant. According toOskouei and Awuah-Offei (2014), further analyses such as normality tests are required to determine whether the variability is significant. After this test, it is necessary to apply parametric or non-parametric analysis to measure the significance of the variance.
known as non-parametric methods (Montgomery and Runger, 2007). However, the KruskaleWallis test may be applied, which is a non-parametric alternative equivalent to the F-test. With the application of this test one can check whether there is a difference between the average fuel consumption of the teams on routes AB and CD.
Through a tool of statistical analysis it is possible to consider the population studied and apply the KruskaleWallis test. Table 1 shows the results of application of the test relating to the haul roads AB and CD. For route AB, the test indicates ap-value equal to 0.692, which is greater than the significance level of 5%. Therefore, the null hypothesis is not rejected, meaning that the fuel con-sumption does not show significant variability between teams.
Evaluating the results for the CD route thep-value is equal to 0.096, which is greater than the significance level of 0.05. Therefore, the null hypothesis is not rejected, meaning that the fuel consumption does not show significant variation among the teams.
2.2. Variable selection
Between 2008 and 2009, the Australian government analysed the energy balances of 40 active mines and found that 17% of the energy comes from the burning of fossil fuels. At these units, energy consumption reduction programmes were implemented through the application of management routines, control, and simulation. As a result of these initiatives, an average 6% reduction in fuel Fig. 1.Topographic surface with the active haul roads considered in the study.
consumption was achieved (Australian Government, 2010). Against this background, the development of routines and methods to manage the energy consumption can lead to a good economic performance for a mining company. Therefore, it is necessary to identify, manage, and evaluate each of the variables that have an influence on fuel consumption.Shafiee and Topal (2012)state that a collection of detailed and comprehensive data is the key input of accurate and reliable estimate tools used in mining projects.
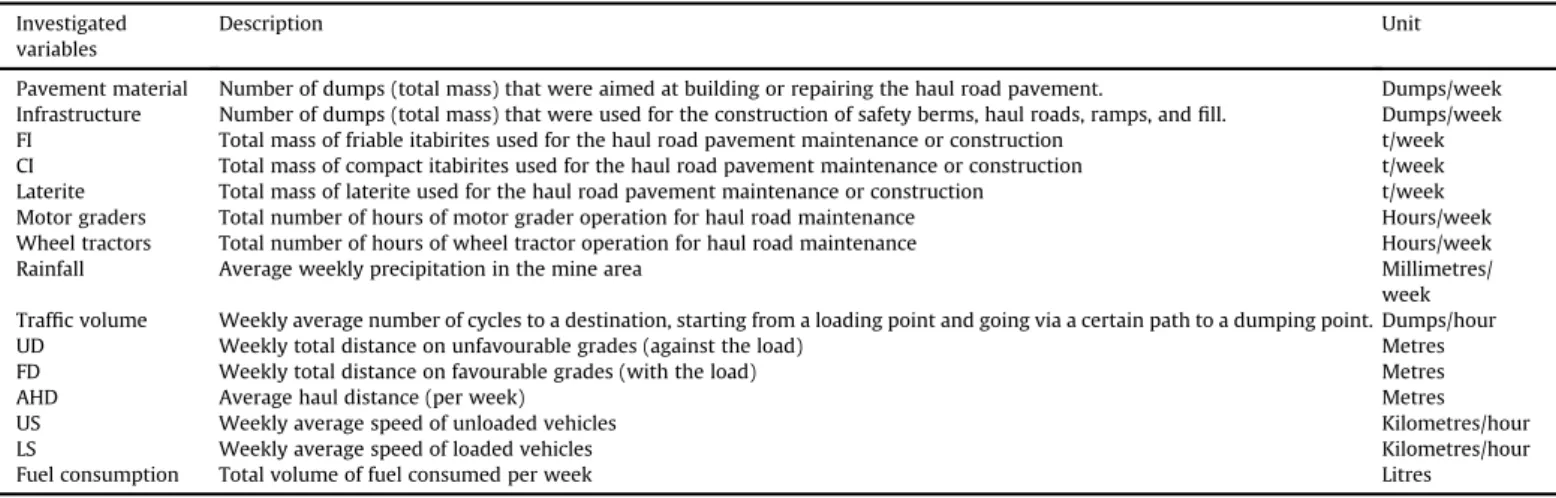
According toMotlogelwa and Minnitt (2013), fuel consumption is related to the gross vehicle weight of trucks. Thompson and Visser (2003)developed a model that relates the consumption of diesel to unfavourable and favourable gradients, truck speed, haul road conditions, and overall rolling resistance. Besides considering issues related to haul roads' infrastructure and speed, this paper seeks to relate operational management aspects and the weather seasonality with fuel consumption. The activities started by col-lecting data for 12 months in a large iron mine in the Quadrilatero Ferrífero region of Brazil. The choice of the period was based on the need to consider the performance of operations in the dry and wet seasons. The daily working schedule of the truckfleet is divided into four 6-h shifts per day, 7 days per week. The selection of var-iables covered in this study comes from operational controls data available infleet management systems. The studied mining com-pany provided controls for several process variables that can exert an influence on the diesel consumption. All of these data are collected automatically and were obtained from internal reports. Besides the variables considered earlier, that is, the human factor in fuel consumption and the trucks’performance on different grades, this section will be consider some additional variables. These will be used in the construction of the model to explain the fuel con-sumption in a large mining operation. This model attempts to measure the influence of each variable that has a high correlation with the fuel consumption.Table 2lists the variables considered in this study. Next to each variable is a description and the unit of measurement.
Considering the large number of variables involved in the pro-cess and the long period of data collection, it was nepro-cessary to use a statistical analysis tool. For this, Minitab16 was used. This software is able to select the variables according to significance level and is also used in modelling of the investigated scenarios. As the focus of the research is the absolute fuel consumption in litres, this variable is called the response variable and all other variables are called predictors. To select the predictor variables, the stepwise regression method (forward and backward) was used, where the analysis is started using all variables and then they are successively excluded in order of increasing correlation. The selection is completed when Fig. 3.Detailed elevation profile of route CD.
Fig. 4.Boxplot graph of fuel consumption for each shift on haul route AB.
Fig. 5.Boxplot graph of fuel consumption for each shift on haul route CD.
Table 1
KruskaleWallis test applied to analysis of the fuel consumption on routes AB and CD.
KruskaleWallis test of fuel consumption
Haul route p-value
AB 0.692
a satisfactory correlation equation is reached. This method is suit-able when there are a large number of predictor varisuit-ables that have some level of correlation with the response variable.
Table 3 shows the result of applying the variables selection technique by the stepwise regression method. This application corresponds to thefleet of mechanical trucks on the haul road AB. In step 4 only variables withp-values smaller than 0.15, among all those listed inTable 2, are selected by the tool. With the evaluation of this parameter in each round, step 4 is the stepwise regression
final model. Thus, all variables with compatiblep-values are pro-vided in the model.Table 3shows the values of the adjusted co-efficient of determination (R2adj), which is useful to compare models with different numbers of predictors. The higher R2adj value, the better the modelfits the data. The same technique was applied to mechanical trucks on all active paths of the mine.
2.3. Development and validation of the model
Considering the results shown inTable 3, step 4 sets out the parameters which best explain the fuel consumption on the haul road AB using Equation(1). The next step is the application of a residual plot analysis. Thus, it is necessary to verify the presence of autocorrelation in the residuals of the regression analysis per-formed. The DurbineWatson statistic and analysis of Cook's dis-tances are the most efficient tools for this analysis. In Equation(1), the value of the DurbineWatson statistic obtained is equal to 1.52, indicating that the residuals are independent and there is no autocorrelation. Cook's distances analysis indicates no influential point. Both analyses show the consistency of the model describing the fuel consumption on the haul road AB.
Fuel Consumption¼ 1384þ15790 Traffic
volumee16.9 Pavement materialþ0.084 FIþ36 Rainfall (1)
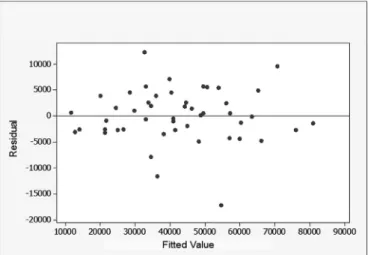
For additional verification of the model, one should apply graphic residual analysis. For this routine it is necessary to certify that the residuals follow a normal distribution, have constant variance, and are independent, as assumed in a multiple linear regression model. InFig. 6, the normal probability graph shows that the points follow the line of theoretical normal probability, with p-values>0.15, so it can be assumed that the residuals do not deviate significantly from a normal distribution.Fig. 7shows the graph of residuals versus fitted values, where the constant variance assumption is not broken because the residues are randomly distributed around zero and have approximately the same disper-sion for all adjusted values. No outlier is present.Fig. 8shows the graph of residuals versus observation order; the points do not have any trend, and thus it is assumed that the errors are independent. In Fig. 9the histogram displays information compatible with a normal distribution. Thus, all the elements necessary to validate the model are satisfactorily fulfilled. Therefore, Equation(1)is able to explain the absolute diesel consumption on the haul road AB appropriately. For all other haul roads, the same procedure was applied considering thefleet of mechanical trucks. Equation(2)describes the fuel consumption of mechanical trucks on all active haul roads of the studied mining company. On the other hand, Equation(1) Table 2
List of variables used to build the simulation model and the system of equations that explain the fuel consumption in haulage operations.
Investigated variables
Description Unit
Pavement material Number of dumps (total mass) that were aimed at building or repairing the haul road pavement. Dumps/week Infrastructure Number of dumps (total mass) that were used for the construction of safety berms, haul roads, ramps, andfill. Dumps/week
FI Total mass of friable itabirites used for the haul road pavement maintenance or construction t/week
CI Total mass of compact itabirites used for the haul road pavement maintenance or construction t/week
Laterite Total mass of laterite used for the haul road pavement maintenance or construction t/week
Motor graders Total number of hours of motor grader operation for haul road maintenance Hours/week
Wheel tractors Total number of hours of wheel tractor operation for haul road maintenance Hours/week
Rainfall Average weekly precipitation in the mine area Millimetres/
week Traffic volume Weekly average number of cycles to a destination, starting from a loading point and going via a certain path to a dumping point. Dumps/hour
UD Weekly total distance on unfavourable grades (against the load) Metres
FD Weekly total distance on favourable grades (with the load) Metres
AHD Average haul distance (per week) Metres
US Weekly average speed of unloaded vehicles Kilometres/hour
LS Weekly average speed of loaded vehicles Kilometres/hour
Fuel consumption Total volume of fuel consumed per week Litres
Table 3
Stepwise regression for mechanical trucks on haul road AB.
Response Fuel consumption
Step 1 2 3 4
Constant 231.5 2630.3 1508.9 1384
Variables Coefficients
Traffic volume 15,100 15,173 15,009 15,790
Pavement material 10.7 13.5 16.9
FI 0.078 0.084
Rainfall 36
R2
adj 88.15 88.96 89.76 90.70
presents a specific analysis of a sector of the mine (haul road AB) where the largest ore productionflow occurs. By analysing all active haul roads, it is possible to identify the variables that have a global influence.
Fuel Consumption¼ 23519þ11561 Traffic Volumeþ197 Motor
graderse60.4 Pavement materialþ1.28 Lateritee0.301 CI (2)
From Equation (2), an adjusted coefficient of determination (R2adj) of 93.8% is obtained, which shows a good modelfit regarding the data. From Equation(2), a value of the DurbineWatson statistic of 1.66 is obtained, indicating that the residuals are independent and there is no autocorrelation. The analysis of the Cook's distances does not indicate any influential point. In the graphical analysis of the residuals, the theoretical normal distribution is followed with no significant deviations. The other charts also indicate that there is no inconsistency in the model. Therefore, Equation(2)is able to explain the absolute fuel consumption of the mechanical truckfleet for all haul roads properly.
3. Practical application
The model developed in order to know the diesel consumption behaviour has two sections. Thefirst is a statistical analysis that measures the impact of the human factor, while the second brings a system of equations able to identify the variables that have the greatest influence on a specific haul road or all haul roads. When evaluating the results obtained in the statistical analysis it is observed that the performance of the operators, considering different skill levels, does not promote significant changes in diesel consumption. However, the system of equations indicated a group of variables with the greatest degree of influence on fuel con-sumption. This group changes when analysing a specific haul road or a complete set of active haul roads of a mine. Nevertheless, both equations show that fuel consumption is sensitive to haul road conditions and thefleet's management system. Management tools can be applied to evaluate practical actions related to the identified variables in equations. These actions seek to reduce the influence of factors that may increase the diesel consumption.
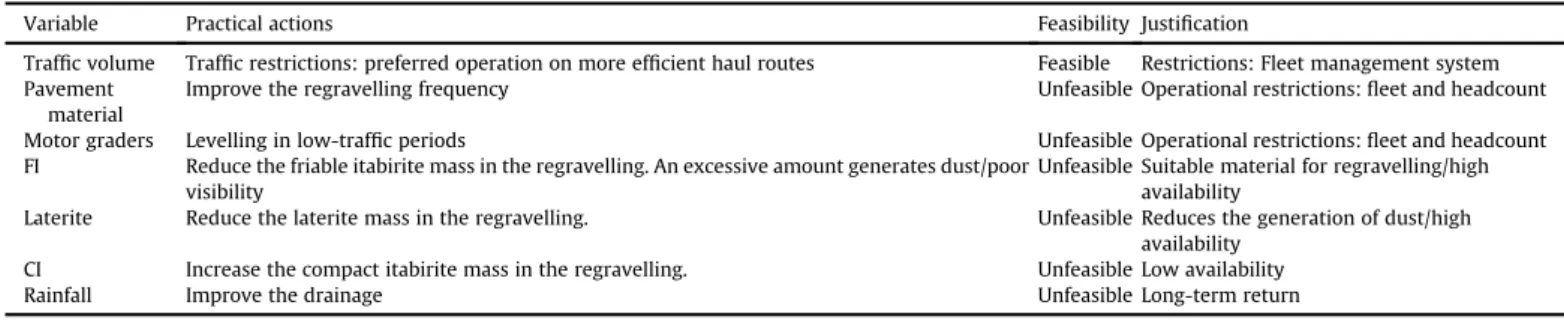
In an open pit mine, the road design, trafficability, and condi-tions of the roadway surface affect the diesel consumption (Australian Government, 2010). There are several operating con-ditions that can be modified in order to increase energy efficiency in mine haul operations (Nader et al., 2012). Table 4 shows the feasibility matrix, which aims to identify actions that can be taken to improve the short-term results and do not require large in-vestments. The practical matrix actions are proposed according to analysis of Equations(1) and (2). These equations report that the variablespavement materialsandCIare inversely proportional to fuel consumption. According toThompson and Visser (2000), the selection of appropriate wearing-course material for structural design and road surface, following maintenance routines, promotes reduction of mining costs due to increased energy efficiency in haulage. This is supported by equations and the data shown in Table 4. The other variables are directly proportional to fuel con-sumption. Therefore, the actions related to these variables must block the influence on fuel consumption.
The identification of variables and practical actions is the result of the analysis of Equations(1) and (2). The feasibility of the actions relies on technical and economic aspects. This study prioritizes actions that do not constitute new investments and that use available materials and tools. In addition, emphasis is placed on actions that generate returns in the short term. The application of the feasibility matrix identifies only one action in accordance with these criteria. The action indicated by the matrix restricts the traffic of trucks through thefleet management system. Equations(1) and (2)indicate that the traffic volume is the main factor contributing to the diesel consumption. The pit operationalization aims to maxi-mize ore exploitation with less waste removal and the shortest haul distance between the mining faces and destinations (Sousa et al., Fig. 7.Graph of residuals versusfitted values for the haul road AB.
Fig. 8.Graph of residuals versus observation order for the haul road AB.
2012). In the mining company studied, both pit development and the ore bench faces are concentrated in a few areas. Regarding the position of the mining areas, many exploitation faces use the same haul road. Haulage is carried out via the haul road that provides the shortest distance to the point of dumping. The application of this rule leads to heavy traffic by trucks in some places during the production cycle. The main paths of oreflow and wasteflow are, respectively, the haul roads AB and CD. Thus, these paths represent the roads that have the highest traffic volume. Therefore, as can be seen inFig. 1, point B is surrounded by the main ore faces and point C, the main waste removal area. The fleet management system promotes dynamic allocation of haul trucks by controlling queue times, load equipment idleness, and other variables. This system is also able to consider restrictions for haul operations. These re-strictions must follow some criteria where the objective is to restrict some of the haul trucks to certain mining faces and thus reduce the traffic volume without reducing productivity. The cur-rent study analysed the fuel consumption behaviour of mechanical trucks. However, the mining company studied also has electro-mechanical trucks. Bothfleets operate at all mining faces. As these haul trucks have different constructive aspects regarding energy consumption, it is necessary to measure whether these character-istics justify a variation in performance under specific conditions. If different results are detected for eachfleet, the analysed condition can become a constraint. So it is possible to achieve reduced con-sumption by reducing the traffic volume and the allocation of haul trucks under the most favourable conditions.
4. Results and discussion
The registration of a restriction by thefleet management system needs to be validated by technical criteria. It is necessary to identify the operating conditions that have an advantage in the energy performance of each of the transportfleets. Thefleets of mechan-ical and electromechanmechan-ical trucks are of similar size and age. The payload and gross vehicle weight show variations between 1% and 2%. Therefore, both truck types have been considered to have similar capacities for the scope of this study. This feature applies to individual trucks or groups of equipments. Electromechanical trucks have a system that transforms part of the mechanical energy into electrical energy. This electrical energy is converted back into mechanical energy to assist the diesel engine in equipment trac-tion. Mechanical trucks have traction generated only by burning of diesel. Considering the constructive differences between the two
fleets, tests subjecting them to each existing grade condition in the mining area were carried out. Based on the test result, there is the possibility to design a restriction through the dispatch system.
The roads AB and CD, illustrated inFigs. 2 and 3, represent the most commonly used routes in the mining area. The road AB con-nects one of the main ore faces to the primary crushing, while the road CD is the route of one of the main areas of waste removal. The
road AB has favourable ramps because the loaded trucks go down. The road CD requires trucks to travel on unfavourable ramps. During this route, the loaded trucks must to rise up the ramp. Table 5shows the specific fuel consumption of different truckfleets submitted to different ramp conditions. Measurements were per-formed for two weeks and used 11 trucks from eachfleet.
Table 5shows that the mechanical and electromechanical trucks move similar masses of ore and waste. Over 240 cycles were per-formed for each route, representing a significant population for assessment. The tests relied on strict control of traffic segregation through thefleet management system with the aim of reducing or eliminating simultaneous traffic of bothfleets on the same route. This means that during the performance measurements of afleet on route AB, the other fleet has travelled only on route CD. The results indicate that specific fuel consumption for mechanical trucks on route AB is 5.8% lower. The ramps of route AB were favourable for the twofleets. On the other hand, the electrome-chanical trucks on route CD, where the ramps are unfavourable, achieved 7.4% lower fuel consumption. The results show that the electrical energy generated by electromechanical trucks assists on unfavourable ramps. Because the equipment uses this extra component in its traction, the diesel engine has reduced con-sumption. Mechanical trucks do not store energy for use on harsh profiles but have more efficient engines on favourable ramps. The results are satisfactory and should be implemented as a perma-nently active restriction in thefleet management system. This de-mand is required for validation of the good results obtained in tests on an industrial scale. Thus, within two months the restriction was registered in thefleet management system. That means the system gave priority to programming routes with favourable profiles for mechanical trucks. On the other hand, the system also prioritized the programming routes with unfavourable profile for electrome-chanical trucks.Table 6shows the results obtained during thefirst two months of operation restrictions on the fleet management system. A background was adopted for the average monthly con-sumption and the average monthly production of the last 12 months, which generates the standard specific consumption for the evaluatedfleets. The standard specific fuel consumption of each
fleet was compared to that of the two following months.
The results obtained after activation of the restriction in thefleet management system confirmed the reduction achieved in the tests. According to Shafiee and Topal (2012), operational routines of proven efficiency can be automatically applied with software development solutions. Thefirst month of operation represented a period of adjustment, checking, and monitoring of thefleet man-agement system. The monitoring routine should be extended for another month with information shift by shift. During the second month the system applied the restriction with stability and the dynamic allocation of trucks worked automatically. After the adaptation period, the reduction of diesel consumption by me-chanical trucks exceeded the test results and reached 10%. Table 4
Feasibility matrix applied to identify opportunities for the reduction of fuel consumption.
Variable Practical actions Feasibility Justification
Traffic volume Traffic restrictions: preferred operation on more efficient haul routes Feasible Restrictions: Fleet management system Pavement
material
Improve the regravelling frequency Unfeasible Operational restrictions:fleet and headcount
Motor graders Levelling in low-traffic periods Unfeasible Operational restrictions:fleet and headcount
FI Reduce the friable itabirite mass in the regravelling. An excessive amount generates dust/poor visibility
Unfeasible Suitable material for regravelling/high availability
Laterite Reduce the laterite mass in the regravelling. Unfeasible Reduces the generation of dust/high
availability
CI Increase the compact itabirite mass in the regravelling. Unfeasible Low availability
Reduction of fuel consumption by electromechanical trucks remained stable at around 4% during the two months of assisted operation.
The acknowledgement of the gains from segregation strengthens the validity of the statistical analysis dedicated to measuring the influence of the human factor. Performance tests have controlled conditions and suitable operators who can perform the tests in accordance with the scope of the study. In an opera-tional environment, operators with various skill levels are observed in simultaneous activity, the cycle breaks occur for several reasons. At industrial scale, multiple events can interrupt a cycle, such as unscheduled maintenance, weather conditions, and operational assistance. Even at increased scale, the results were confirmed and validate that the influence of the human factor on fuel consumption is insignificant.
No variable linked to road conditions appears as the main component influencing fuel consumption. However, there is a strong correlation between road conditions and fuel consumption. In the studied mine the traffic volume was identified as the main factor contributing to the diesel consumption. This is supported by Table 3, where the stepwise regression identified high correlations in the first round. However, diesel consumption is satisfactorily explained only when considering hours of road surface mainte-nance, material type, and mass of wearing-course materials for road maintenance and construction. The materials most frequently used on the surfaces of roads are hard gravel, crushed rock, and mixtures of different lithologies with complementary characteris-tics (Thompson and Visser, 2006). Analysing Equations(1) and (2), the variablesCI,FI, andLateriteconfirm the use of lithologies such as compact itabirites, friable itabirites, and laterites in the road surface. This practice depends on the availability of these materials near the mine in order to control costs and ensures appropriate conditions for traffic (Thompson and Visser, 2006).
5. Conclusions
The application of statistical analysis tools and modelling tech-niques to mining proved to be an effective alternative in the management of operational costs. The developed model identified critical points in the production process and also ranked each variable in order of priority. This result optimizes resources and efforts to lock deviations and losses in the process. In an economic environment where the control and reduction of operational costs is becoming key to organizations remaining in the market, this method provides a relevant contribution. Because fuel
consumption is directly related to cost control in the mining in-dustry, the goal of this study has been reached with the validation of the model. The implementation of this method in the mining operation routine using available resources and without large in-vestments also represents a breakthrough for the industry.
Among the results achieved is the reduction of fuel consumption by the mechanical and electromechanical haul trucks. The reduc-tion in fuel consumpreduc-tion reached 10% for thefleet of mechanical trucks and 4% for the electromechanical trucks. This is a reduction greater than that achieved by other mines cited during the study, where the application of similar techniques represented an average 6% reduction in fuel consumption. This advantage is mainly attributed to the efficiency of the fleet management system covering all mining equipment. The method proved to be valid and applicable to other mining enterprises of all sizes since it is a suitable tool for the identification and prioritization of points that are critical for operating costs. The basic requirement for the implementation of this model in other mines is the availability of data for modelling. Afleet management system is recommended because it provides more precision to the study. In addition, each mine has a variable group with the greatest influence on fuel consumption.
Complementing this research, a regular reassessment of such results is necessary in order to check the behaviour of the variables across the depreciation of thefleet. Over time the equipment may show changes in performance standards. Another aspect that must be assessed is the applicability of alternative equipment to mining operations. As the mineral production volume has shown succes-sive increases in recent years, some enterprises seek to increase the size of the equipment to dilute costs. However, this practice is labour-intensive and can generate safety hazards in operations. Nevertheless there is a need for further studies of alternative equipment and processes in mining operations. The aim of the new studies is to maintain production levels with increased productiv-ity, energy efficiency, and safety and to improve the environmental performance.
Acknowledgements
The authors would like to thank CNPq, CAPES, and FAPESP, the scientific research funding institutions that supported this research. The authors also would like to thank MICROMINE for their sponsorship and technical support.
Table 5
Performance test on the haul roads AB and CD.
Truck type Load point Dump Production (t) Fuel consumed (l) Specific fuel consumption (l/t)
Mechanical mining trucks A B 79,336 24,914 0.314
C D 57,984 21,747 0.375
Electromechanical trucks A B 79,560 26,547 0.333
C D 60,480 20,984 0.347
Table 6
Fuel consumption after the activation of the restriction at industrial scale.
Truck type Period Fuel consumption (l) Production (t) Specific fuel consumption (l/t) Reduction (%)
Mechanical mining trucks Monthly average 384,350 1,142,653 0.336
First month 376,291 1,169,307 0.322 4.2%
Second month 504,447 1,668,003 0.302 10.1%
Electromechanical trucks Monthly average 448,595 1,162,437 0.386
First month 409,271 1,108,061 0.369 4.4%
References
Australian Government, 2010. Analyses of Diesel for Mine Haul and Transport Operations, A Case Study. Department of Resources, Energy and Tourism, Australia. http://eex.gov.au/fi les/2014/06/Analyses-of-Diesel-Use-for-Mine-Haul-and-Transport-Operations.pdf(accessed 02.07.15.).
Bozorgebrahimi, E., Hall, R.A., Blackwell, G.H., 2003. Sizing equipment for open pit miningea review of critical parameters. Min. Technol. 112, A171eA179. Curry, J.A., Ismay, M.J.L., Jameson, G.J., 2014. Mine operating costs and the potential
impacts of energy and grinding. Min. Eng. 56, 70e80.
Devore, J.L., 2000. Probability and Statistics for Engineering and the Sciences,fifth ed. Duxbury, Pacific Grove.
Gomes, R.B., De Tomi, G., Assis, P.S., 2015. Impact of quality of iron ore lumps on sustainability of mining operations in the Quadrilatero Ferrífero area. Min. Eng. 70, 201e206.
Levesque, M., Millar, D., Paraszczac, J., 2014. Energy and miningethe home truths. J. Clean. Product. 84, 233e255.
Montgomery, D.C., Runger, G.C., 2007. Applied Statistics and Probability for
Engineers, fourth ed. John Wiley&Sons, Phoenix.
Motlogelwa, O.G., Minnitt, R.C.A., 2013. Optimization of diesel usage at uitvlugt mine. J. S. Afr. Inst. Min. Metall. 113 (4), 345e349.
Nader, B., de tomi, G., Passos, A.O., 2012. Key performance indicators and the mineral value chain integration. REM Rev. Esc. Minas 65 (4), 537e542. Oskouei, M.A., Awuah-Offei, K., 2014. Statistical methods for evaluating the effect of
operators on energy efficiency of mining machines. Min. Technol. 123 (4), 175e182.
Shafiee, S., Topal, E., 2012. New approach for estimating total mining costs in surface coal mines. Min. Technol. 121 (3), 109e116.
Sousa, L.M.L.S., Filho, W.L.O., Lima, H.M., 2012. Haul roads structural design in open pit mines. REM Rev. Esc. Minas 65 (2), 279e284.
Thompson, R.J., Visser, A.T., 2000. The functional design of surface mine haul roads. J. S. Afr. Inst. Min. Metall. 100 (3), 169e180.
Thompson, R.J., Visser, A.T., 2003. Mine haul road maintenance management sys-tems. J. S. Afr. Inst. Min. Metall. 103 (5), 303e312.