DEPARTAMENTO DE ENGENHARIA DE TELEINFORM ´ATICA
PROGRAMA DE P ´OS-GRADUAC¸ ˜AO EM ENGENHARIA DE TELEINFORM ´ATICA
THOMAZ EDSON VELOSO DA SILVA
EDUCOMETRICS:
FROM THEORY TO APPLICATION
DEPARTMENT OF FOOD SCIENCE
THOMAZ EDSON VELOSO DA SILVA
EDUCOMETRICS:
FROM THEORY TO APPLICATION
EDUCOMETRICS:
FROM THEORY TO APPLICATIONS
Tese apresentada ao Programa de P´os-gradua¸c˜ao em Engenharia de Teleinform´atica do Departamento de Engenharia de Telein-form´atica da Universidade Federal do Cear´a, como parte dos requisitos necess´arios para a obten¸c˜ao do t´ıtulo de Doutor em Engenharia.
´
Area de concentra¸c˜ao: Sinais e Sistemas.
Orientador: Prof. Dr. Jo˜ao C´esar Moura Mota (UFC)
Orientador: Prof. Dr. Rasmus Bro (UCPH) Coorientador: Prof. Dr. Wagner Bandeira Andriola
Coorientador: Prof. Dr. Andr´e Lima F´errer de Almeida
FORTALEZA
EDUCOMETRICS:
FROM THEORY TO APPLICATIONS
A doctoral thesis submitted in partial fulfill-ment of the requirefulfill-ments for the degree of Doctor of Philosophy (PhD) from the PhD School of Science at the University of Copen-hagen.
Supervisor: Professor Jo˜ao C´esar Moura Mo-ta (UFC)
Supervisor: Professor Rasmus Bro (UCPH) Co-supervisor: Associate Professor Wagner Bandeira Andriola
Co-supervisor: Adjunct Professor Andr´e Li-ma F´errer de Almeida
FORTALEZA
Gerada automaticamente pelo módulo Catalog, mediante os dados fornecidos pelo(a) autor(a)
S584e Silva, Thomaz Edson Veloso da.
Educometrics: from theory to application / Thomaz Edson Veloso da Silva. – 2017. 82 f. : il. color.
Tese (doutorado) – Universidade Federal do Ceará, Centro de Tecnologia, Programa de Pós-Graduação em Engenharia de Teleinformática, Fortaleza, 2017.
Orientação: Prof. Dr. João César Moura Mota. Coorientação: Prof. Dr. Wagner Bandeira Andriola.
1. Educometrics. 2. Multivariate statistics. 3. Multilinear analysis. 4. Educational evaluation. 5. Data analysis. I. Título.
EDUCOMETRICS:
FROM THEORY TO APPLICATION
Tese apresentada ao Programa de P´os-gradua¸c˜ao em Engenharia de Teleinform´atica do Departamento de Engenharia de Telein-form´atica da Universidade Federal do Cear´a, como parte dos requisitos necess´arios para a obten¸c˜ao do t´ıtulo de Doutor em Engenharia.
´
Area de concentra¸c˜ao: Sinais e Sistemas.
Aprovada em: 07 / 12 / 2017.
BANCA EXAMINADORA
Prof. Dr. Jo˜ao C´esar Moura Mota (Orientador) Universidade Federal do Cear´a (UFC)
Prof. Dr. Jos´e Manuel Amigo Rubio University of Copenhagen (UCPH)
Prof. Dr. F´atima N. Sombra de Medeiros Universidade Federal do Cear´a (UFC)
Prof. Dr. Charles Casimiro Cavalcante Universidade Federal do Cear´a (UFC)
Prof. Dr. Jo˜ao Marcos Travassos Romano Universidade Estadual de Campinas (Unicamp)
Prof. Dr. Renato da Rocha Lopes
Universidade Estadual de Campinas (Unicamp)
Prof. Dr. Andr´e Lima F´errer de Almeida Universidade Federal do Cear´a (UFC)
First of all, I would like to thank God for the opportunity given to me, the greatest challenge I have faced in my professional career so far. I thank my parents, Virgilio Edson Amaral da Silva and Edna Denize Veloso da Silva, for all the patience, affection and dedication that has been given to me throughout my life and especially in these almost five years of doctorate’s degree. To my brother and sister, Diego Veloso da Silva and Nayra Veloso da Silva, thank you so much for the encouragement given in moments of doubts and for all the effort to keep me on the right track.
I also would like to thank Professors Jo˜ao C´esar and Rasmus Bro for the briliant supervision, giving me very good insights of my work, as well as Professors Wag-ner Andriola and Andr´e F´errer for their support in educational evaluation and tensor decompositions fields, respectively.
”Science is not only a disciple of reason but, also, one of romance and passion.”
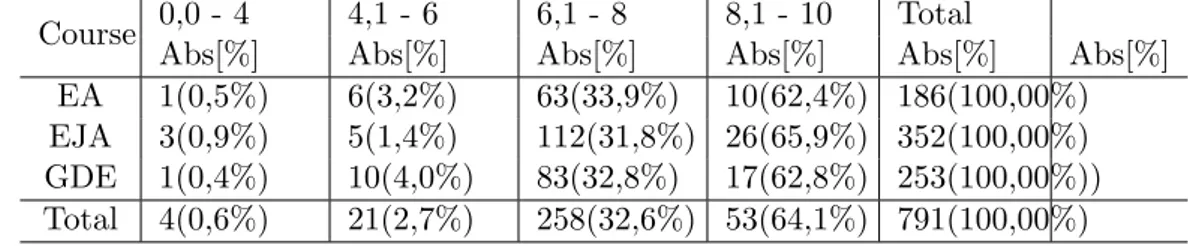
Atualmente, no contexto educacional, foi dada ˆenfase `a coleta e an´alise de dados por cientistas de diversas ´areas do conhecimento, tais como: psicologia e economia. Esses profissionais analisam dados e seus resultados podem ser usados, por exemplo, para aju-dar na tomada de decis˜oes de uma pol´ıtica p´ublica. No entanto, as medidas educacionais tornaram-se muito populares e podem abranger toda a multidimensionalidade contida no processo educacional, desde o ensino e a aprendizagem at´e a intera¸c˜ao social na sala de aula. A compreens˜ao da an´alise de dados em uma sala de aula precisa ser feita por professores e pedagogos que conhe¸cam exatamente o significado emp´ırico da variabilidade de uma determinada vari´avel medida. Nesse sentido, esta tese conceitua, discute, define e aplica a Educometria, a qual se reconhece ser uma ´area de conhecimento que faz uso de modelos de estat´ıstica multivari´avel para an´alise de dados relacionados a contextos e-ducacionais. Depois de estabelecer o conceito de Educometria, aplicamos alguns modelos matem´aticos no contexto da avalia¸c˜ao do contexto no ensino `a distˆancia. Uma amostra de 791 alunos respondeu o question´ario QEOn atualizado para trˆes cursos e a estrutura fatorial do question´ario foi v´alida a partir da aplica¸c˜ao da an´alise fatorial. A an´alise dos componentes principais e o Parafac2, sendo modelos bilinear e multilinear, respectiva-mente, foram aplicados e capazes de identificar comportamentos intr´ınsecos em rela¸c˜ao `as 34 assertivas contidas no question´ario QEOn. Como conclus˜ao, a aplica¸c˜ao de modelos que permitem a interven¸c˜ao pedag´ogica na sala de aula tendo em vista que essa a¸c˜ao ´e a chave do suporte fornecido pela educometria desenvolvida ao longo desta tese.
Nowadays, in the educational context, emphasis has been placed on the collection and analysis of data by scientists from several areas of knowledge, such as: psychology and economics. These professionals analyze data and their results can be used, for example, to aid in the decision making of a public policy. However, educational measures have become very popular and can encompass all the multidimensionality contained in the educational process, from teaching and learning to social interaction in the classroom. Understanding of data analysis in a classroom needs to be done by teachers and pedagogues who know exactly the empirical significance of the variability of a particular measured variable. In this sense, this thesis conceptualizes, discusses, defines and applies Educometrics, which is recognized as an area of knowledge that makes use of multivariate statistical models to analyze data related to educational contexts. After establishing the concept of Educomet-rics, we apply some mathematical models in the learning context of teaching in distance learning. A sample of 791 students answered the updated QEOn questionnaire for three courses and the factorial structure of the questionnaire was valid from the application of factorial analysis. The principal component analysis and the Parafac2, bilinear and multilinear models, respectively, were applied and able to identify intrinsic behaviors in relation to the 34 statements contained in the QEOn questionnaire. As a conclusion, the application of models that allow pedagogical intervention in the classroom as it is the key of the support provided by the educometrics developed throughout this thesis.
Figure 1 – Educometrics organizational concept. . . 20
Figure 2 – Unfolding of a tensor in each mode. . . 41
Figure 3 – Parafac pictorical representation. . . 42
Figure 4 – Tucker3 pictorical representation. . . 43
Figure 5 – Parafac2 pictorical representation. . . 44
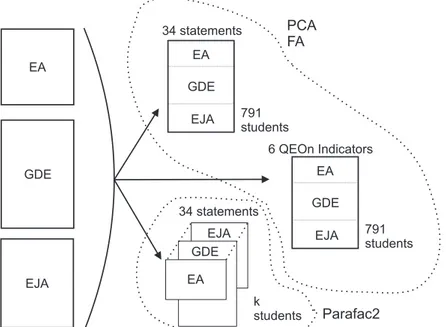
Figure 6 – Data organization by the PCA and FA models and the Parafac2 model. . 53
Figure 7 – Scree plot . . . 58
Figure 8 – Score plot - Age Range - 6 components . . . 59
Figure 9 – Score plot - Courses - 6 components. . . 60
Figure 10 –Score plot - Blended courses that have been taken by the students so far - 6 components. . . 60
Figure 11 –Score plot - Gender - 6 components. . . 61
Figure 12 –Score plot - Range of the final grade obtained by the students - 6 com-ponents. . . 61
Figure 13 –Loading plots - 6 components . . . 62
Figure 14 –Loading triplot - PC1× PC2 ×PC3 . . . 63
Figure 15 –Scree plot and variance explained - QEOn indicators. . . 64
Figure 16 –Score plot with previous labels obtained. . . 65
Figure 17 –Loading plot - QEOn indicators. . . 66
Figure 18 –Corcondia 3 components. . . 67
Figure 19 –Variation per component. . . 67
Figure 20 –Residual sum square by each mode . . . 68
Figure 21 –Loading Mode1 . . . 69
Figure 22 –Loading Mode2 . . . 70
Table 1 – Characterizing the gender in the courses analyzed. . . 48 Table 2 – Characterizing the age range in the courses analyzed. . . 48 Table 3 – Characterizing how many blended courses each students have taken. . . . 49 Table 4 – Characterizing the obtained grade (range) by the students in the courses
analyzed . . . 49 Table 5 – QEOn Questionnaire in its original version (tested) and the english version. 50 Table 6 – KMO and Bartllet’s tests. . . 54 Table 7 – Eigenvalues and Variance Explained. . . 55 Table 8 – Factor Analysis with Equamax Rotation. Commonalities and Cronbach’s
CAPES Coordination for Improvement of Higher Education Personnel CFA Confirmatory Factor Analysis
COMFOR Management Committee for Initial and Continuing Education of Basic Educational Professionals
CONAFOR Management Committee of the National Policy for Initial and Continuing Education of Basic Educational Professionals
EA Environmental Education
EFA Exploratory Factor Analysis EJA Youth and Adult Education
FA Factor Analysis
FNDE and the National Fund for the Development of Education GDE Gender and Diversity in School
IFES Federal Institutions of Higher Education
IFET Federal Institutions of Professional, Scientific and Technological Education MEC Ministry of Education
PC Principal Component
PCA Principal Component Analysis
QEOn Quality of Distance Education Teaching Questionnaire
RM Reference Matrix
RMSECV Root Mean Square Error of Cross-Validation SEEQ Students’ Evaluation of Educational Quality SET Students’ Evaluation of Teaching
SINAES National System for the Evaluation of Higuer Education SVD Singular Value Decomposition
Scalar: a Lower-case letters.
Vector: a Boldface lower-case letters.
Matrix: A Boldface capital letters.
Transpose: aT,AT Transpose of a and A, respectively.
Tensor: X Underline boldface capital letters.
Kronnecker Product: ⊗ Hadammard Product: ⋄ Khatri-Rao Product: ⊙
Outer product: ◦
1 INTRODUCTION . . . 18
1.1 General Context . . . 18
1.2 What is Educometrics? . . . 19
1.3 Contributions . . . 21
1.4 List of Publications . . . 21
1.4.1 Edited book . . . 21
1.4.2 Book chapter . . . 21
1.4.3 Journal papers . . . 22
1.4.4 Conference papers . . . 22
1.4.5 Other publications by the author . . . 23
1.5 Organization . . . 24
2 EDUCATIONAL MEASUREMENTS . . . 25
2.1 Educational Evaluation and Assessment . . . 25
2.2 Measurements in Education . . . 26
2.2.1 Learning Context . . . 28
2.2.2 Learning Outcomes . . . 29
2.3 Assessment in Distance Education . . . 31
2.4 Summary . . . 31
3 ”METRICS” MODELS: AN OVERVIEW . . . 32
3.1 Theoretical Discussion . . . 32
3.2 Multivariate Analysis . . . 33
3.3 Multidimensional Analysis . . . 34
3.4 General Models in Data Analytics for Education . . . 34
3.4.1 Multivariate Models . . . 35
3.4.1.1 Factorial Analysis model . . . 35
3.4.1.2 Principal Component Analysis Model . . . 36
3.4.2.1.2 Unfolding . . . 40
3.4.2.2 Parafac . . . 41
3.4.2.3 Tucker3 . . . 42
3.4.2.4 Parafac2 . . . 44
3.5 Summary . . . 45
4 EDUCOMETRICS ON TEACHING ASSESSMENT IN DIS-TANCE EDUCATION . . . 46
4.1 Context of Application . . . 46
4.2 Methods and Materials . . . 47
4.2.1 Exploratory Factor Analysis, Principal Component Analysis and Parafac2 . . . 47
4.2.2 Sampling . . . 47
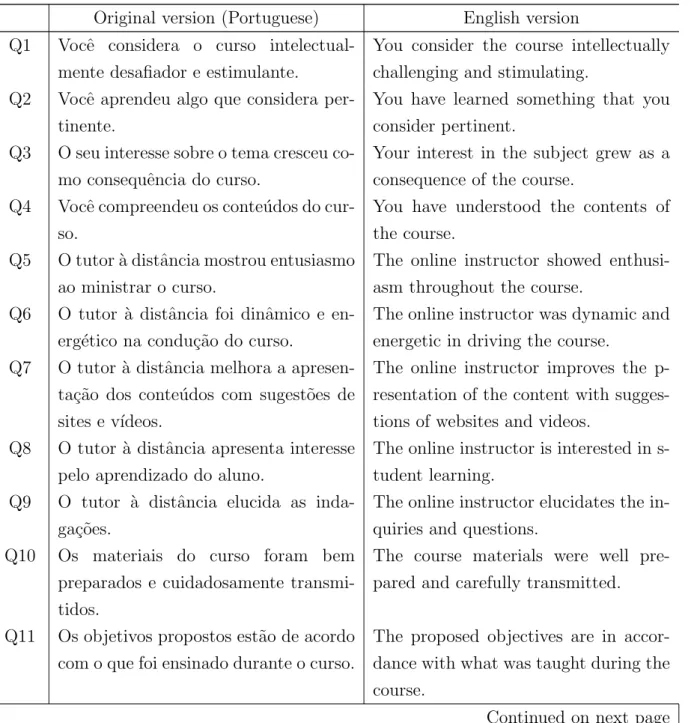
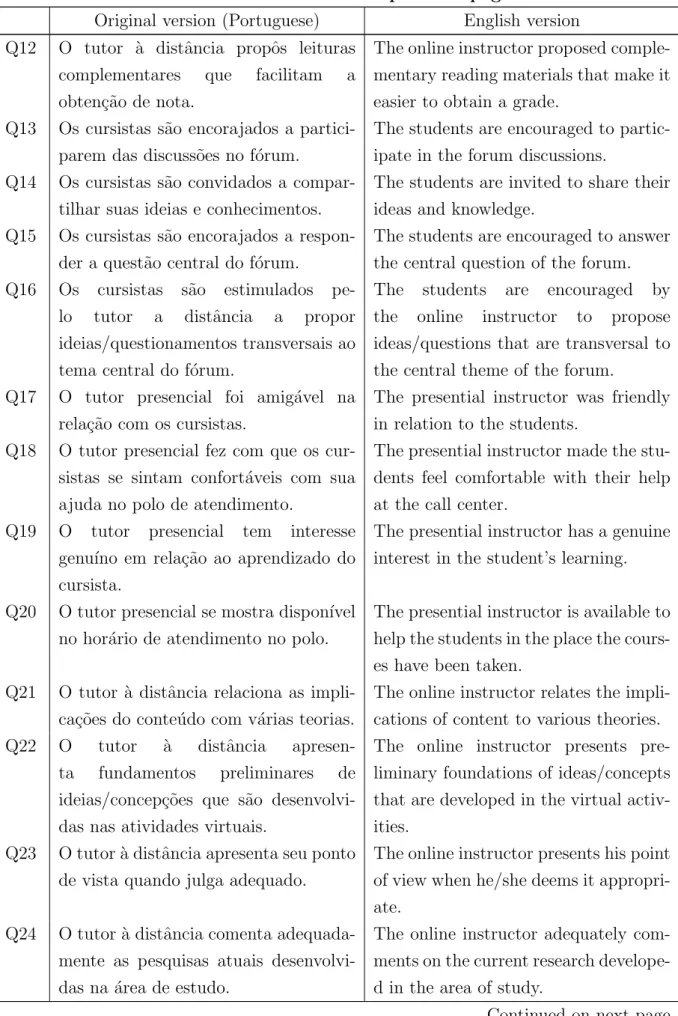
4.2.3 Updated QEOn Questionnaire . . . 49
4.2.4 Data collection . . . 52
4.3 Summary . . . 53
5 RESULTS . . . 54
5.1 Factor Analysis . . . 54
5.1.1 KMO and Bartllet’s tests . . . 54
5.1.2 Selecting the Number of Components . . . 55
5.1.3 Commonalities . . . 55
5.1.4 Reliability Analysis . . . 56
5.1.5 Validating the Updated QEOn Questionnaire . . . 56
5.2 Principal Component Analysis on Statements . . . 57
5.2.1 Scree Plot - On Statements . . . 58
5.2.2 Score Plots . . . 58
5.2.3 Loading Plots . . . 62
5.3.3 Loading Plot . . . 64
5.4 Parafac2 . . . 66
5.4.1 Model Order Selection . . . 66
5.4.2 Loadings . . . 68
5.5 Are these results reliable according to the literature? . . . 69
5.6 Summary . . . 71
6 FINAL REMARKS AND PERSPECTIVES . . . 73
6.1 Future perspectives . . . 74
1 INTRODUCTION
In this chapter we will introduce this thesis, highlighting some early conceptions of Ed-ucation, as well as the comprehension of how this discipline is related to others. This association will be made, especially, with educational psychology which brings the con-cept of measures in the evaluative context, being a key part in the development of this manuscript. The problem of data use and analysis in the educational context will also be addressed, assigning indicatives for the development of a field of investigation called Educometrics. This thesis originates some scientific publications that are also highlighted in this chapter. Finally, the structure of the thesis will be presented in order to give the reader a general understanding of the themes discussed throughout this study.
1.1 General Context
Education is a multidisciplinary discipline that aggregates concepts and re-lations of social, behavioral and political sciences and also neuroscience and pedagogy. ”Educate” comes from the Latin educare, in turn linked to educere, verb composed of the prefix ex (outside) + ducere (lead), and literally means ’lead for’ be, preparing the individual for the world. With the joining of several sciences, education ends up having a hyper hybrid context with nuances and characteristics related to each one of the afore-mentioned sciences. Directly, education can be understood as a process that facilitates the acquisition of knowledge and learning trough teaching methodology and didactics. Thus, among the possible methods to formally educate a person based on the curriculum proposed, teaching, storytelling and discussion can be highlighted.
Between 1913-1914, Edward L. Thorndike wrote the three-volume ”Education-al Psychology” and the books were based on experiment”Education-al and statistics an”Education-alysis (Lorge, 1949). Considered the ”father of educational measurements”, Thorndike opened a new branch of investigation at the beginning of the XX century. Nowadays, we know that the data measured at the educational context can become information and knowledge, but only if it is well handled and collected by specialists. It is also important to high-light that realible data is required for data analysis, no further analysis can be done if we have poor/inaccurate quality data. In this sense, educational research has performed experiments and procedures, especially with the application of psychometric tools that were developed in the behavioral sciences, supporting, e.g., the personality analysis and intelligence quotient tests by assisted data collection.
textbook effectiveness and so on. Researches associated with each of these topics are important but still needs to be integrated. Marsh and Bailey (1993) emphasize that education is a multidimensional phenomenon and needs to be analyzed and evaluated as a whole, attesting that evaluation made only by parts of this process is precarious and weakly performed.
Searching for robust and new statistical methods to apply in education we faced a paper published by Tepper (2006), and the following question comes up at the end of it: ”Is Educometrics a new field?”. Then, an intriguing question was raised: What would be educometrics about?
To the best of our knowledge, the first time the term ”educometrics” came up was in a book written by Lulla (1980). Although the title of this book can be easily found on the internet, we couldn’t access the manuscript itself even by request to the editor or library. Since then, no further discussion has been conducted in order to establish educometrics as a field of investigation.
This thesis is based on an overlapping of educational evaluation and applied statistics so called Educometrics. Statistical tools present in other ”metrics” will be used to analyze data related to the quality of teaching in blended learning courses.
1.2 What is Educometrics?
Educometrics can be undertood as an application of socio- , econo- and psycho-metrics tools as well as the basic statistical applications in educational contexts. Based on this concept, we may consider any interrelational and measurable construct among teaching, learning and the educational context, both quantitative or qualitative, as an input for educometrics analysis, having the teacher/professor/instructor, the students and the educational environment as part of an integrated process.
An example of application of educometrics is the analysis of the grades ob-tained by the students in school evaluations. These grades bring with them the infor-mation about the knowledge learned by the student in a given subject. Furthermore, analysing the grades, the teacher understands the skills and competences learned by the students. Then we can ask two questions: Is there any (non-)linear relationship between the grade obtained and the teaching method? How do we measure this relationship? We believe that educometrics is the key to thinking deeper and more intriguing questions that can be, for example, answered from the data collected in the classroom.
EDUCOMETRICS
LEARNING OUTCOMES (LO)
LEARNING CONTEXT (LC)
LEARNING OBJECTIVES
DATA COLLECTION
STATISTICAL MODELING
PATTERNS/BEHAVIOR
TEACHER
STUDENTS
ENVIRONMENT GRADE
FEEDBACK
SEVERAL DIFFERENT
SOURCES
PEDAGOGICAL
INTERVENTIONS
TEACHER
STUDENTS
of three blended learning courses are going to be analyzed using classical and advanced statistical thecniques in order to understand possible intrinsic information into the data collected.
Establishing relationships, finding, or proposing explanatory laws, is the main purpose of science. For this, it is necessary to control, manipulate and measure the variables that are considered relevant for the comprehension of the phenomenon. There are many issues on how the information obtained can be translated into knowledge, especially when it comes from a very complex and multidimensional scenario, such as education.
1.3 Contributions
The major contributions of this thesis has been summarized as follows:
• Understand the intrinsic conceptual relations obtained by an educational evaluation and assessment and build up a bridge between educational concepts and the find-ings of applied multivariate statistics well establishing the Educometrics’ concept, especially filling in the gaps non-covered by educational psychologists;
• Develop an assessment questionnaire for the evaluation of teaching quality on blend-ed learning context basblend-ed on the Students’ Evaluation of Teaching (SET) method-ology;
• Make use multidimensional and multivariate tools to comprehend how the use of educometrics would benefit the understanding of intrinsic patterns among bi- and multi-linear data.
1.4 List of Publications
Follow the list of publications of this thesis and of some scientific collaboration throughtout the doctorate program.
1.4.1 Edited book
Thomaz Edson Veloso da Silva, Germano de Oliveira Ribeiro, Ismar Fran-go Silveira, Francisco Herbert Lima Vasconcelos: Assessment and Evaluation in Online Education: Theory and Applications (in portuguese). 1 12/2015; Editora Imprima., IS-BN: 978-85-64778-24-5.
DOI:10.13140/RG.2.1.3566.4724
1.4.2 Book chapter
(in portuguese). Avalia¸c˜ao em EAD: Teoria e Pr´atica, edited by Thomaz Edson Veloso da Silva, Germano de Oliveira Ribeiro, Ismar Frango Silveira, Francisco Herbert Lima Vasconcelos, 12/2015; Editora Imprima., ISBN: 978-85-64778-24-5.
DOI:10.13140/RG.2.1.1469.3202
1.4.3 Journal papers
Thomaz Edson Veloso da Silva, Jo˜ao C´esar Moura Mota, Wagner Ban-deira Andriola, Rasmus Bro, Andr´e Lima F´errer de Almeida: Educometrics: Principles, Issues and Possible Applications. Scientometrics. Submitted. September, 2017.
Thomaz Edson Veloso da Silva, Francisco Herbert Lima Vasconvelos: S-tudents’ Evaluation of Teaching (SET) Methodology: Possibilities for Bleended Learning Education (in portuguese). Revista Sustinere. Accepted for publication. December, 2017.
Thomaz Edson Veloso da Silva, Germano de Oliveira Ribeiro, Albano Oliveira Nunes, Francisco Herbert Lima Vasconvelos, Wagner Bandeira Andriola, Jo˜ao C´esar Moura Mota: QEOn Questionnaire for Assessing Experiences in Virtual Learning Environments. IEEE Latin America Transactions 05/2017; 15(6):1197 - 1204.
DOI:10.1109/TLA.2017.7932709
1.4.4 Conference papers
Thomaz Edson Veloso da Silva, Jo˜ao C´esar Moura Mota, Wagner Ban-deira Andriola, Andr´e Lima F´errer Almeida: Data Mining for Open Educational Govern-mental Data: The Case Study of Brazilian Higher Education. International Technology, Education and Development Conference; 03/2017.
DOI:10.21125/inted.2017.2211
Germano Oliveira Ribeiro, Thomaz Edson Veloso da Silva, Albano O-liveira Nunes, Francisco Herbert Lima Vasconcelos: Analysing the Influence of External Factor Associated to the Quality of Online Teaching (in portuguese). Proceedings of XXII Workshop de Inform´atica na Escola (WIE 2016), Uberlˆandia; 10/2016.
DOI:10.5753/cbie.wie.2016.101
Thomaz Edson Veloso da Silva, Germano Oliveira Ribeiro, Albano Oliveira Nunes, Francisco Herbert Lima Vasconcelos, Wagner Bandeira Andriola: Assessment of Online Teaching Quality Indicators: A Case Study (in portuguese). Proceeding of Workshops do CBIE 2015, Macei´o-Alagoas; 10/2015.
1.4.5 Other publications by the author
Francisco Herbert Lima Vasconcelos,Thomaz Edson Veloso da Silva, Jo˜ao C´esar Moura Mota: Multilinear Educational Data Analysis for Evaluation of Engineering Education. IEEE Latin America Transactions 11/2015; 13(8).
DOI:10.1109/TLA.2015.7332163
Francisco Herbert Lima Vasconcelos,Thomaz Edson Veloso da Silva, Jo˜ao C´esar Moura Mota: The Context and Outcomes of Learning in Educational Evaluation an Engineering Course. IEEE Latin America Transactions 09/2015; 13(7).
DOI:10.1109/TLA.2015.7273811
Albano Oliveira Nunes,Thomaz Edson Veloso Da Silva, Jo˜ao C´esar Moura Mota, Andr´e Lima F´errer de Almeida, Wagner Bandeira Andriola: Validation of the academic management evaluation instrument based on principal component analysis for engineering and technological courses. Ingenier´ıa e Investigaci´on 07/2015; 34(2).
DOI:10.15446/ing.investig.v35n2.47369
Albano Oliveira Nunes,Thomaz Edson Veloso da Silva, Jo˜ao C´esar Moura Mota, Andr´e Lima F´errer de Almeida, Wagner Bandeira Andriola: Developing an Instru-ment for AssessInstru-ment of Academic ManageInstru-ment in Engineering Courses. IEEE Latin America Transactions 01/2015; 13(1).
DOI:10.1109/TLA.2015.7040657
Katiuscia C. B. Teixeira, Thomaz Edson Veloso da Silva, Jo˜ao C´esar Moura Mota, Nat´alia Cordeiro Barroso, Eduardo V. O. Teixeira: Peer instruction method-ology for linear algebra subject: A case study in an engineering course. 2015 IEEE Fron-tiers in Education Conference, FIE 2015, El Paso; 10/2015.
DOI:10.1109/FIE.2015.7344346
Alberto Lima, Wagner Andriola, Neuman de Souza,Thomaz Edson Veloso da Silva, Zarathon L. Viana: A Mixed Pedagogical Method to Improve Teaching and Learning in Brazilian Computing Area Undergraduate Courses. 2015 IEEE Frontiers in Education Conference, FIE 2015, El Paso; 10/2015.
DOI:10.1109/FIE.2015.7344399
Igor P. da Silva, Alberto S. Lima, Neuman De Souza, Fl´avio R. C. Sousa, Lincoln S. Rocha,Thomaz Edson Veloso da Silva: Improving group decision-making in IT service management by the use of a consensus-based MCDM method. Network Operations and Management Symposium (LANOMS), 2015 Latin American, Jo˜ao Pessoa - Para´ıba; 08/2015.
1.5 Organization
This thesis is structured in six chapters, including the introduction. Following a brief content of each one of the five remaining chapters.
Chapter 2: The main concepts of educational measures and their impacts on some types of educational evaluation will be presented in this chapter, as well as a review of the literature on how this data collection has been carried out over the last few years. Chapter 3: Some statistical models have been widely used in the educational context, the presentation of these models and others that can potentially be used will be shown in this chapter.
Chapter 4: The application context of this thesis, the updated QEOn ques-tionnaire, the audience that compose the analyzed sample and the organization of the data will be presented in this chapter.
Chapter 5: The validation of the updated QEOn questionnaire will be pre-sented in this chapter, making possible a better understanding of the existing relationships between the actors that compose the blended learning courses in the context of the Fed-eral University of Cear´a. Multivariate and multi-linear tools are also applied in order to find intrinsic information hidden in the latent variables.
2 EDUCATIONAL MEASUREMENTS
Educational measures are, for the most part, linked to the collection of data on student achievement. In this chapter, we will work on the concept of educational measure as any measurement associated with the student/learner, both with respect to their learning outcomes and learning context.
2.1 Educational Evaluation and Assessment
One of the scientific fields that re-unites ethical theory of psychological mea-surement and behavioral aspects which includes the measure of characteristics such as knowledge, intellectual, cognitive, attitudes, personality traits and educational evalua-tion is psychometrics. In general, the achievement of such measures is done through the construction and validation of information gathering instruments, such as questionnaires, surveys, tests, personality assessments, among others.
In addition to the field of psychology, psychometrics has also been widely used in educational assessment by obtaining, analyzing and interpreting educational measures and indicators using mathematical tools. However, based on information processing in the branch of cognitive and contextual development, by making them a fundamental part of the analysis and interpretation of ”data collected in educational context” a step further need to be carried by Educometrics. In this way, this research work will be based on its principle of conception.
According to Tyler (2000), educational evaluation and measurement are dis-tinct processes but often based on descriptive analysis with low mathematical formalism. The educational measure is very important in the evaluation process, however the eval-uation can not be limited to the quantitative analysis of the data (Andriola, 1999). In the model proposed by Tyler (2000), the evaluation objectives become key pieces to guide the evaluation process It should be emphasized, therefore, that the evaluation, in general, allows a critical analysis of what is being evaluated, enabling actions that seek to correct errors or to potentiating correctness in the educational process (Andriola, 2001). The educational evaluation is based on a strong description of processes and by its results, without any necessary statistic or probabilistic background.
Among the various forms and objectives of the evaluating act, we highlight the Students’ Evaluation of Teaching (SET), as a methodology of real applicability to improve the quality of the courses in a general way (Romero and Ventura, 2010; Andriola, 2002).
of Educational Quality (SEEQ) questionnaire was developed (Marsh and Bailey, 1993), which aims to measure the nine factors that are considered essential for the evaluation of course quality (Andriola, 2002).
The SEEQ instrument has already been applied in several educational contexts and in various formats (Silvaet al., 2012; Vasconceloset al., 2013; Francoet al., 2013). In all cases, its factor structure was confirmed, generating results that allow the improvement of the quality of the evaluated courses.
Thus, the SET methodology has a great potential to capture information re-lated to the context of students’ learning, allowing the distribution of not direct observed variables in daily life at school and enabling improvement of teaching and learning based on administrative and/or pedagogical intervention.
2.2 Measurements in Education
Hodges and Stanton (2007) and Ryan, Anderson, and Birchler (1980) indi-cate that evaluations in courses, disciplines, curricular components or teaching sessions performed by students are source of concern for the faculty and may lead to displeased s-tudents (Franklin and Theall, 1989). Such attitudes occur because teachers believe, while activities are in progress, assessments can be biased (Eiszler, 2002) (Feldman, 1976). Hence, students are not competent and mature assessors (Ryan, Anderson, and Birchler, 1980; Nasser and Fresko, 2002), and most of the time their opinions are influenced by ex-pectations in relation to their performance and results obtained at the end of the teaching process (Baldwin and Blattner, 2003). These issues lead teachers and managers to ques-tion the general validity of student assessments and their use, as well as their feasibility (Beran, Violato, and Kline, 2007; Ory, 2001) to influence decision making (Sproule, 2000; Ryan, Anderson, and Birchler, 1980; Nasser and Fresko, 2002). However, according to Franklin (2001), the discomfort of teachers with assessments and classifications are relat-ed to the poor quality of their classroom teaching practices. These negative perceptions of assessments may lead teachers to disregard their importance, which may hinder the teaching and development of efforts to improve an activity or discipline, and, according to Aleamoni (1999) and Ory (2001), induces teachers and managers to have misperceptions about course evaluations. Several authors point out that the faculty in general do not consider the evaluation carried out by the students and do not approve the evaluation instruments/questionnaires used (Nasser and Fresko, 2002; Abrami, 2001; Wachtel, 1998; Theall and Franklin, 2001; Centra, 1993)
Other surveys (Beran, Violato, and Kline, 2007; Beranet al., 2005) found that there are teachers who believe that assessment data cannot be used properly by managers academics.
data and find it a useful source of information for decision making (Beran et al., 2005; Campbell and Bozeman, 2008). However, there are others who have concerns about the validity of these results and instruments, and according to Franklin (2001); Abrami (2001), this is due to the lack of knowledge and lack of familiarity with the classification tools and the fundamentals of the research under evaluation. As far as students’ opinion is concerned, there is little research in this regard and is often limited to case studies in institutions (Beran et al., 2005; Campbell and Bozeman, 2008) which indicate how students perceive the process of collecting their opinions as valid and useful feedback. In addition, they also believe that students can be effective evaluators of teaching. However, other authors indicate that students are not always aware of how institutions use the collected data (Wachtel, 1998; Beranet al., 2005; Campbell and Bozeman, 2008), and do not understand the impact that evaluations generate for change and decision-making and also do not believe that their opinion is used and evaluated (Wachtel, 1998), thus making no use of the data collected in the institution.
2.2.1 Learning Context
Researches also point out that the evaluation of efficacy of learning context is multidimensional and some teaching elements can be highlighted, categorized and identi-fied (Algozzineet al., 2004; Marsh and Roche, 1997; Marsh, 1987). The Students’ Evalu-ation of EducEvalu-ational Quality (SEEQ) questionnaire, proposed by Marsh (1987), presents categories of questions about teaching behaviors and if carried out seriously guarantees the evaluation of the teaching effectiveness. This questionnaire is formed by the follow-ing categories: learnfollow-ing/value; teacher enthusiasm; organization; individual relationship; group interaction; range of coverage; the examinations/classification; readings; and the workload/difficulty.
In other works proposed by Braskamp and Ory (1994) and Centra (1993), similar measures of teaching effectiveness have been identified in the assessment system, called the Individual Development and Educational Assessment (IDEA), which includes categories such as course organization and planning, clarity/communication skills, student and teacher interaction and their relationships, difficulty/workload, student grading and exams, and self-assessment.
Another research instrument on the quality of higher education is the Course Perceptions Questionnaire (CPQ) and it was used to measure the experiences of British students. This instrument contained 40 items on eight scales and was proposed by Rams-den (1981) in a survey of 2,208 stuRams-dents in a total of 66 academic departments of en-gineering, physics, economics, psychology, history, and English. A factorial analysis of this questionnaires allowed to identify eight scales of characteristics and highlighted two dimensions, the first referring to the positive evaluation of teaching and programs, and the second referring to the use of formal teaching methods with emphasis on training with professional relevance. According to Gibbs, Habeshaw, and Habeshaw (1988), CPQ could be used for teaching assessment and course evaluation, although the correlations obtained in Ramsden (1981) between students’ perceptions and their approaches to the study were relatively weak. Similar results were found by another researcher (Parsons, 1988) and this raised doubts about the adequacy and validation of CPQ as a research tool (Meyer and Muller, 1990).
From the CPQ, a new revised instrument, called Course Experience Question-naire (CEQ), was also proposed in Ramsden (1991), which aimed to obtain indicators to monitor the performance of teaching quality in academic programs and was used in insti-tutions in Australia (Ramsden, 1991; Linke, 1991). The instrument had 30 items on five scales and aimed to identify different perceptions of the quality dimensions of teaching.
assessments, they rarely actually practice the results of their own ongoing assessments for decision-making. Studies show that the lack of financial resources and the lack of robust mathematical and statistical tools for interpretation, identification of teaching s-trategies and the interpretation of results, generate problems that arise when the results are misunderstood (Beranet al., 2005; Wagenaar, 1995).
An overview of several questionnaires can be found in Richardson (2005).
2.2.2 Learning Outcomes
From another perspective, knowledge assessment activities that express stu-dents’ performance results often have an important influence on learning. The way in which the evaluation is developed and applied by the teacher and the results or expecta-tions of the students, can generate different learning profiles (Sternberg and Zhang, 2005). Struyven, Dochy, and Janssens (2005) argue that the way in which assessment is carried out in higher education has an important influence on student learning. In this context, a student’s expectation regarding the evaluation methodologies or procedures that will be used by the teachers in a course, establish a direct relation of how students deal with academic tasks and get ready for exams, assignments, tests and other activities in which they will be evaluated. Equally, strategies and procedures regarding how to study and learning itself on the part of the students are generally strongly influenced by evaluation experiences provided previously with appropriate feedback.
In education, defining what learning goals we want to achieve means structur-ing the educational process in ways that allow for changes in thinkstructur-ing and behavior. The educator may have expectations and guidelines for the teaching process that are not clear but will be part of the learning assessment process. Learning assessment is a key factor in determining whether learning objectives have been achieved. It is clear that it is easier to achieve goals when they are well defined, but it is more difficult for students to reach the level of cognitive development because they do not know exactly what is expected of them during and after the teaching process. Learning occurs simultaneously and interactively in, at least, three main domains: affective, cognitive and psycho-motor.
1981, 1991).
Both teachers and their modes of assessment and consequent student perfor-mance influence learning approaches; however, depending on the learning context they may be modifiable (Struyven, Dochy, and Janssens, 2005). In this context, if an insti-tution wants to develop critical and creative thinking for its students and increase its problem-solving capacity, it must devise structural change. This change must take into account not only a new design of its curricular structure, contents of disciplines, or even the competences and abilities of the area under study or of the pedagogical proposal of the course, but broad aspects that involve classroom methodologies and the development of scientific and technological skills and mainly evaluation practices of excellence that reflect not only on students’ learning but also the effectiveness of the teaching done by the teachers in the opinion of the students.
Learning outcomes should outline the most central and essential elements of a course or curriculum. They may also shape the evaluation proposal of an institution. As such, the process of developing learning outcomes provides an opportunity for reflection on what is most needed to help students acquire certain knowledge and skills. We can also consider the following elements to characterize Learning Objectives: a) core ideas for the course, b) desired types of learning, and c) the context in which the knowledge and skills acquired in the course will be used, including possible applications, providing a basis for the development of learning outcomes.
The central ideas assume that to begin the process of developing learning outcomes, it may be useful to consider some central ideas of the programmatic content and generalizable skills taught in the course. In addition to information about the context and types of learning, we have to consider the following concerns that can be expressed in the following questions: What do students need to know in order to succeed in the course or discipline? What should students do to succeed in the course or discipline? What knowledge or skills should students bring to the classroom to take as a basis? What knowledge or skills will be new to students during a course or discipline? What other areas of knowledge are linked to the work of the course or subject being studied?
2.3 Assessment in Distance Education
With the advancement of distance education in Brazil and worldwide, defining a coherent evaluation process that takes into account the peculiar aspects of this type of teaching has been difficult (Laguardia, Portela, and Vasconcelos, 2007).
These difficulties arise due to the complexity of e-learning, as a result of several variables that compose it, such as: teaching material quality, curriculum, teaching and learning process, accessibility of the Virtual Learning Environment (VLE), students and online instructor’s interaction, among others (Sales et al., 2011; Andriola and Loureiro, 2005).
In order to propose improvements in the process of evaluation of distance learning courses, some researches (Sales et al., 2011; Liaw, 2008; Hervas, Garc´ıa, and Penalvo, 2005) point out to the development of tools that aid the student’s learning evaluation, whose objective is to improve and systematize the evaluation process. These tools are characterized by choosing parameters, which, according to their proponents, have a greater impact on the quality of the course. Adding to this the mathematical bias to seek to establish the proof of its reliability.
In the context of data analysis or data mining, recent research points to the use of data mining techniques in data extracted from VLE (Romero and Ventura, 2006). The VLE allows storing many kinds of data that can be used to extract patterns and characteristics, such as dropout behaviour or lany kind of students’ profiles.
Standards can help identify possible dropouts. Such a prediction will con-tribute not only to reducing the high rates of dropouts, but also the improvement of the satisfaction ratings and credibility of the e-learning courses as a solid teaching modality for the current contemporary society.
2.4 Summary
3 ”METRICS” MODELS: AN OVERVIEW
In contemporary society, we are increasingly using data collection and analysis in several areas of knowledge. Each dataset is related to a field of knowledge, with nuances and specific features for that field. Thus, it is necessary that specialists in these areas have statistical knowledge to analyze this data. Moreover, they have the possibility of developing models to solve specific problems of each area. In this chapter, we will raise the theoretical discussion about the already well established ”metrics” in the scientific community, as well as the description of some statistical models that will be carried out throughout this thesis.
3.1 Theoretical Discussion
Nowadays, the ”metrics” are becoming widely used by researchers, accepting that the information brought by the data is powerful and was not well treated in the past. We may highlight some of the well stablished metrics as:
• Sociometrics is an analytical tool for studying interactions among social groups;
• Econometrics is the branch of Economics that, starting from the general economic theory, analyzes the data provided by Statistics, through the application of mathe-matical methods, expressing economic laws in mathemathe-matical language;
• Psychometrics is a specialized branch of psychology that deals with the study and development of psychological assessment tests and the development and application of statistical knowledge and other mathematical processes linked to psychology;
• Medicometrics is the science of integrating different sources of measurements related to a pathological system;
• Chemometrics emerged from the need to extract chemical information from the profusion of data resulting from modern instrumentation;
• Biometrics refers to metrics related to human characteristics;
• Bibliometrics is one of the key ways of measuring the impact of scholarly publica-tions.
According to Professor de Leeuw (2006):
If Foo is a science then Foo often has both an area Foometrics and an area Mathematical Foo. Mathematical Foo applies mathematical modelling to the Foo subject area, while Foometrics develops and studies data analysis tech-niques for empirical data collected in Foo. Each of the social and behavioural sciences has a form of Foometrics, although they may not all use a name in this family.
Additionally, he also complemented that ”Psychometrics and Educometrics have been around for a long time, at least since Galton, and their development has been very closely linked and often the two have been indistinguishable”. It is time to split up both and start to think of educometrics as a whole branch of nuances and specific features.
In the following sections, some models of the multivariate and multi-linear data analysis will be presented, highlighting those that will be in the scope of this research.
3.2 Multivariate Analysis
With the modern world’s need to provide better quality, low-cost products and services, effective knowledge management is needed. We are surrounded by information that is often not collected, thus not becoming useful knowledge. Nowadays, this informa-tion is collected and stored with greater ease, considering the technological advances that have been developed so far.
From the storage and collection of this information, a step forward was given: the mining process of these data. Multivariate analysis is understood as a set of statistical techniques that simultaneously use multiple variables Carroll, Green, and Chaturvedi (1997). Thus, if we have more than two variables in the same statistical model we can state that we are dealing with a multivariate analysis.
Many multivariate techniques are extensions of univariate and bivariate anal-ysis. Thus, we do not have to apply a single model for each variable, and it is possible to apply the statistical model to a set of variables. Other techniques are unique to the multivariate analysis, such as Factor Analysis (see Section 3.4.1.1), which distinguishes groups based on linear combinations between the analyzed variables.
In general, whenever a decision needs to be made, a large number of factors must be taken into account. Obviously, not all of these factors weigh the same way at certain conditions. Sometimes, by making an intuitive decision, these factors or variables are not identified in a systematic way, that is, the variables that affect decision making are not identified.
interpret events and phenomena based on the knowledge of the intervening variables, considered important in these events.
There are several methods of multivariate analysis, with very different purposes among them. Therefore, one goes back to the following questions: Which knowledge de we intend to generate? Or rather, what kind of hypothesis we want to generate regarding the data and the methods are chosen according to the aims of the research? Since it is known that the multivariate analysis can be seen as an exploratory data analysis, lending itself to generate hypotheses, and not to confirm them, or using confirmatory techniques, as in the hypothesis tests, in which one has an confirmation on the sample under study.
3.3 Multidimensional Analysis
Nowadays, we live in a data deluge that has being generated every minute from several computational systems around the world. Coupled with this generated data, the extraction of useful information appears to be fundamental to understand the set of standards and patterns associated with this data. Data processing techniques (cluster-ing/discovery, regression/ classification/prediction) became essential to comprehend all the information brought by the collected data. However, some of the data has multiple entries and then goes beyond the classical bilinear representation.
Multidimensional techniques are becoming new trends in several topics and disciplines in the contemporary society. The idea is that all data collected by several sources are somehow correlated and deserve to be treated and analysed according to its multidimentional structure. In this thesis, multidimensional arrays are called as ”ten-sors” such as described by Smilde, Bro, and Geladi (2004), Cichocki et al. (2009) and Kroonenberg (2008).
The study of tensors revealed a new way of analyzing and understanding the data. Although the beginning of studies of these techniques dates back to the 1970s (Carroll and Chang, 1970), many areas of knowledge, nowadays, use tensor decomposi-tion techniques in an effective way: signal processing (Almeida, Favier, and Mota, 2008), chemometrics (Smilde, Bro, and Geladi, 2004), psychometrics (Kroonenberg, 2008), da-ta mining (Morup, 2011) and many others. A survey of many unsupervised multiway applications can be found in Acar and Yener (2009).
3.4 General Models in Data Analytics for Education
In this sense, the matrix and tensor decompositions appear as a powerful tool to analyze the intrinsic relations of the variables analyzed. Studies presented in Kolda and Bader (2009) become important to draw a parallel with the proposal of consolidation of the application of educometrics as a field of investigation.
In addition, two doctoral theses present the application of the principal com-ponent analysis (PCA) for educational management (Nunes, 2016) and of parallel factor analysis (Parafac) for the analysis of learning outcomes and learning context as a whole integrated system (Vasconcelos, 2016). Both are making a direct citation to the works that present the term educometrics as a research area.
3.4.1 Multivariate Models
In this section we will present the multivariate models Factorial Analysis and Principal Component Analysis that will be used throughout this research.
3.4.1.1 Factorial Analysis model
Factorial Analysis (FA) stands out as being a set of statistical techniques that has as one of its main objectives the dimensionality reduction of the variables with low information loss. In general, FA seeks to establish standards that best represent the original variables, which can be grouped and classified (Cronbach, 1951).
The latent variables, formed by the original data, provide information not ob-served initially from the data analysis. FA is one of the classic techniques for data mining, being widely applied in problems in the field of psychometry (Romero and Ventura, 2010), mainly in the development of evaluation instruments, and is currently widely used in pat-tern recognition and signal processing for noise and redundant information elimination, among others (Romero and Ventura, 2010) .
The extraction of patterns, from the AF, is based on the matrix of correlation or covariance of the data related to the original variables. Several mathematical models can represent the FA, however, in the following a linear decomposition is presented to describe the model, regarding the equation below (Gorsuch, 1997):
ML×C =AL×P(BC×P)
T
+EL×C, (1)
in which ML×C is the original data matrix with L×C dimensions, and, by convention,
the number of lines (L) is treated as the number of observed samples and the number of columns (C) the number of variables analyzed. The AL×P and BC×P are matrices called
components matrices, which are related to the observations and the original variables, respectively, and EL×C is the information considered not relevant from the system of
It is important to emphasize that the matricesAL×P andBC×P are orthogonal
to each other. This information guarantees that the data generated by the FA are linearly uncorrelated, ensuring that the vector projections in this new coordinate system are made using only the intrinsic information of each original variable.
For each column vector of the matrix BC×P, we will find values that will
represent the influence of each original variable on the latent variable, these values are called loadings.
Some prior procedures are necessary to apply the FA and ensure the applica-bility of the technique to the data obtained, which are (Gorsuch, 1997; Silvaet al., 2012; Majors and Sedlacek, 2001):
• Use of the Kaiser-Meyer-Olkin (KMO) and Bartlett Tests to verify if the sample is suitable for the application of FA;
• Selection of the number of components of the model (if it is a procedure for model validation);
• Verification of the internal consistency of the factors analyzed through Cronbach’s
α;
• Verification of the representativeness analysis of each original variable in FA through the commonality of each observed variable in the new latent structure;
• Rotation matrix is also an option to be considered to better comprehend the new data generated by the model.
It is worth noting that, depending on the application, FA may be confirmatory or exploratory (Fabrigar et al., 1999). Confirmatory Factorial Analysis (CFA) is used when the researcher seeks to attest or validate a factorial structure established by previous work. In relation to Exploratory Factorial Analysis (EFA), is a process of data mining that identify patterns among the observed variables analyzed.
3.4.1.2 Principal Component Analysis Model
Principal Component Analysis (PCA) is one of the most classic statistical methods for multivariate data analysis. Its purpose is to allow an analysis of the data in order to minimize the internal correlation of a set of variables and to minimize the experimental noise obtained during the preparation of the data set. This is achieved through a (linear) transformation of the original data into a new set of uncorrelated data, called the principal components (PC), so that the first components of this new set of variables concentrate the greater variability of the original variables and noise can be minimized through an ideal selection of the principal components.
associated with such a transformation on the canonical basis isV∈Rm×m
and is applied over a set ofm,n-dimensional vectors represented by am×n matrix,X, in the canonical basis. The new vector coordinates on the new axes determined by V are given by a
m×n matrix, Y = XV. In such a way, the product XV corresponds to a projection of the old variables in the new coordinated axes determined by V. As we shall see, the matrix V must be orthogonal. Therefore, finding the major components is equivalent to determining a factorization of the original data matrix in the product X = YVT. The matrix Y is called the principal components matrix, score matrix, and the matrix V is called loading matrix.
In fact, it is important to point out that the ideal objective is to mathematical-ly model the data as complex information from a complete set of independent elementary information, in which each elementary information has an indivisible characteristic, and whose algebraic combination faithfully reproduces each complex information, unless re-silient observation errors and representative without content of the sources are presented in the data. Therefore, such errors are independent of sources, with no representativity identified in the set of elementary information.
The identification of the independence between elementary information being a difficult and exhausting task, leads us to seek, in most cases, a description of the phe-nomena from attributes associated with their elementary information. Thus, the choice of independent references is directed to a choice of orthogonal references, which are chosen without having a biunivocal relation with the elementary information. On the contrary, the choice of the systems formed by orthogonal dimensions is carried out from criteria that consider the data without necessarily extracting from them their elementary char-acteristics, but only to aligning them to each one of the attributes. In this way, the elementary characteristics remain all present in each attribute. The choice of references is associated with the choice of attributes, which are supposed to be associated with criteria that incorporate orthogonality structures.
From the point of view of the multivariate analysis, we can think of the matrix X, m ×n, as a set of m samples given in function of n attributes. Initially, these n
attributes may have some internal relationships. Determining the principal components would be to determine new uncorrelated attributes or components such that the first components describe as much information as possible, the second describing as much information as possible of the part that the former could not describe, and so on, up to the n-th component.
Ideally, the matrixXrepresents a data set with a mean equal to 0 and standard deviation equal to 1, i.e., the data is centered around the origin and normalized. In this case, we will say that the data is standardized. This practice prevents any discrepancy between values, often due to choices of units of inconvenient measures.
is based on the Eigenvalues Decomposition (EVD) of the covariance (or correlation) matrix of the original data and the other method is based on the Singular Values Decomposition (SVD) of the original data matrix. The main difference is if we consider a matrixX with
m×n dimentions, the EVD can be used if and only if m = n, and for m 6= n the SVD should be used. In this thesis, we will demonstrate the method based on SVD.
In order to find the principal components through SVD, we will base the theorem below, which is known as the Singular Value Decomposition Theorem. Proof of this theorem can be found in Smilde, Bro, and Geladi (2004).
Considering X a real value full rank matrix with m×n dimentions. Then, there is an orthogonal real matrix U, m× m, and another orthogonal real matrix V,
n×n, such as:
X=UΣVT, (2)
where Σ = diag(σ1, σ2, ..., σp), p = min(m, n), is a diagonal matrix m ×n uniquely
determined, such that the elements of its main diagonal are nonnegative real numbers satisfying σ1 ≥σ2 ≥...≥σp ≥0.
Furthermore, the matrixU, called the matrix of the left singular vectors, will be the matrix of the eigenvectors of XXT, the matrix V, called the matrix of the right singular vectors, will be the matrix of the eigenvectors of XTX and the real numbers σ
i
will be equal to√λi, fori= 1,2, ..., p, whereλi is thei-th eigenvalue of the matrixXXT,
which also corresponds to thei-th eigenvalue of the matrixXTX.
Given a matrix X of a given dataset (preferably standardized), the principal components matrixYcan be determined directly from the SVD computation of the matrix X. LetU,V and Σ, respectively, the matrix of the left singular vectors, the matrix of the right singular vectors and the matrix of the singular values, all referring to the matrixX. The matrix of the principal components can be determined as follows:
Y =UΣ (3)
In this way, we have that the matrix V determined by the SVD of X is the loading matrix, i.e., the matrix that gives us the new coordinated axes.
The variance explained νi of the i-th component can be determined through
the i-th singular value (σi) ofX:
νi =
σ2i
tr(ΣTΣ) =
σi2
Pp
j=1σ2j
(4)
The cumulative variance µi of the first icomponents is given by:
µi =
i
X
k=1
νk =
Pi
k=1σ2k
Pp
j=1σj2
The difference of variance explained and cumulative variance is that the vari-ance explained is related to the retained singular varivari-ance of each principal component extracted and the cumulative variance is the sum of the variance explained of the principal components used in the model.
A reasonable choice of the number of components is given by choosingr(r << i) such a that the number µr = Pri=1µi is relatively close to 1. In some applications,
for example, it is assumed that µr ≈ 0.70 is a reasonable value. For instance, another
criteria for rank (components) selection is based on the division of each eigenvalue by the highest one and this percentage must be less than 10%. But there is no general method to determine which minimum value of µr is ideal, since, in general, such value and the
analysis made on the components that determine this value depends on the geometry of the problem.
3.4.2 Multidimensional Models
Historically, the first work on the subject of multidimensional analysis was introduced by Cattell (1944). Based on the Thurstone principle, arguing that a simple structure could be found to describe a data matrix or its correlation matrix with the help of factors, Cattell proposed the simultaneous analysis of several matrices and the use of the principle of ”proportional parallel profiles” (Cattell, 1944). That is, from an arrangement of matrices, find a common set of factors amog them. He defined object-s, circumstances/time, attribute, scale, and observer as the five inputs to an idealized multidimensional arrangement and for practical reasons, reduced them to a three-input arrangement with people, attributes, and circumstances.
The decomposition of a three-input arrangement was first presented by Tucker (1966). This decomposition consists of finding loading matricesA,B andCand a three-way core-tensorG, which were introduced with a hypothetical example of 12 individuals, 9 treatments and 5 observers. In another independent research, Lathauwer, Moor, and Vandewalle (2000) had shown a similarity between the core-tensor and the singular value matrix in the singular value decomposition (SVD).
According to Cichockiet al.(2009), the matrix factorizations such as Principal Component Analysis and Singular Value Decomposition (SVD) are important tools for dimensionality reduction, noise reduction and data mining. However, these factors have only a two-dimensional representation, such as space and time, making their limited use in data structures requiring more than two dimensions (Cichocki et al., 2009).
3.4.2.1 Basic Principles
a vector is a first order tensor, a second order tensor is a matrix and higher order tensors are those with three or higher dimensions.
Some matrix products and unfolding matrices forms will be presented below.
3.4.2.1.1 Matrix Products
Matrix products are important for the algebraic development of tensor fac-torizations.
The Kronecker product (⊗) of two matricesA (I×J) and B(K×M) can be defined as:
A⊗B=
a11B . . . a1JB
... . .. ...
aI1B . . . aIJB
The dimension of the productA⊗B isIK ×J M. The Kronecker product is also defined by two matrices where the regular matrix product does not exist (ifJ 6=K). Another important product is the Hadamard product (⋄), which can be defined by the two matrices A and B with dimensions I×J:
A⋄B=
a11b11 . . . a1Jb1J
... . .. ...
aI1bI1 . . . aIJbIJ
where aIJ and bIJ are elements of A and B, respectively. Then, the Hadamard product
can be seen as an element-wise product.
The third product is the Khatri-Rao product (⊙), that can be used by the computation of matrices with the same number ofK columns, defined as:
A⊙B = (A1⊗B1. . .AK⊗BK)
Some of the very useful properties of the products presented above can be found in Smilde, Bro, and Geladi (2004).
3.4.2.1.2 Unfolding
In matrices it is useful to organize their input elements as vector-rows or vector-columns. Tensors, or three-way arrays, can also have their elements organized in two-dimensional sections, as can be arranged in flat horizontal, lateral or frontal slices, according to Figure 2. It is worth noting that in this case, elements of tensors are located geometrically at the meeting point of the three planes perpendicular intersection.
I K I
J K
K
J
X
(1)
K
X
(2)
K J
X
(3)
I
J K
I I
J
I
J K
I Figure 2: Unfolding of a tensor in each mode.
higher than 2, it is convenient to transform them into matrices in each mode,X(1), X(2)
and X(3), in order to facilitate its computational manipulation. For this, the concept of
slice becomes fundamental to understand how the unfolding process works. The slices of the tensor can be considered as cuts in the tensor and its modes.
3.4.2.2 Parafac
The Parafac model can be considered a straightforward extension of the PCA model. In the Parafac method Smilde, Bro, and Geladi (2004); Kolda and Bader (2009), a trilinear model is found to minimize the sum of squares of the residues, eijk, according
toxijk =PRr=1airbjrckr+eijk, where R is the number of components used in the Parafac
and air,bir and cir indicate weights of the r-th component and eijk denotes the entry’s
unexplained information.
Connections between PCA and Parafac can be further visualized via tensor product notation: PCA approximates X as a sum ofR rank-1 second-order tensors (i.e., outer-products), and Parafac approximates X as a sum of R rank-1 third-order tensors (Figure 3). In Parafac, a three-way array X is decomposed into a sum of triple products of vectors (triplets).
As can be seen in Equation 6, the Parafac model decomposes the tensorX ∈ RI1,I2,...,IN in a vector-producta(1)
r ,a(2)r , . . . ,a(rN), contained in the matricesA(1)r ,A(2)r , . . . ,A(rN),
X = I E
A
B C
I
J K
I
J K
R
R I
J K
I
J K
+
R
R
R R
Figure 3: Parafac pictorical representation.
X ≈PR
r=1λr[a(1)r ◦a(2)r ◦. . .◦a(
N)
r ]
≈I×1A(1)r ×2A(2)r . . .×N A
(N)
r (6)
whereI=diagtensor[λ1, λ2, . . . , λR]∈RR,R,...,R is a superdiagonal core tensor withλr6= 0
values on its main diagonal, R is the number of components extracted by the model, ×N
is then-mode product and the external products of the triads (a(1)r ,a(2)r , . . . ,a(rN)) are the
rank-1 tensors.
When compared to matrix models, the Parafac model brings with it a very important characteristic: uniqueness. The uniqueness of a model, ensures that there is only one solution to the problem, regardless of the rotation of the resulting data model.
An important step in using the Parafac method consists of estimating the number of components or latent variables (R) in the dataset. Several criteria can be used to determine this parameter, such as the explained variance and core consistency diagnostic (Cordondia) that was used in this work (Smilde, Bro, and Geladi, 2004). The Parafac algorithm used in this work was implemented in MATLAB via PLS Toolbox.
3.4.2.3 Tucker3
Originally, the Tucker3 model is considered a generalized Parafac model, since in the Parafac there is no iteration between the resulting vector-components of the model, ensuring that the core tensor is a superdiagonal tensor (G=I).
The Tucker3 model (see Figure 4) can be established based on a tensor X ∈ RI1,I2,...,IN in which the components J
1, J2, . . . , JN << I1, I2, . . . , IN are extracted by the
factorization, guaranteeing the existence of a core tensor G∈ RJ1,J2,...,JN which contains
X G E = A B C I J K I J K R P Q R P Q I J K I J K +
Figure 4: Tucker3 pictorical representation.
X ≈PJ1
j=1
PJ2
j=2. . .
PJN
j=Ngj1,j2,...,jN[a (1)
j1 ◦a
(2)
j2 ◦. . .◦a
(N)
jr ]
≈G×1A(1)×2A(2). . .×N A(N) (7)
In the model presented in the Equation 7, an important feature can be high-lighted: the non-uniqueness of the model. This characteristic can be observed in the development of Equation 8. To exemplify, a third-order tensor X ∈ RI1,I2,I3 is adopted
and the matrices resulting from the factorization (A(1)I1×J1,A
(2)
I2×J2,A
(3)
I3×J3) are multiplied
by three invertible matrices (B(1)J1×J1,B
(2)
J2×J2,B
(3)
J3×J3), such as:
X ≈(G×1B(1)×2B(2)×3B(3))×1(A(1)B(1)
−1
)×2 (A(2)B(2)
−1
)×3(A(3)B(3)
−1
)
≈Gˆ ×1Aˆ(1)×2Aˆ(2)×3Aˆ(3), (8)
we only observe the rotation of the initial matrices (A(1)I1×J1,A
(2)
I2×J2,A
(3)
I3×J3).
The deduction imposed by the Equation 8 brings with it some important im-plications. The Tucker3 model does not guarantee a single solution for the factorization, even imposing, for example, orthogonality or orthonormality constraints on the matrices B(1)J1×J1,B
(2)
J2×J2 eB
(3)
J3×J3. Thus, the traditional Tucker3 model does not apply to contexts
where the search for a single optimal solution is the key problem.
In the Tucker3 and Parafac models, some constraints are widely used for model development, such as: non-negativity, orthogonality, linear independence, orthonormality, among others. These constraints are useful when analyzing each type of context to be studied, for example, if we are working with real positive data, it is important that the model of factorization brings with it this characteristic, as it occurs in the applications of matrix factorizations (Smilde, Bro, and Geladi, 2004).
the classical Parafac and Tucker3 models need to be ”adjusted” to these new situations, initiating the development of new types of factorizations. The Parafac2 decomposition, to be discussed in the next section, is an example of a model derived from Parafac de-composition and it will be used in this thesis.
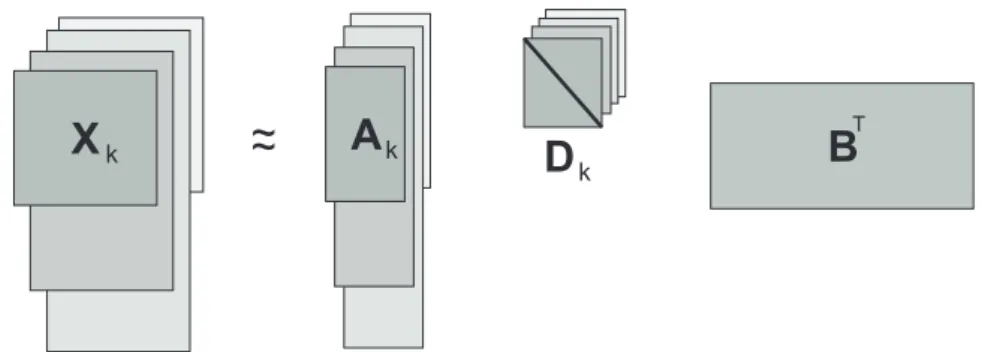
3.4.2.4 Parafac2
Considering trilinearity as a linear relationship between all of the three modes in a three-way tensor, the Parafac2 model does not follow this concept like Parafac does. Parafac2 does not assume that the shape or length of the factors in one of the modes must be the same for each sample. A pictorial representation of the Parafac2 model can be seen in Figure 5.
X
kA
kD
k~
~
B
TFigure 5: Parafac2 pictorical representation.
The three-way Parafac2 can be perceived as a Parafac model with no trilin-earity restriction. For this, the Parafac can also be called Parafac1. Assuming thatXk is
a tensor with k-samples with diferent sizes, we may have an individual A for each k, so calledAk. Then, the model is given by:
Xk =AkDkBT +Ek
where Xk is a slab of data (Ik × Jk) and I varies with k. Dk is a diagonal matrix
that holds the k-th row of C in its diagonal. Restricting that the cross-product AT kAk
remains constant. Then,Akis modeled as the productPkH, in whichPkis an orthogonal
matrix, keeping the sizes odAk, andHis a small quadratic matrix with dimension equal
to the number of components. Then, the alternating least square algorithm minimize the following cost funcion (Kiers, ten Berge, and Bro, 1999):
F ITerr=
K
X
k=1
||Xk−AkDkBT||2
The structure of the data collected in this study, we conduct the use of Parafac2 decomposition to extract the latent components of the data. In our case, each slab (Xk)
3.5 Summary