A search for markers of sugarcane evolution
M. Bacci Jr.
1*, V.F.O. Miranda
1, V.G. Martins
1, A.V.O. Figueira
2, M.V. Lemos
3, J.O. Pereira
4and C.L. Marino
5Abstract
To determine the phylogenetic relationship between sugarcane cultivars and other members of the Saccharinae subtribe, we identified the fast evolving ITS1-5.8S-ITS2 (ITS = internal transcribed spacer; 5.8S = 5.8S ribosomal DNA) region of the sugarcane genome in the Sugarcane Expressed Sequence Tag (SUCEST) genome project database. Parsimony analysis utilizing this region and homologs belonging to the 23 closely related Andropogoneae currently deposited in the GenBank database has shown sugarcane as the sister group ofSaccharum sinense. However, because there are few parsimony-informative characters and high homoplasy in the ITS1-5.8S-ITS2 region we were not able to determine with confidence the phylogenetic relationship between sugarcane and some of the remaining members of Saccharine subtribe. To find alternatives for the phylogenetic reconstruction of sugarcane evolutionary history, we selected 17 markers (nuclear, chloroplastic or mitochondrial) from the SUCEST database of which apha-tubulin, ribosomal protein L16 (rpl16) and DNA-directed RNA polymerase beta chain (rpoC2) were found to have a low incidence of polymorphism and comparable, or even faster, rates of evolution than the ITS1-5.8S-ITS2 region. We suggest that these markers should be considered as preferential choices for phylogenetic studies of Saccharinae subtribe.
INTRODUCTION
The Saccharum L. group is a polyploid complex within the Saccharinae subtribe of the Andropogoneae Dumort tribe which itself if located within the Poaceae family (Sobralet al., 1994; Jacobs and Everett, 2000). The
Saccharum L. group and Sorghum (Sorghinae subtribe) seem to have diverged from a common ancestor 5 million years ago (Al-Janabiet al., 1994) through a single and rapid radiation (Kellog, 2000; Spangler, 2000), accumulating few consistent mutations (Kellog and Watson, 1993; Ma-son-Gameret al., 1998; Spangleret al., 1999). Because of this, phylogenetic reconstructions of Andropogonae often result in clades with poorly supported relationships (Spangler, 1999). Even the fast evolving ITS1 and ITS2 re-gions have shown few differences between or within the Andropogoneae species (Wanget al., 2000, Ainouche and Bayer, 1997). Therefore, the molecular systematics of the Andropogoneae would greatly benefit from markers with similar, or even faster, rates of evolution compared to that of the ITS regions. In this regard, the Sugarcane Expressed Sequence Tag (SUCEST) genome project is an outstanding source of information because it contains many of the genes expressed by sugarcane cultivars used in agriculture.
However, the identification of such markers may be complicated by the large size (2n = 18-170) of the
Saccharumgenome, whose expansion has produced new gene combinations and increased polymorphism and chro-mosome number (Minget al., 1998). The genomic com-plexity of the sugarcane cultivars whose data is included in the SUCEST database is probably even greater, since they are derived from hybrids betweenSaccharum spontaneum
andSaccharum officinarum.
The aim of the present investigation was to identify fast evolving markers within the SUCEST database, inves-tigate their polymorphism and select the most appropriate of these markers to study the evolution of closely related specimens within Andrpogoneae. To accomplish this, we identified sugarcane internal transcribed spacer (ITS) ITS1 and ITS2 sequences and used them to infer the phylogen-etic position of sugarcane within the Saccharinae. We also compared the rate of evolution of the ITS regions to the rate of evolution of nuclear, chloroplastic and mitochondrial cDNA sequences selected from the SUCEST database. Our results indicate that at least three sugarcane markers have comparable or even faster evolution rates than the ITS re-gions and can be considered as preferential choices for use in research on the molecular systematics of the Saccharinae subtribe.
1
Centro de Estudos de Insetos Sociais, IB, UNESP. Av. 24-A 1515, 13506-900 Rio Claro, SP, Brazil.
2Laboratório de Melhoramento de Plantas/Centro de Energia Nuclear na Agricultura, USP. Av. Centenário 303, 130400-97 Piracicaba, SP, Brazil. 3
Departamento de Biologia Aplicada à Agropecuária, UNESP, Via de Acesso Prof. Paulo D. Castellane km 5, 14870-000 Jaboticabal, SP, Brazil.
4Departamento de Biotecnologia de Plantas Medicinais, UNAERP. Av. Costábile Romano 2201, 14096-380 Ribeirão Preto, SP, Brazil. 5
MATERIAL AND METHODS
Search for sugarcane sequences
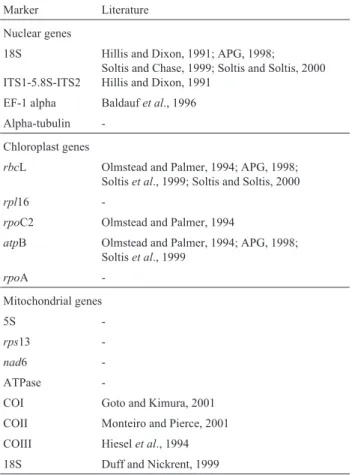
Complete coding sequences of markers, including some commonly utilized in plant phylogenetic studies (Ta-ble I) were retrieved from the GenBank database and uti-lized as a query to a basic local alignment search tool (BLASTN) search against the SUCEST database. Results were treated as described below in order to select appropri-ate molecules for evolutionary studies.
Retrieving of sequences homologous to sugarcane markers
Each of the identified sugarcane markers was utilized in a new BLASTN search against the GenBank database,
and homologous sequences were retrieved and grouped into a new database for phylogenetic analysis.
Phylogenetic analysis
Conserved elements within the homologous sequen-ces were aligned through the introduction of gaps using the program MALIGN (multiple alignment), version 2.8 (Wheeler and Gladstein, 1994), running with thescore zero
andquickparameters. Regions which could not be unam-biguously aligned were excluded from the phylogenetic analyses which were carried out through parsimony or maximum likelihood methods using the program PAUP* (phylogenetic analysis using parsimony and other meth-ods), version 4.0b4a of Swofford (2000), and branch-and-bound search (Handy and Denng, 1982). De-cay index was calculated according to Bremer (1988), us-ing the Treeroot 2.0 program of Sorenson (1999).
RESULTS AND DISCUSSION
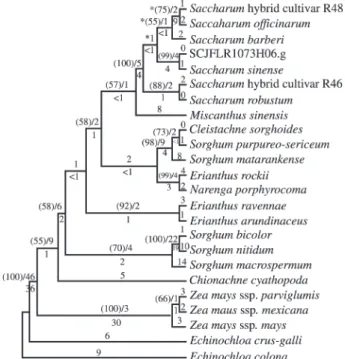
Many current investigations within the Andropo-goneae tribe utilize the ITS1 and ITS2 regions because they are known to incorporate changes at comparatively high rates (Hershkovitz and Zimmer, 1997; Baumet al. 1998). The analysis of the sugarcane dataset indicates that cluster SCCCLR1CO5E04.g (107274) contains 590 base pairs corresponding to the complete coding sequence of the ITS1-5.8S-ITS2 region, which was utilized for the parsi-mony analyses summarized in Table II.
The position of sugarcane cultivars, represented by SCCCLR1CO5E04.g cluster, has been determined within the 23 closely related Andropogoneae taxa that have the ITS1-5.8S-ITS2 region deposited in the GenBank database. The generated alignment was made up of 603 nucleotides and resulted in 33 most-parsimonious trees (MPTs) with length = 373, consistency index (CI) = 0.7131 and retention index (RI) = 0.7902. In order to minimize the interference from homoplastic characters, data were submitted to suc-cessive approximation using the PAUP* option for rescaled consistency index (RCI, Farris, 1969; Carpenter, 1988). This procedure increased the goodness-of-fit and re-sulted in one of the 33 MPTs (length = 227.94614, CI = 0.8175, RI = 0.8877) which shows SCCCLR1CO5E04.g cluster as the sister group ofSaccharum sinensein a clade supported by a bootstrap index = 99 (Figure 1). A reason-able bootstrap index (88) was also obtained for the cluster-ing ofSaccharum robustumandSaccharumcultivar R46, but little support exists for the clustering of Saccharum barberi,Saccharum officinarum andSaccharum cultivar R48. Identical tree topology and comparable bootstrap in-dexes (not shown) were obtained for a single MPT (length = 47, CI = 0.9362, RI = 0.8235) derived from the analysis which included onlySaccharum specimens and Miscan-thus sinensis. The pairwise test applied toSaccharumand
MiscanthusITS1-5.8S-ITS2 sequences showed few
differ-Table I- Molecular markers investigated in sugar cane and previous references to their utilization in phylogenetic studies. (-) indicates that
the marker has not yet been used in a phylogenetic study.
Marker Literature
Nuclear genes
18S
ITS1-5.8S-ITS2
Hillis and Dixon, 1991; APG, 1998; Soltis and Chase, 1999; Soltis and Soltis, 2000 Hillis and Dixon, 1991
EF-1 alpha Baldaufet al., 1996
Alpha-tubulin
-Chloroplast genes
rbcL Olmstead and Palmer, 1994; APG, 1998; Soltiset al., 1999; Soltis and Soltis, 2000
rpl16
-rpoC2 Olmstead and Palmer, 1994
atpB Olmstead and Palmer, 1994; APG, 1998; Soltiset al., 1999
rpoA
-Mitochondrial genes
5S
-rps13
-nad6
-ATPase
-COI Goto and Kimura, 2001
COII Monteiro and Pierce, 2001
COIII Hieselet al., 1994
18S Duff and Nickrent, 1999
ences, from 1 to 5%, and the alignment of these sequences resulted in only 12 parsimony informative characters (Ta-ble II). By considering gaps as a fifth state, parsimony in-formative characters increased to 13, but this did not increase the support forSaccharum barberi, Saccharum officinarum and Saccharum cultivar R48 clade (not shown). In addition to bootstrap values, low decay index and distance values (Figure 1) indicate that tree nodes in-volvingSaccharumspecies are supported by few mutations and that tree topology may be highly influenced by ho-moplasy.
In addition to parsimony, maximum-likelihood anal-ysis was applied to the ITS1-5.8S-ITS2 alignment. To ren-der the analysis computationally tractable, onlySaccharum
andMiscanthus sinensisrepresentatives have been consid-ered. The most parameter-rich model (general time-revers-ible + proportion of invariant sites + rate heterogeneity modeled as a gamma distribution with six rate categories) was significantly more likely than the next best model, as determined by the likelihood ratio test. The selected model was applied to a starting tree that had been generated by neighbor-joining (Kimura 2-parameter distances) and tree bisection-reconnection (TBR) branch swapping. The single most likely tree (MLT) generated preserved clades which had high support in the single MPT,i.e. those involving SCCCLR1CO5E04.g cluster and Saccharum sinense or
Saccharum robustumand cultivar R46. However, the MPT clade containing Saccharum cultivar R48, Saccharum officinarumandSaccharum barberiwas not present in the MLT (Figure 1). These results reinforce the low confidence in the poorly supported relationships obtained for this clade in the MPT.
It is not easy to determine clearly the phylogenetic re-lationship between sugarcane and other members of the Saccharinae subtribe and we feel that it will be necessary to consider a larger number of consistent mutations than those accumulated by the ITS regions. To accomplish this, mo-lecular analysis of Saccharinae should focus on data sets containing not only ITS markers but other markers with rel-atively high evolutionary rates, and use methods such as successive weightinh to minimize homoplastic noise.
We searched the SUCEST database to find fast evolv-ing markers, the searches beevolv-ing directed at three categories of molecules,i.e.nuclear or mitochondrial ribosomal DNA and spacers, nuclear or mitochondrial protein coding genes
related to carbohydrate metabolism and electron transport, and chloroplast genes. These searches resulted in the identi-fication of 17 cDNA clusters (Table III).
Since single clusters were identified for every mar-ker, a low polymorphism incidence was detected in sugar-cane. While the finding of a unique gene is consistent with the absence of polymorphism, this result must be
inter-Table II- Parsimony analysis of the ITS1-5.8S-ITS2 region.
Analysis Taxa MPT Length (steps) CI RI Total characters Variable characters PIC
Equal weight 24 33 373 0.7131 0.7902 603 204 154
RCI 24 1 227.94614 0.8175 0.8877 603 204 154
Saccharinae 8 1 47 0.9362 0.8235 586 43 12
5thstate 8 6 50 0.9200 0.7778 586 45 13
Key: CI = Consistency index, RI = Retention index, PIC = Parsimony informative characters, RCI = rescaled consistency index (Farris, 1969; Carpenter, 1998), 5thstate = analysis of Saccharinae taxa considering gaps as a 5thstate.
preted with special caution. Identification of a given marker from a cDNA library occurs as a function of its relative abundance, so that its absence may just be the result of a low transcription rate.
Thus, to refine the results of the polymorphism inves-tigation we carried out a BLASTN search for reads in the SUCEST database utilizing each of the 17 identified sugar-cane clusters as queries. This procedure resulted in the identification of small gene fragments, which were found both as a single molecule or as domains inserted in a larger sequence. These fragments were mostly found in nuclear 18S ribosomal RNA (18S rRNA) and elongation factor al-pha (EF-1 alal-pha), and it appears that their distribution in sugarcane cDNA sequences may ultimately prove to be useful in the study of genome expansion in theSaccharum
L. group.
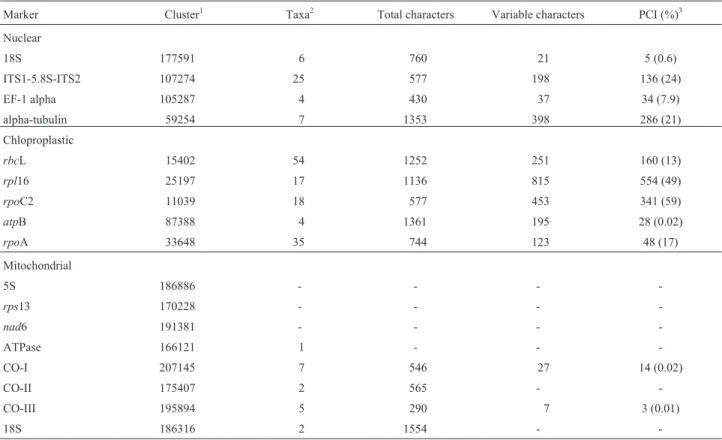
In order to evaluate the utility of the selected markers for evolutionary studies, we generated alignments using a given marker and its homologs from the Poaceae (Grami-neae) family currently deposited in the GenBank database. The rates of evolution of each marker were estimated by
de-termining the percentage of parsimony-informative charac-ters (PIC) presented by each of the alignments. Table III shows that the ITS1-5.8S-ITS2 alignment contained 136 PIC out of 577 characters,i.e. 24%. In addition, the al-pha-tubulin alignment presented 21% of PIC, indicating that alpha-tubulin has an evolution rate comparable to that found in ITS1-5.8S-ITS2 region. On the other hand,rpl16 andrpoC2 have faster evolution rates, since their align-ments contained 49% and 59% of PIC respectively. Thus it is reasonable to assume that sequencing of alpha-tubulin,
rpl16 andrpoC2 from Saccharinae specimens would add considerable information to the phylogenetic analysis of this subtribe. These findings make such molecules prefer-ential markers for future studies on the systematic position of sugarcane cultivars within the Saccharinae subtribe.
ACKNOWLEDGMENTS
We thank F. Marques for his comments on the parsi-mony analyses; Fundação de Apoio à Pesquisa do Estado de São Paulo (FAPESP) for the financial support of this work (Proc. 00-07438-1) and the master degree fellowship
Table III- Phylogenetic information of sugarcane evolution markers.
Marker Cluster1 Taxa2 Total characters Variable characters PCI (%)3
Nuclear
18S 177591 6 760 21 5 (0.6)
ITS1-5.8S-ITS2 107274 25 577 198 136 (24)
EF-1 alpha 105287 4 430 37 34 (7.9)
alpha-tubulin 59254 7 1353 398 286 (21)
Chloproplastic
rbcL 15402 54 1252 251 160 (13)
rpl16 25197 17 1136 815 554 (49)
rpoC2 11039 18 577 453 341 (59)
atpB 87388 4 1361 195 28 (0.02)
rpoA 33648 35 744 123 48 (17)
Mitochondrial
5S 186886 - - -
-rps13 170228 - - -
-nad6 191381 - - -
-ATPase 166121 1 - -
-CO-I 207145 7 546 27 14 (0.02)
CO-II 175407 2 565 -
-CO-III 195894 5 290 7 3 (0.01)
18S 186316 2 1554 -
-1Cluster names came from the fragment assembly program (Phrap) clustering of the sugarcane database. 2
Taxa names, GenBank accession numbers, alignments and trees are available at http://sucest.lad.dcc.unicamp.br/private/mining-reports/RL/RL-mining. htm.
3Parsimomy-informative characters.
of V.F.O.M. (Proc. 00/05098-9) and Centro de Estudos de Insetos Sociais-UNESP, Rio Claro for logistical support. Jonathan and Cybel Burgess are also acknowledged for English review.
RESUMO
Com o propósito de determinar a relação filogenética entre a cana-de-açúcar e membros da subtribo Saccharinae, a região gênica nuclear ITS1-5,8S-ITS2 (ITS: espaçador interno transcrito; 5,8S: DNA ribossomal 5.8S), com alta taxa evolutiva, foi identificada no banco de dados do proje-to genoma “Sugarcane Expressed Sequence Tag” (SUCEST). Uma análise através do método de parcimônia, utilizando esta região e seqüências homólogas de 23 An-dropogoneae retiradas da base de dados GenBank, indicou que a cana-de-açúcar é o grupo-irmão deSaccharum sinense.
No entanto, devido à pequena quantidade de caracteres informativos para parcimônia e à homoplasia presentes na região ITS1-5,8S-ITS2, não foi possível determinar com segurança a relação filogenética entre a cana-de-açúcar e alguns dos demais membros da tribo Saccharine. Como alternativa para esta baixa resolução, dezessete regiões gênicas nucleares, cloroplasmáticas ou mitocondriais fo-ram selecionadas a partir do banco de dados SUCEST com o objetivo de encontrar marcadores mais apropriados para a reconstrução da filogenia da cana-de-açúcar. Entre elas, aquelas correspondentes à alfa-tubulina, rpl16, e rpoC2 apresentaram baixa incidência de polimorfismo e taxas de evolução equivalentes ou mesmo maiores do que a obser-vada para a região ITS1-5,8S-ITS2. Estes marcadores são propostos como preferenciais para estudos filogenéticos da subtribo Saccharinae.
REFERENCES
Al-Janabi, S.M., Honeycutt, R.J., Peterson, C.and Sobral, B.W.S.(1994). Phylogenetic analysis of organellar DNA se-quence in Andropogoneae: Saccharum.Theor. Appl. Gen. 88:933-934.
Ainouche, M.L.andBayer, R.J.(1997). On the origins of tetra-ploidBromusspecies (section Bromus, Poaceae): insights from internal transcribed spacer sequences of nuclear ribo-somal DNA.Genome 49:730-743.
A.P.G.(1998). An ordinal classification for the families of flow-ering plants.Ann. Missouri Bot. Gard. 85:531-553.
Baldauf, S.L., Palmer, J.D.andDoolittle, W.F.(1996). The root of universal tree and the origin of eukaryotes based on elon-gation factor phylogeny. Proc. Nat. Ac. Sci. USA 93: 7749-7754.
Baum, D.A., Small, R.L. and Wendel, J.F.(1998).
Biogeo-graphy and floral evolution of baobabs (Adansonia, Bomba-caceae) as inferred from multiple data sets.Syst. Biol. 47: 181-207.
Bremer, K.(1988). Limit of aminoacid sequence data in Angy-osperm phylogenetic reconstruction.Evolution 42:795-803.
Carpenter, J.M.(1988). Choosing among multiple equally parsi-monious cladograms.Cladistics 4:291-296.
Duff, R.J.andNickrent, D.L.(1999). Phylogenetic relationships of land plants using mitochondrial small-subunit rDNA se-quences.Amer. J. Bot. 86:372-386.
Farris, J.S. (1969). A successive approximations approach to character weighting.Syst. Zool. 18:374-385.
Goto, S.G.andKimura, M.T.(2001). Phylogenetic utility of mi-tochondrial COI and nuclear Gpdh genes inDrosophila mo-lecular phylogenetics and evolution. Mol. Phyl. Evol. 18: 404-422.
Handy, M.D.andDenng, M.D.(1982). Branch-and-bound algo-rithmic to determine minimal evolutionary tree. Discrete Math. 96:51-68.
Hershkovitz, M.A.andZimmer, E.A.(1997). On the evolution-ary origins of the cacti.Taxon 46:217-232.
Hiesel, R., von Haeseler, A.andBrennicke, A.(1994). Plant mi-tochondrial nucleic acid sequences as a tool for phylogenetic analysis.Proc. Natl. Acad. Sci. USA 91:629-633.
Hillis, D.M.andDixon, M.T.(1991). Ribosomal DNA: molecu-lar evolution and phylogenetic inference.Quart. Rev. Biol. 66:411-453.
Kellog, E.A.(2000). Molecular and morphological evolution in the Andropogonae. In:Grasses: systematics and evolution (Jacobs, S.W.L. and Everett, J., eds), CSIRO Publishing, Collingwood, Melbourne, Australia, pp. 149-158.
Kellog, E.A.andWatson, L.(1993). Phylogenetic studies of a large data set. I. Bambusoideae, Andropogonodae, and Pooidae (Gramineae).Bot. Rev.59:273-343.
Mason-Gramer, R.J., Weil, C.F.andKellog, E.A.(1998). Gran-ule-bound starch synthase: structure, function, and phylo-genetic utility.Mol. Biol. Evol. 15:1658-1673.
Ming, R., Liu, S.C., Lin, Y.R., da Silva, J., Wilson, W., Braga, D., van Deynze, A., Wenslaff, T.F., Wu, K.K., Moore, P.H., Burnquist, W., Sorrels, M.E., Irvine, J.E.and Pat-erson, A.H.(1998). Detailed alignment ofSaccharumand Sorghum cromossomes: comparative organization of closely related diploid and polyploid genomes. Genetics 150:1663-1682.
Monteiro, A.andPierce, N.E. (2001). Phylogeny ofBicyclus (Lepidoptera:Nymphalidae) inferred from COI, COII, and EF-1 alpha gene sequences. Mol. Phylogenet. Evol. 18: 264-281.
Olmstead, R.G.andPalmer, J.D.(1994). Chloroplast DNA sys-tematics: a review of methods and data analysis.Amer. J. Bot. 81:1205-1224.
Sobral, B.W.S., Braga, D.P.V., LaHodd, E.S. and Kein, P.
(1994). Phylogenetic analysis of chloroplast restriction en-zyme site mutation in the Saccharinae Griseb. subtribe of Andropogoneae Dumort. tribe. Theor. Appl. Genet. 87: 843-853.
Soltis, E.D.andSoltis, P.M.(2000). Contribuitions of plant mo-lecular systematics to studies of momo-lecular evolution.Plant Mol. Biol. 42:45-75.
Soltis, P.S., Soltis, D.E.andChase, M.K.(1999). Angiosperm phylogeny inferred from multiple genes as a tool for com-parative biology.Nature 402:402-404.
Sorenson, M.D.(1999). Boston University, Boston, MA, USA.
Spangler, R.E., Zaitchik, B., Russo, E.andKellog, E.(1999). Andropogoneae evolution and genetic limits in Sorghum (Poaceae) using ndhF sequences. Sistematic Bot. 24: 267-281.
Swofford, D.L.(2000). Phylogenetic analysis using parsimony, version 4.0b4a. Ilinois Natural History Survey, Champaign, USA.
Wheeler, W.C.andGladstein, D.(1994). MALIGN: a multiple sequence alignment program.J. Hered. 85:417.