i NOVA Information Management School
Instituto Superior de Estatística e Gestão de Informação Universidade Nova de Lisboa
EXPLORING THE OPTIMAL UTILIZATION OF LOCATIONAL BANKING
STATISTICS DATA BY A NATIONAL CENTRAL BANK
THE SOUTH AFRICAN PERSPECTIVE
by
Alida Maria de Beer
Project work presented as partial requirement for obtaining the Master’s degree in Statistics and Information Management
Advisor: Filipa Lima, Ph.D. Co Advisor: João Falcao Silva
ii
DEDICATION
There are a number of people without whom this work project might not have been written, and to whom I am greatly indebted to.
Firstly, to my dear husband Barend, who has been a source of encouragement and inspiration to me during our life together and more specifically through the months of writing. Throughout our relationship, you have actively supported me and encouraged me to realize my full potential. A very special thank you for nurturing me through the difficult time I had to overcome on a personal level which coincided with the writing of this work project. Thank you for the practical and emotional support as I juggled between the roles of wife and mother and the challenging demands of work and study. I am tremendously appreciative as we mutually engaged on this journey together and at times had to make sense of the various challenges we faced and also provide encouragement to each other at times when it seemed difficult to continue. You are my soulmate and comrade.
Thanks to my wonderful sons Alex and Elmo, for being so understanding and supportive. I know I had to divide my attention and could not always focus on your needs as I would have wanted to. Hopefully I have set a good example for you in the process and have inspired you to do the same one day.
A special word of gratitude to my sister Eileen, who has never left my side and is incredibly special to me. You have been my best cheerleader.
I would also like to thank my friend and colleague, Marian who has supported me throughout the process.
iii
ACKNOWLEDGEMENTS
Firstly, I would like to extend my utmost thankfulness and gratitude to my supervisor Filipa Lima and my co-supervisor João Falcao Silva for their invaluable assistance, advice and encouragement. They have been more than generous with their expertise and precious time.
iv
ABSTRACT
The financial crisis that emerged in 2008 highlighted the importance of tracking global vulnerabilities through joint analysis of data covering many financial institutions. Locational banking statistics (LBS) were designed to provide comprehensive and consistent data on the banking systems’ funding and lending patterns (BIS, 2014) . The main purpose of the data is to provide information on the role of banks and financial centers in the intermediation of international capital flows. Apart from operational activities, procedures and systems to compile sound cross-border banking system data, there is a need to improve the understanding of the analysis techniques and research outcomes pertaining to this data and specifically how these elements feed into the broader macroeconomic framework, the financial stability regime, and ultimately into policy advice. This study is conducted within a positivist paradigm and investigates the key analytical uses of the LBS data from a national central bank perspective whilst utilising a quantitative approach to develop a suite of analysis mainly through the use of exploratory data analysis (EDA) techniques.
KEYWORDS
v
INDEX
1. Introduction ... 1
2. Background ... 2
3. Problem Statement ... 3
4. Aims and objectives ... 4
5. Relevance ... 5
6. Literature review ... 7
7. Methodology ... 10
7.1 Methodological approach ... 10
7.2 Data source and characteristics of variables ... 10
7.3 Research design ... 12
8. Analysis and presentation of results ... 14
8.1 In-depth analysis of LBS balance sheet data ... 14
8.1.1 Contextualizing SA banks’ international banking activities ... 14
8.1.2 Analysis of LBS components ... 15
8.1.2.1 Residency and nationality ... 15
8.1.2.2 Understanding SA banks’ counterparties ... 18
8.1.2.3 Instrument breakdown: Monitoring sources of funding ... 19
8.1.2.4 Monitoring foreign currency exposure ... 21
8.1.2.5 Assessing and explaining developments in LBS data ... 22
8.1.2.6 Publication and dissemination of analysis results ... 22
8.2 Ensuring internal and external data consistency and quality and contextualizing the LBS data within other macro-economic domains ... 23
8.2.1 Ensuring consistency and quality ... 23
8.2.1.1 Mirror exercises ... 23
8.2.1.2 LBS as quality assurance mechanism for source data ... 24
8.2.2 LBS as supplementary data source for other macro-economic datasets .... 26
8.2.2.1 Expanding the monetary and credit aggregates ... 27
8.2.2.2 Developing links between LBS and external account data ... 27
8.2.2.3 Financial Balance Sheet and Accumulation Accounts ... 31
8.2.2.4 Improved sector decomposition for South African sectors ... 31
8.3 Identifying indicators of vulnerability ... 31
8.3.1 Currency breakdowns and mismatches ... 32
vi
8.3.2.1 Relative size of banking sector ratio ... 36
8.3.2.2 Foreign lending ratio ... 37
8.3.2.3 Borrower concentration ratio ... 38
8.3.3 Network analysis ... 39
8.4 Dissemination strategy and analytical research outputs ... 42
9. Limitations and recommendations for future work ... 43
10. Conclusion ... 45
11. Bibliography ... 46
12. Appendices ... 49
12.1 Appendix I: Example of a proposed quarterly report providing the main highlights of the LBS ... 49
12.2 Appendix II: High-level comparability outline between LBS and Monetary data ... 55
12.3 Appendix III: Detailed results for the network analysis performed in figure 8.16 ... 59
13. Annexures ... 63
vii
LIST OF FIGURES
Figure 8.1 - SA banks’ resident and non-resident positions 2009 - 2015 ... 14
Figure 8.2 - SA banks’ non-resident asset and liability exposure to Developing Africa and Middle East 2009 - 2015 ... 16
Figure 8.3 - SA banks’ non-resident assets and liabilities by nationality as at end December 2015 ... 17
Figure 8.4 - SA banks’ net positions per counterparty sector as at end December 2015 ... 18
Figure 8.5 - SA banks’ non-resident assets and liabilities per instrument 2013 - 2015 .. 19
Figure 8.6 - Non-resident loan-to-deposit ratio since end-2009 ... 20
Figure 8.7 - SA banks’ total assets and liabilities per currency since 2013 ... 21
Figure 8.8 - Links between LBS and external account data ... 28
Figure 8.9 - Global BIS database breakdown ... 30
Figure 8.10 - Foreign assets and liabilities of SA banks 2009 - 2015 ... 33
Figure 8.11 - Net foreign asset position in foreign currency 2009 - 2015 ... 34
Figure 8.12 - SA banks’ FX hedge position 2009 - 2015 ... 34
Figure 8.13 - Net foreign currency exposure of non-resident sectors 2013 - 2015 ... 35
Figure 8.14 - Relative size of the banking sectors compared to their GDP as at end December 2015 ... 37
Figure 8.15 - Foreign lending ratios as at end December 2015 ... 38
viii
LIST OF TABLES
Table 7.1 - Simplified overview of the SA LBS data ... 12
Table 8.1 - SA Banks’ International financial position by location
as at end December 2015... 16
Table 8.2 - SA Banks’ international assets and liabilities by nationality
since end 2013 ... 17
Table 8.3 - Top 5 net lending and borrowing countries by counterparty sector
as at end December 2015... 19 Table 8.4 - Mirror data for SA banks’ deposits/loans vis-à-vis UK
as at December 2015 ... 24
Table 8.5 - Relationship between different data sources of SA banks’
balance sheet data ... 25
Table 8.6 - SA banks’ foreign currency exposure vis-à-vis non-resident
sectors, end December 2015... 35
Table 8.7 - South Africa’s exposures against top ten countries as at
end December 2015 ... 39
ix
LIST OF ABBREVIATIONS AND ACRONYMS
BIS Bank for International Settlements BOP Balance of Payments
CBS Consolidated Banking Statistics
CGFS Committee on the Global Financial System CEPR Centre for Economic Policy Research CPIS Coordinated Portfolio Investment Survey DTC Deposit Taking Corporation
EDA Exploratory data analysis
ERSD Economic Research and Statistics Department GDP Gross Domestic Product
G-SIBs Global Systemically Important Banks IBS International Banking Statistics IIP International Investment Position LBS Locational Banking Statistics
MFI Monetary and Financial Institutions (MFI)
MFSMCG Monetary and Financial Statistics Manual and Compilation Guide ROW Rest of the World
SNA System of National Accounts manual SA banks South African banks
1
1.
INTRODUCTION
1The global financial crisis that emerged in 2008 highlighted the increased pervasiveness of financial globalization; heightened cross-border capital flows; and the increasing pressure on global systemic risk. If left unchecked, the possible impact of this risk has the ability to eradicate all the positive developments that accompany the increasing financial globalization of the world economy. Successful tracking of global vulnerabilities requires comprehensive joint analysis of data covering many financial institutions. However, while the analysis of aggregate data has merit in identifying cross-border exposure, it also has the potential of masking systemic exposures to a particular asset class or funding source (Caruana, 2012). Therefore the use of more granular data which allows for further in depth analysis up to institutional level can assist greatly to identify specific vulnerabilities that macro indicators collected at a sector- or country-level can less easily capture. For example, a country may have limited exposure to foreign investments, but when these investments are with institutions exposed to financial risks it may become a financial stability issue - especially in times of crisis.
Modern day central bank economists are faced with a rapidly evolving financial environment resulting in more profound changes than ever before. The widespread inability to predict the recent global financial crisis has challenged central banks in two related but divergent areas – firstly at policy and institutional level, and secondly at the level of economic and financial theory underpinning policy decisions. “The main reason crises occur is not lack of statistics, but the failure to interpret them correctly and to take remedial action” (Caruana, 2012, p.3). The result has been a dramatic rethink within the economic analysis function encompassing new fields of research and disciplines where central bank economists are developing new approaches, methods and techniques in order to better support the policymaking functions. Underlying this is the need to have sound systems for acquiring and analyzing economic and financial data in order to respond timely to unforeseen developments. Statistics are not only vital tools for economists to serve policymakers, but their broader dissemination is important to achieve credibility, accountability and transparency which will reinforce the integrity and effectiveness of policy decisions.
1
2
2.
BACKGROUND
“The mission of the Bank for International Settlements (BIS) is to serve central banks in their pursuit of monetary and financial stability, to foster international cooperation in those areas and to act as a bank for central banks” (BIS, n.d., para. 3). The BIS started collecting International Banking Statistics (IBS) in the 1960’s, under the auspices of the Committee on the Global Financial System (CGFS) and with each subsequent financial crises, the identified data gaps prompted refinements. The LBS data were designed to provide comprehensive and consistent quarterly data on major banking systems’ funding and lending patterns. The main purpose of the data is to provide information on the role of banks and financial centers in the intermediation of international capital flows. The basic organizing principle underlying the reporting requirements is the residence of the reporting banks which conforms to balance of payments (BOP) and external debt methodology. Banks report their own international banking business, including international transactions entered into with any of their own affiliates (branches, subsidiaries or joint ventures).
On grounds of the regional influence and the importance of cross-border banking activity in South Africa, the BIS approached the South African Reserve Bank (the Bank) to participate and in 2009 South Africa became the forty-third member country to provide LBS data to the BIS. The development and implementation of a granular national dataset that flows into the global BIS dataset entailed a labour- and time-intensive process and the compilation of high quality statistics continue to require extensive data cleaning and quality checking.
3
3.
PROBLEM STATEMENT
In an effort to convert the global LBS output into a national asset, a number of central banks have started exploring ways to use institution-level data to support financial stability analysis, and in particular identify system-wide vulnerabilities and channels of contagion (Iazzetta & Manna, 2009). Currently no in-depth analysis of the South African LBS data is available as most of the resources are being devoted to the compilation of the data. The Economic Research and Statistics Department (ERSD) has recently launched a process of data, system and analysis rejuvenation and one of the key focus areas is to ensure that the resources employed to produce statistical outputs for International Organizations simultaneously add value to the strategic objectives of the department. Thus, in order to ensure the most efficient use of existing resources and knowledge deployed in the LBS data compilation and to keep abreast with international developments in this field it has become necessary to develop a sound and comprehensive suite of analysis.
4
4.
AIMS AND OBJECTIVES
There is a need to improve the understanding of the uses of the LBS dataset for South African banks (SA banks) which will inform the development of the analysis and research output. It relates not only to developing analysis techniques and research outcomes, but also to the understanding of how they feed into the broader macroeconomic framework, the financial stability regime, and ultimately into policy inputs.
The development of the LBS analysis suite has three separate but closely related objectives, namely: 1. Assessing the primary uses of the LBS data and determining the main contributory role within
a statistical department in a central bank;
2. Developing a quantitative framework for short-term structural analysis of LBS data; and 3. Generating analytical research outputs and integrating them into the existing body of
5
5.
RELEVANCE
The development of the LBS data analysis suite will contribute to the strategy of the ERSD, specifically with reference to its goal of in-depth analysis and research to improve measurement of the economy, which will in turn support the overall strategy of the Bank. The outcome of this project could also serve as a useful benchmark for other central banks, especially in emerging economies, who would like to expand their LBS data analysis.
Although the benefits emanating from the proposed study can be pervasive, it is important from an organizational point of view that they link with the overarching strategy of the organization. In this regard, the following strategic objectives have been identified within the ambit of the ERSD strategic vision:
Ex-post analysis of the financial stocks and flows of the South African banking sector;
Improved compilation of economic statistics in areas such as BOP and integrated economic accounts;
Monitoring and review of the South African economy within the international context; and
In-depth analysis and research to improve measurement methodology.
Taking the abovementioned strategic objectives into consideration, it is envisaged that the proposed study will complement the existing knowledge base on cross-border banking activity that currently exist within the central bank yielding the following main benefits:
1. Improving the understanding of the underlying methodological foundation of LBS data; 2. Contextualizing this data within other statistical domains, e.g. BOP;
3. Benchmarking and comparisons vis-à-vis other countries in terms of both overall market share as well as available categorization of the data for example by identifying major lending and borrowing sectors and maturity and currency composition;
4. Identifying economic trends that other banking statistics cannot fully capture, especially due to its focus on cross-border activity – in particular, the sensitivity to economic cycles in specific foreign economies and regions;
5. Tracking of sectors that account for build-up of risks, determining channels through which shocks are transmitted for early identification of large international banking flows that may require closer inspection;
6 7. Building a research database on South African LBS data that could provide useful insights
for policy and broader financial economy dynamics;
8. Developing a dissemination strategy that is aligned with the requirements of the different users; and
7
6.
LITERATURE REVIEW
This chapter reviews the theoretical literature found on the issue being studied. The following sections present the main strands of research in order to provide a general knowledge on the subject at hand and to facilitate further analysis of the LBS data from a South African perspective. The theoretical literature also guides the selection of the different variables and methods used in the analysis.
The literature review presented in this study relates to four main strands of research. Firstly, it covers studies conducted by International Organizations and other research bodies to determine the main uses of LBS data. Secondly, studies relating to broad policy and financial stability issues will be examined through the utilization of institution-level data in order to identify system-wide vulnerabilities and channels of contagion. Thirdly, the review is complemented by papers from several authors who have applied network analysis tools to determine financial linkages in global markets and their implications for the emergence and management of bank systemic risk, based on data on cross-border exposure. Finally, topical research articles and papers from other central banks are investigated to facilitate further analyses of the LBS data from a central bank perspective. Studies on main uses of LBS
Numerous analytical studies make use of BIS statistics for a wide variety of purposes and comparisons. Wooldridge (2002) found that it is of paramount importance since it presents a basis for key analytical uses of the statistics and it also provides a glimpse of how the statistics can be applied in a supplementary manner. Wooldridge’s paper addresses banking system-related issues in several broad areas including: facilitating the expansion of domestic monetary and credit aggregates; complementing traditional data sources on external debt and BOP; and analyzing banks’ country risk exposures and monitoring changes in financial intermediation. The author also acknowledges that although the LBS data are compiled with a specific purpose, it has a wide range of possible uses and these are further explored and outlined in the paper (Wooldridge, 2002). McGuire & Tarashev (2008) provide valuable insights on a variety of applications of the BIS IBS by looking at the evolution of the structure of international banking and its implications for financial stability on both domestic and international level. These studies serve as the departure point for determining the possible uses of LBS data and tailoring a suite of analysis for the Bank.
Studies on the use of LBS for financial stability purposes
Various researches have been done on the relationship between cross-border banking and financial stability. Allen et al. (2011) acknowledge the importance of cross-border banking data in their report
8 The paper by Weistroffer & Möbert (2010) provides a guideline on how the LBS can be used to calculate simple ratios at country level with the aim to assess possible vulnerability of lenders to cross-border exposures.
Research that utilized the BIS data to analyze currency positions include McGuire & von Peter (2009) and Baba, McCauley, & Ramaswamy (2009). These authors use the LBS data in the estimation of the size of funding mismatches which occurred in 2008 when short-term USD funding sources dried up. Lane & Shambaugh (2009) use data for a broad set of countries over the period 1990 to 2004 to compile and describe the currency composition of foreign asset and liability positions. In this work they discovered tremendous variation in the currency profiles of international portfolios. Their goal in the paper is to expand knowledge regarding data on currency composition of cross-border portfolios (Lane & Shambaugh, 2009).
Studies on network analysis tools using LBS
There are numerous papers from several authors who have used network analysis tools to determine financial linkages in global markets. Von Peter (2007) combines cross-border linkages into a global network and utilizes network methods to identify important banking centres. Weistroffer & Möbert (2010) apply the network perspective to data relating to BIS reporting countries in order to visualize various cross-border interlinkages. Fender & McGuire (2010) explore the extent to which the LBS can be used in the measurement of system-level funding risk and the monitoring of interlinkages in bank balance sheets across office locations. In their paper they show how the underlying structure of the LBS data allows for the monitoring of banking systems’ international funding and lending activities (Fender & McGuire, 2010). To various degrees, these papers all include some reference to the concept of interbank network and the extent to which the network is prone to contagion. These studies are of particular relevance as they could assist in developing a network analysis component for the overall South African LBS suite of analysis.
Studies by other central banks
Various central banks have utilized components of the LBS in topical research articles and papers. An article done by O’Connor (2004) from the Bank of England explores both locational and consolidated data and considers the importance of the United Kingdom (UK) within this market. The author further looks at the changes in the composition of the data over the last 10 years. Network topology techniques are utilized by the Bank of Italy to gain more insight into the manner in which a liquidity crisis spreads (Iazzetta & Manna, 2009). Coates, Everett, McNeill & Moloney (2015) provide an overview of the Irish IBS. Their paper outlines the framework which underpins the statistics and also describes the IBS. It furthermore looks at the methodological issues which influence the Irish data and then provides an evolution of the IBS for Ireland (Coates, et al., 2015).
10
7.
METHODOLOGY
7.1 M
ETHODOLOGICAL APPROACHThe previous chapter outlined the main strands of available theoretical literature, which have exploited the LBS data in some format to conduct various types of studies or analyses. In this chapter, we formulate the methodological approach on which the work project will be based. The study is anchored in a positivist paradigm which emphasizes a scientific and systematic approach to research and as such lends itself to the use of quantitative methodology (Gray, 2014). Quantitative research refers to the systematic empirical investigation of social phenomena using statistical, mathematical or computation techniques. The quantitative method is chosen because it is generally useful when studying large scale patterns or behaviors and when the identified subject of interest can be measured and quantified. Within the quantitative design context there will be utilization of a mixed mode approach combining exploratory and descriptive research. The following sections present information on the scope of the census based longitudinal data to be used as well as the proposed methods of data analyses.
7.2 D
ATA SOURCE AND CHARACTERISTICS OF VARIABLESThe data set to be used in the development of the suite of analysis is the BIS’s data on IBS - which is known to be the most comprehensive source of information on banks’ international assets and liabilities. Reporting banks supply data to an official authority in their respective country, usually the central bank, which then aggregates the data and submits it to the BIS for further aggregation, analysis and publication. The BIS provides guidelines to compilers in reporting countries with definitions and requirements for the reporting of data in order to facilitate the compilation of national data in a consistent and comparable way. Annexure I in section 13.1 contains the detailed reporting requirements for the LBS as provided by the BIS (BIS, 2015).
11 breakdowns) for all banks reported in the LBS by residence should equal the total claims and liabilities of all banks reported in the LBS by nationality.
SA banks’ total positions are further disaggregated by:
(a) Counterparty country
Reporters are requested to provide a full counterparty-country breakdown of banks’ financial claims and liabilities covering 200+ territories.
d) Currency
Reporting countries are requested to provide a breakdown of positions into domestic currency as well as individual foreign currencies. The minimum recommended currency breakdown includes the domestic currency of the reporting country, US dollar, euro, Japanese yen, Swiss franc, British pound, Pound sterling and a residual category.
(c) Counterparty sector
Reporters are requested to provide a counterparty-sector breakdown according to the following sectors: banks (inter-office, central banks); non-bank financial institutions; non-financial sector (non-financial institutions, general government, households); and unallocated by sector.
(d) Type of instrument
SA banks’ assets/claims are broken down into: loans and deposits, which comprise interbank deposits with and loans and advances (to banks or non-banks); holdings of debt securities; and other assets. Similarly, SA banks’ liabilities are broken down into: loans and deposits, which comprise interbank loans received and deposits (from banks or non-banks); own issues of debt securities; and other liabilities.
Due to the expansive nature of the BIS reporting template, a simplified overview of the South African LBS data is provided in table 7.1.
Reported breakdowns Locational by residency Locational by nationality
1. Reporting basis Unconsolidated data, including inter-office positions.
Unconsolidated data, including inter-office positions.
2. Reported positions Cross-border and domestic financial assets and liabilities of all resident banks and by type of reporting bank:
- Domestic banks
- All branches of foreign banks - All subsidiaries of foreign
banks.
Cross-border and domestic financial assets and liabilities by nationality of resident banks:
- Domestic banks
- All other BIS reporting bank nationalities.
3. Vis-à-vis country Residents and non-residents of 230+ individual countries.
12 Reported breakdowns Locational by residency Locational by nationality
4. Currencies Domestic and Foreign: USD, EUR, JPY, GBP, CHF and other.
Domestic and Foreign: USD, EUR, JPY, GBP, CHF and other.
5. Counterparty sector
Banks including monetary authorities;
Non-bank financial corporations;
Other non-banks: - Government;
- Non-financial corporations; and
- Households
Banks including monetary authorities;
Non-bank financial corporations;
Other non-banks: - Government;
- Non-financial corporations; and
- Households 6. Type of
instrument
Loans/deposits
Debt-securities: - Total; and - Short-term
Other assets/liabilities
Loans/deposits
Debt-securities: - Total; and - Short-term
Other assets/liabilities * South Africa’s LBS data covers the full 230+ individual counterparty country breakdown
Table 7.1 - Simplified overview of the SA LBS data
Reporting institutions, which currently consist of 31 registered SA banks, submit their returns electronically to the Bank on a quarterly basis and validation rules are applied to ensure correct reporting by respondents. In addition, electronic reports are used to check for consistency and excessive deviations in line items. This is followed up with banks for clarification and adjustment if necessary.
7.3 R
ESEARCH DESIGNFlowing from the literature review the first component of the research design will focus on grouping the main uses of LBS data into four broad categories, namely:
1. In-depth analysis of LBS balance sheet data by monitoring the growth of both aggregate and disaggregated (instrument, type of counterparty and residence of reporting institution) balance sheet data;
2. Ensuring internal and external data consistency and quality by performing a reconciliation analysis between LBS data and other source data and contextualizing the LBS data within other macroeconomic domains;
3. Identifying indicators of vulnerability, with particular focus on currency mismatches; and 4. Analytical research outputs.
13 characteristics, often with the use of simple descriptive statistics and graphical visualization techniques. These results may either form the basis of the initial description of the data as part of a more extensive quantitative analysis or may in itself be sufficient to satisfy the particular objectives of a study.
Microsoft Excel is a widely used software package which serves as a tool for data summary, presentation and other basic statistical analysis. It also provides a set of data analysis tools called the Analysis ToolPak which can be used to develop more complex statistical analyses. The study will commence with one of the most basic approaches namely performing a first-level analysis of the absolute nominal stock data obtained from the South African LBS data. Thereafter a breakdown by instrument, sector and residence of reporting institution will allow a more in-depth analysis of the balance sheet data. Peer group analysis will provide a useful tool to identify: banks’ underlying changes in the aggregate balance sheet; sectoral concentrations in lending for particular types of banks; the degree to which different groups of banks have interbank exposures; and finally it guards against overlooking trends among smaller institutions that would make little contribution to aggregate growth. The main goal of this type of analysis is to monitor the growth of various components as well as the changes within these segments.
The analysis will be based on calculating levels, proportional contributions and growth - for example determining the trend followed by each instrument/sector over the past few quarters, comparing with the previous quarter as well as the same period one year earlier. One way of analyzing internal and external consistency and quality of LBS data can be through conducting mirror exercises by comparing the stock of deposits reported on the asset side of the balance sheet by the banking system of country i vis-à-vis the banking system of country j. This should be equal to the stock reported in the liability side of country j versus country i. For this particular study a customized and confidential data set made available by the BIS which allows for bilateral disaggregation will be used. The final component of the study will transform the produced quantitative analysis into research output by contextualizing and relating the analytical results to the current macroeconomic and financial environment in a written format. In addition, this part of the study will also develop a dissemination strategy to internal and external stake holders.
14
8.
ANALYSIS AND PRESENTATION OF RESULTS
This chapter applies the techniques discussed previously in order to achieve the objectives set out in chapter 4. The following section is divided into four subsections which will present the findings of the work project.
8.1
I
N-
DEPTH ANALYSIS OFLBS
BALANCE SHEET DATAThe quantity and dimensions of the available LBS data far surpass the ability to interpret such voluminous data without condensing it in some form. The first step in the development of the LBS analysis suite would be to understand the data set by summarizing its main characteristics with the use of simple descriptive statistics and graphical visualization techniques. Thereafter the data will be explored in order to discover underlying patterns and trends.These results will form the basis for the routine monitoring and presentation of a few well-chosen summary measures which will be discussed in the following sub-sections.
8.1.1 Contextualizing SA banks’ international banking activities
The analysis commences with a review of the evolution of SA banks’ gross foreign assets and liabilities and the resultant net foreign asset/liability position. Figure 8.1 depicts the total claims as well as liabilities of SA banks, distinguishing between domestic and foreign/non-resident positions, since end-2009.
Figure 8.1 – SA banks’ resident and non-resident positions 2009 – 2015
15 liabilities as at end December 2015. This is significantly smaller than that of a country such as the UK where non-resident assets and liabilities constituted 40,6 and 44,0 per cent respectively of their total assets and liabilities as at end December 2015. As illustrated in figure 8.1, SA banks’ non-resident assets mostly exceeded non-resident liabilities from 2009 to 2015 resulting in a positive non-resident net asset position, which is completely offset by a negative resident net asset position. In general, SA banks tend to have diverse funding structures based on their operational models and strategic views and these structures remain relatively constant over the short to medium term. The larger banks generally raise excess Rand denominated funding (largely in the form of deposits), in the domestic market which is then swapped into foreign currency, mostly US dollar, and placed abroad (mainly in the form of deposits with and loans and advances to non-residents bank- and non-financial corporate sectors).
As mentioned, SA banks are less internationally active than their international counterparts. In spite of this, “data on cross-border exposure can greatly benefit the assessment and understanding of bank systemic risk by providing a benchmark vis-à-vis other countries in terms of both overall market share as well as categorisation such as lending and borrowing sectors and maturity and currency composition, provided in the data. In addition, it serves as a powerful tool for spotting economic trends that other banking statistics fail to capture” (de Beer, 2015, p. 15). LBS data affords the analyst the possibility to simultaneously ascertain the nationality of banking groups; the location of the groups' offices; and the residence of their counterparties. This integrated view enables deeper analysis of the endogenous or exogenous shock transmission across countries via the banking channel.
To further investigate the analytical possibilities of the LBS data, the second step in the study will be to decompose net foreign assets in order to identify the main components which will form the basis for the analysis.
8.1.2 Analysis of LBS components
The analysis of the different components of the LBS data mainly hinges on four divergent but interlinked components – residency and nationality; counterparty analysis; instrument breakdown; and currency composition. The following sub-sections will provide more detail on the relevance of each of these components.
8.1.2.1 Residency and nationality
16 From the LBS by residency data presented in table 8.1 below, we see that the South African banking system has the largest international asset positions vis-à-vis the main financial centres, notably the UK, United States and Isle of Man. Together, these positions account for a significant portion of the SA banks’ total net international asset position.
International Assets
International Liabilities
Net International asset position
R bill
Value in R bill
% of Int. assets
Value in R bill
% of Int. liabilities
Total 749,9 100 654,9 100 95,0
Of which:
United Kingdom 310,5 41,4 299,6 45,7 10,9
United States 73,7 9,8 39,6 6,0 34,1
Isle of Man 63,3 8,4 62,8 9,6 0,5
Nigeria 31,3 4,2 8,7 1,3 22,6
France 30,0 4,0 20,4 3,1 9,6
Developing Africa and
Middle East 119,9 16,0 71,9 11,0 48,0
Rest of the countries 121,2 16,2 151,9 23,2 -30,7
Table 8.1 – SA Banks’ International financial position by location as at end December 2015 Over the past few years, there has been an increase in South African sourced funding destined for business activity in the rest of Africa. Foreign asset exposure to Africa rose by 50,3 per cent between December 2014 and December 2015, while liability exposure to Africa rose by 40,8 per cent over the same period. Figure 8.2 shows SA banks’ non-resident asset and liability exposure to Developing Africa and Middle East since end-2009. Despite a continuous upward trend in growth, when expressed as a ratio of South Africa’s total International Investment Position (IIP) asset position at the end of 2015, it only represents 1,9 per cent, which is relatively insignificant.
17 From the LBS by nationality data in figure 8.3, we see that South African controlled banks have the largest share of SA banks’ total non-residents assets and liabilities, accounting for 70,0 and 67,8 per cent of the total respectively at end December 2015. This is followed by British, American and Chinese banks.
Figure 8.3 – SA banks’ non-resident assets and liabilities by nationality as at end December 15 Upon analyzing the longitudinal data in table 8.2, it is evident that almost all SA banks’ non-resident asset and liability positions increased, with parent company’s headquartered in South Africa increasing the most.
Nationality of reporting bank:
Non-resident assets (Value in R billions)
Non-resident liabilities (Value in R billions) Dec 13 Dec 14 Dec 15
Year-on-year
change
Dec 13 Dec 14 Dec 15
Year-on-year change
United Kingdom 87.3 95.2 117.9 22.7 59.2 70.6 100.0 29.4
Switzerland 0.0 0.0 0.0 0.0 0.4 0.5 0.5 0.0
South Africa 372.1 410.5 525.2 114.7 257.8 366.2 443.8 77.6
Portugal 0.2 0.4 0.5 0.1 0.1 0.2 0.5 0.3
India 1.2 2.5 3.6 1.1 2.1 3.7 5.6 1.9
France 0.9 1.3 7.2 5.9 1.2 2.2 7.5 5.3
China 0.1 0.1 0.3 0.2 0.6 1.1 1.0 -0.1
Bahrain 0.0 0.0 0.0 0.0 0.0 0.0 0.0 0.0
Luxembourg 0.0 0.0 0.0 0.0 0.1 0.1 0.0 -0.1
United States 19.6 20.7 59.8 39.1 19.0 30.3 44.3 14.0
Germany 8.0 5.8 9.9 4.1 11 10 13 3.0
Greece 0.0 0.1 0.2 0.1 1 1 1 0.0
China 12.6 16.4 25.3 8.9 6 12 38 26.0
18 Monitoring of LBS by nationality statistics is especially important from a risk perspective as it provides insight into who is making the underlying decision, who is taking on the risk and who needs to hold sufficient capital to cover global potential losses. The next section investigates the LBS counterparty data in more detail by specifically looking at the sector breakdown.
8.1.2.2 Understanding SA banks’ counterparties
There is a focused and growing importance of detailed counterparty requirements in official statistics. The LBS data provides detailed information on the countries in which SA banks' counterparties reside as seen in the previous section, as well as their sectors of activity which allows for a thorough risk build-up analysis - specifically within the non-bank private sector. The recent financial crisis highlighted the importance of not only focusing on counterparty countries, but also on counterparty sectors. For example, even if a specific economy shows no apparent vulnerabilities, sector weaknesses can still be channelled off-shore via cross-border bank exposures. The latter could have wider systemic implications for financial stability. For this reason it is worthwhile to conduct an analysis of the net positions (assets minus liabilities) per counterparty sector as depicted in figure 8.4.
Figure 8.4 – SA banks’ net positions per counterparty sector as at end December 2015
19 R billions
Country
Net lending(+)/
Net borrowing(-)
By counterparty sector:
Banks Non-bank
financial Non-financial
United States 34,1 17,9 -0,1 16,3
Nigeria 22,7 13,9 -1,3 10,1
Ghana 15,1 -0,6 1,5 14,2
Zambia 11,1 -1,1 -0,1 12,2
United Kingdom 10,9 18,2 -9,5 2,2
Saudi Arabia -14,1 -14,1 -0,9 0,0
China -11,2 -12,1 -0,8 1,7
United Arab Emirates -7,4 -10,9 0,8 2,7
Bahrain -6,2 -5,7 -0,5 0,0
Hong Kong -5,5 -5,5 -0,1 0,1
Table 8.3 – Top 5 net lending and borrowing countries by counterparty sector as at end December 2015
From these types of analyses, it is possible to obtain detailed information on the counterparties involved in international banking activities vis-à-vis SA banks which is crucial in the monitoring of risk build-up. The next section looks at SA banks international banking activity broken down by instrument category.
8.1.2.3 Instrument breakdown: Monitoring sources of funding
The LBS instrument breakdown provides longitudinal data for the main instrument categories namely deposits/loans; debt securities; and other assets/liabilities, which is well-suited for studying the non-resident lending/funding behaviour of SA banks. Figure 8.5 illustrates SA banks’ non-non-resident assets and liabilities, broken down by instrument.
20 From the graphs in figure 8.5 it is evident that within the three reported asset categories, growth in SA banks’ aggregate cross-border claims from December 2013 to December 2015 has predominantly been driven by an increase in loans to and deposits with non-residents and more recently other assets. This was the same case on the liability side, where foreign liabilities increased by 31,5 per cent on an annual basis, mostly on account of the same instruments. As is evident, the LBS liability data provide extremely useful information on the funding model of SA banks. It is very important to monitor it as an increasing reliance on non-traditional sources of funding i.e. funding other than deposits, can often serve as an indication of a build-up of risk (Hahm, Shin & Shin, 2013). Banks resident in South Africa rely mainly on deposit and loan funding, while other funding instruments are more homogenous across both resident and non-resident banks.
Another useful extension is to view South African banks’ relative asset/liability position against non-residents for the deposit/loan instrument category. At the end of December 2015, the share of deposits/loans from non-residents as a percentage of SA banks’ total liabilities to non-residents amounted to 66,6 per cent. However, despite the fact that there has been a gradual increase in deposits/loans from non-residents, the magnitude of loans extended to/deposits with non-residents surpassed that of non-resident deposits with/loans to SA banks, resulting in a marginal positive loan-to-deposit gap vis-à-vis non-residents, as depicted in figure 8.6.
Figure 8.6 – Non-resident loan-to-deposit ratio since end-2009
21 In conclusion of this section, the analysis of the LBS instrument breakdown provides a valuable overview of SA banks aggregate lending/funding by broad instrument type, which is particularly useful in monitoring the funding models of SA banks from a risk perspective. The next section will look at the fourth component in the LBS analysis, which is the foreign currency composition.
8.1.2.4 Monitoring foreign currency exposure
One of the unique features of the LBS data is the currency breakdown, which allows for a detailed currency source and use analysis. It serves as a useful tool in analysing possible imbalances in funding markets i.e. the extent to which some banks invest in one currency whilst securing funding in another. It is however important to note that whilst such funding imbalances could potentially lead to liquidity risk exposure, it does not automatically imply associated currency risk due to the fact that banks generally hedge currency mismatches in asset and liability compositions. The LBS data unfortunately does not provide detail on these hedges as it only covers on-balance sheet asset and liability positions. The breakdown by currency shows that SA banks’ total assets and liabilities are predominantly rand denominated, followed by the US dollar. Figure 8.7 provides a breakdown of SA banks’ total assets and liabilities per currency.
Figure 8.7 – SA banks’ total assets and liabilities per currency since 2013
A major advantage of the LBS currency breakdown is that it allows for an analysis of various dimensions of global banking e.g. the importance of major international currencies in cross-border banking activity and currency exposures of reporting banks. It furthermore allows for an analysis of currency mismatches, which is covered in more detail in section 8.3.1 of this work project.
22 analytical perspective. In the subsequent section we will discuss the main methods that will be utilized to monitor and study the developments in these components.
8.1.2.5 Assessing and explaining developments in LBS data
In this part of the work project, trend analysis will be used as the main method to analyse data movement patterns over time and to identify trend anomalies that causes deviations from the pattern or large fluctuations. Although conclusions cannot be mechanically drawn from such an analysis, it serves as a good initial measure of short-term developments in the data. Thus, the evolution of growth in certain variables over time and possible anomalies observed might be the first sign to warrant deeper and more specialised analysis.
The key growth rate for measuring the developments in LBS data will be the annual growth rates of the relevant variables because their use holds several advantages, namely they:
Serve as a natural comparison for international statistics;
Attract significant attention in public debate;
Avoid the need for seasonal adjustments.
It is however important to differentiate between transactional growth and valuation effects. This is especially true for a country like South Africa which has a very liquid currency which can be prone to periods of volatility associated both with domestic as well as international developments.
Furthermore, simultaneous comparison of different growth rates will ensure that underlying data trend changes are detected timeously. This would also lessen the problem of differentiating between base effect movements and genuine developments when analysing changes in growth rates. Annual growth rate analysis will be augmented by shorter-term growth rates and nominal level analysis (quarter-on-quarter changes in values) in order to determine the medium-term character of the LBS data.
A first step towards explaining developments in the LBS data (components and counterparts) will be to link the movements in these variables to factors which are either occasionally or systematically driving these developments. The developments in the data will be supplemented by discussions throughout the statistical value chain between the data providers and compilers in order to obtain a better understanding of the business developments underlying the data. This intelligence insight, together with the results of the analysis, will be reflected in a quarterly LBS report.
8.1.2.6 Publication and dissemination of analysis results
The dissemination of official statistics is an essential feature of statistics. Therefore the results from the LBS analysis will be converted into a quarterly report, which will form part of the ERSD’s current series of internal statistical analysis reports. A draft version of the proposed quarterly report is attached as Appendix I.
23 This concludes section 8.1, where the main characteristics of the LBS have been summarised and explored to illustrate how underlying patterns and trends in the data can be investigated. The outcomes of the results are presented in a quarterly report, which will form the basis for the routine monitoring of a few well-chosen summary measures.
8.2
E
NSURING INTERNAL AND EXTERNAL DATA CONSISTENCY AND QUALITY AND CONTEXTUALIZINGTHE
LBS
DATA WITHIN OTHER MACRO-
ECONOMIC DOMAINSThis part of the work project augments the previous analysis by identifying further uses of the LBS. The section is subdivided in line with two possible main auxiliary uses of the BIS data namely 1) serving as a quality assurance tool in the statistical compilation process and 2) complementing the existing macro-economic datasets compiled within the central bank. Each of these is discussed in the following sub-sections.
8.2.1 Ensuring consistency and quality
Good quality statistics form the head cornerstone of any type of analysis or research and ultimately serves as the basis for decision making. Therefore, data compilers have a direct responsibility to ensure the integrity and quality of the statistics they produce. One of the ways in which central banks can improve the quality of their datasets is by using other available data sources for cross validation purposes. The following two sections will investigate the use of the LBS data, firstly to validate against external data providers namely the BIS reporting countries (the so called “mirror exercises”) and secondly against internal data sources within the Bank.
8.2.1.1 Mirror exercises
In order to reconcile the data reported to the BIS by the various reporting agencies with that reported by the Bank, the Global LBS database can be utilised to perform mirror exercises which can serve as an additional measure to control for consistency and quality of data between BIS reporting agencies. These exercises are based on the principle that a debt (liability) to a borrower is an asset to a creditor. This implies that the stock of interbank liabilities of the banking system of country A vis-à-vis the banking system of country B must be the mirror of the stock reported in the asset side of country B versus country A. In principle, in the case of an instrument such as deposits/loans it should be relatively straightforward to determine a one-on-one relationship between the asset position of one country (country A) vis-à-vis the liability of another country (country B).
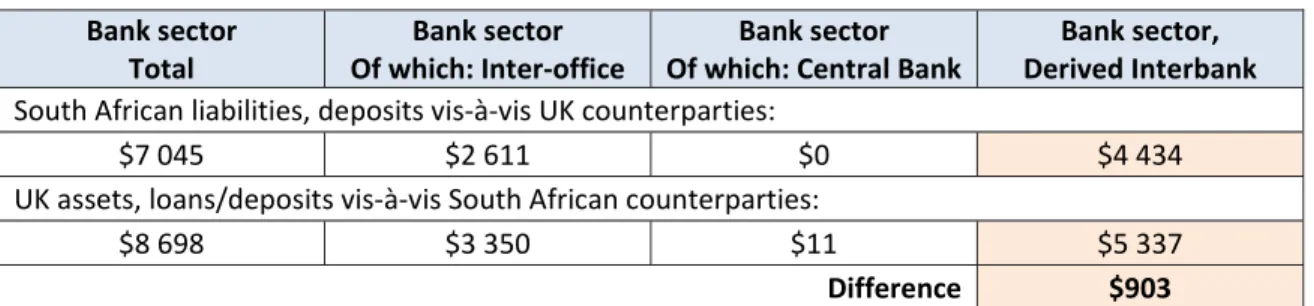
This exercise can be conducted by downloading mirror data on the bank sector’s deposits/loans for counterparty countries from the BIS online facility2. Access to this facility is obtained through participation as contributing reporting agency. Table 8.4 provides an example of such a comparison for South Africa using the UK as counterparty country as at the end of December 2015.
2
24 US$ millions
Bank sector Total
Bank sector Of which: Inter-office
Bank sector Of which: Central Bank
Bank sector, Derived Interbank South African liabilities, deposits vis-à-vis UK counterparties:
$7 045 $2 611 $0 $4 434
UK assets, loans/deposits vis-à-vis South African counterparties:
$8 698 $3 350 $11 $5 337
Difference $903
Table 8.4 – Mirror data for SA banks’ deposits/loans vis-à-vis UK as at December 2015, Source: BIS database
The first step in the exercise involves a calculation in order to obtain the interbank positions as the bank sector in the BIS data also includes inter-office and central bank positions. This can be done by simply subtracting the latter sub-sectors from the total bank sector data. As indicated in table 8.4.5 there is a difference of $903 million in the data for December 2015 that is being reported by the respective countries. The next step in the process would involve the scrutiny of the data contribution for South Africa to determine whether there are any reporting errors. Should this step reveal no obvious reporting errors and omissions, the next step would be to liaise with the UK’s LBS reporting agency personnel directly in an attempt to resolve the reporting inconsistency.
These types of exercises will contribute to the overall quality and consistency of the LBS data and will ensure that the LBS data that is being used for research and decision making purposes are reliable. 8.2.1.2 LBS as quality assurance mechanism for source data
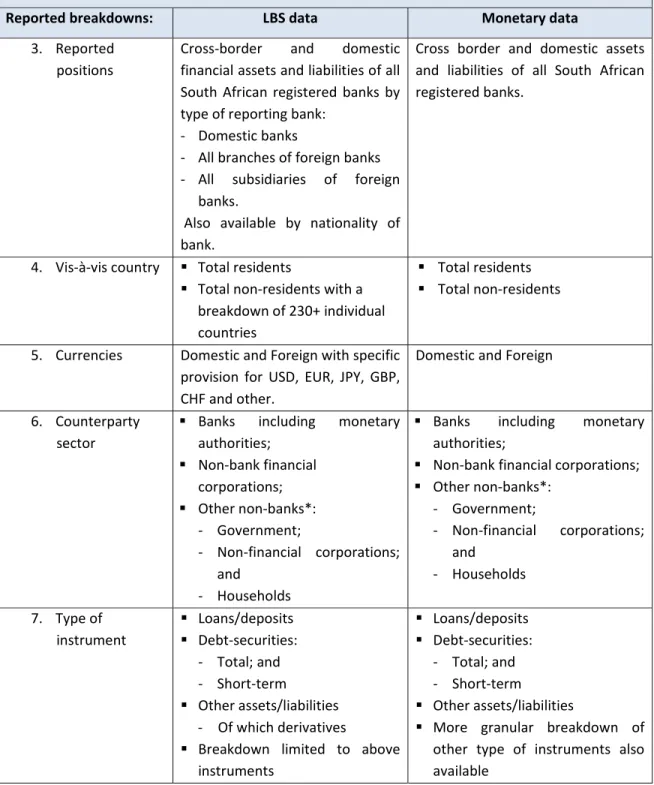
Up to 2009, SA banks’ on-balance sheet exposures were measured using one main source of data, namely the BA900 survey. The BA900 statistics3 are used to compile the national monetary and credit aggregates, the balance sheet of the Monetary and Financial Institutions (MFI) sector and it also feeds into the sector accounts for the country. The monetary data makes it possible to continuously review monetary and credit developments through the calculation of money supply and its counterparts and this information is crucial for the conduct of monetary policy and it also plays an important role in monitoring the stability of the financial system. The introduction of the LBS returns in 2009 provided an additional source of balance sheet data for the South African banking system and with it the possibility to expand on the existing outputs. Table 8.5 provides a comparison of the main characteristics of these two data sources.
Relationship between sources of SA banks’ balance sheet data
Reported breakdowns: LBS data Monetary data
1. Target population
All South African registered banks -Excluding mutual banks
All South African registered banks -Including mutual banks 2. Reporting basis Unconsolidated data
Including inter-office positions
Excluding non-financial assets
Unconsolidated data
Including inter-office positions
Including non-financial assets
3
25 Relationship between sources of SA banks’ balance sheet data
Reported breakdowns: LBS data Monetary data
3. Reported positions
Cross-border and domestic financial assets and liabilities of all South African registered banks by type of reporting bank:
- Domestic banks
- All branches of foreign banks - All subsidiaries of foreign
banks.
Also available by nationality of bank.
Cross border and domestic assets and liabilities of all South African registered banks.
4. Vis-à-vis country Total residents
Total non-residents with a breakdown of 230+ individual countries
Total residents
Total non-residents
5. Currencies Domestic and Foreign with specific provision for USD, EUR, JPY, GBP, CHF and other.
Domestic and Foreign
6. Counterparty sector
Banks including monetary authorities;
Non-bank financial corporations;
Other non-banks*: - Government;
- Non-financial corporations; and
- Households
Banks including monetary authorities;
Non-bank financial corporations;
Other non-banks*: - Government;
- Non-financial corporations; and
- Households
7. Type of instrument
Loans/deposits
Debt-securities: - Total; and - Short-term
Other assets/liabilities - Of which derivatives
Breakdown limited to above instruments
Loans/deposits
Debt-securities: - Total; and - Short-term
Other assets/liabilities
More granular breakdown of other type of instruments also available
26 Three main approaches are followed for manual validation of data:
Internal validation
The methodology used to compile the balance sheet statistics is in compliance with the methods and sources described in the System of National Accounts (SNA) 2008 manual, Monetary and Financial Statistics Manual and Compilation Guide (MFSMCG) and the Guide to the International Banking Statistics. In turn, the rules and guidelines applicable to the compilation of the information as well as the concepts and classification and sectorization (currencies, instruments, maturities, institutional sectors, etc.) underlying the compilation of these statistics are laid down in the Regulations relating to banks as published in Government Gazette No 35950 of 2012 (amended from time to time). During this validation approach, data consistency is ensured through the internal validation of concepts, definitions and classifications in line with the prescribed manuals, regulations and guidelines.
Temporal validation
This process includes an analysis of developments over time. All reporting institutions - in this case each bank’s - short-term data trends are studied and compared to identify outliers. Respondents are requested to validate any anomalous values and to provide explanations for variances in short-term data trends.
External validation
The last approach involves cross-checking against other sources of data that are also being reported to the ERSD by the reporting institutions e.g. data reported for supervisory purposes. In this final approach, it is possible to cross-check source data reported in the scope of balance sheet statistics against information on the data reported for: (i) supervisory purposes and (ii) BOP.
The results generated from each of the aforementioned steps are incorporated together with the explanations and clarifications provided by the reporting entities and stored in a central application. This final step in the validation process serves as the certification that the data fullfills the necesssary requirements and is suitable for official statistical use.
Due to the significant similarities as depicted in table 8.5 between the two data sources, it is possible to use the LBS returns as a cross-check mechanism during the external validation process to validate the monetary data and vice versa. One of the aims of this work project is to optimally utilise the LBS data by creating automatic cross link reports between the two data sources which can improve and ensure the quality of data reported in both data sets. Refer to Appendix II for a high-level comparability outline. These reports will then automatically form part of the external validation process and if any discrepancies are detected during this phase, the reporting institution will be notified and requested to revise their data in cases where a one-on-one comparison is possible, or alternatively to provide explanations for mismatches.
8.2.2 LBS as supplementary data source for other macro-economic datasets
27 substantial auxiliary information in a relatively short period of time. The following sub-sections will elaborate on the benefits of using the LBS as auxiliary information source for specific users. 8.2.2.1 Expanding the monetary and credit aggregates
One way in which the LBS statistics can be utilised to facilitate the extension of monetary and credit aggregates is by providing data on banks’ cross-border and foreign currency positions. Conventional definitions of monetary aggregates include only deposits of residents denominated in domestic and foreign currency held in domestic banks, whilst deposits held by residents in banks located in foreign countries are excluded. Through the use of LBS data on banks’ cross-border liabilities to non-residents, extended measures of the monetary stock can be compiled and monitored as part of the monetary analysis process (Monticelli, 1993). From a credit perspective domestic credit aggregates generally include only loans and debt securities of banks vis-à-vis resident counterparties whilst the LBS data provides useful auxiliary information on cross-border borrowing by non-bank residents. By using this data, cross-border credit and foreign currency credit measures can be compiled and monitored. The different combination of breakdowns allows for an enriched analysis of the credit exposures of the domestic banking sector in terms of regions, counterparty sectors, financial instruments, currency and funding sources.
Although each of these data sets can individually be used to explore particular aspects of SA banks’ exposures, they can provide a much more detailed assessment of the risks facing the South African banking system when combined.
8.2.2.2 Developing links between LBS and external account data4
Banking sector data together with data on external account positions, transactions and revaluations form the foundation of central bank statistical data suites. The interrelationship between external transactions and domestic monetary developments has long been at the core of monetary analysis, among both theoreticians and central bank practitioners (Bê Duc, Mayerlen & Sola, 2008). The relevance of this statement has gained greater significance with the increased pace of globalization, especially the deepening financial linkages between national economies. This increased co-dependence also highlights the need to continually develop the suite of data and validation sources which underlies the external account data. Due to the fact that the LBS data is compiled on a resident basis which links to the methodology underlying the external account data, it makes sense to investigate and where appropriate exploit all the possible synergies and cross-pollination obtainable from LBS data to augment the existing external account data suite. As is already the case in various national statistical agencies, the LBS data can be used to enhance various BOP estimates. This strain of thought received further impetus with the advent of the global financial crisis of 2008 which accelerated the requirement for better data on major banking systems’ funding and lending patterns. In line with this reasoning and in order to establish possible synergies between the LBS and external account data for South Africa, there has to be a focus on the potential uses of the LBS data from an external account perspective – which will be discussed in this section.
One of the immediate and main advantages that accrue to the external account data suite would be the holistic view of the SA banking sector provided by the LBS dataset – it allows macroeconomic
4
28 statisticians to view the full value chain from lender to borrower, across instruments, sectors and national economies. The banking sector is a pivotal gateway through which large capital flows enter and leave a country and this sector is a key contributor to the country’s external account data. In South Africa’s case there has up to now been a relatively limited development of the geographic, instrument and sector footprint of the functional classifications contained in the South African external account data set. The SA banking sector plays a major role in the facilitation of liquidity within South Africa and also in cross-border flows and therefore obtaining additional information on these positions could significantly enhance the understanding of the development in the external accounts.
One of the main drivers behind the LBS data suite development was in fact the need to provide more detailed information on the role of banks in the intermediation of international capital flows and to measure lending flow breakdown of the banks’ resident as well as non-resident asset and liability positions. Figure 8.8 provides an overview of the detailed breakdown provided by the South African LBS database and how it could potentially augment existing external account data.
Figure 8.8 - Links between LBS and external account data
Households Banks Non-bank financial institutions Non-financial institutions Government Loans (includes all types of
loans) Debt securities (bought = asset; sold = liability) Other assets/ liabilities Asset and liability stock position at end of each quarter Broken down by residency South African ROW Broken down per instrument Broken down per sector Ext e n siv e C o u n try br eak d ow n per instr um e nt Co ul d pos si b ly b e use d i n q uar ter ly IIP com p il at ion LBS data could serve
as a cross-check for foreign debt
data
Could be used
t o ex p a n d d e ri vativ e sect or and cou n tr y br eak d o w n f o r us
e in q
29 The main advantage lies in the combination of variables contained within the LBS data – residency (geographic delineation), sector, instrument and currency. In the pre-crisis period it was primarily important for emerging market economies to manage their domestic economies prudently in order to attract the necessary capital flows to cover their increasing capital account deficits, with global systemic imbalances and risks receiving less attention. The advent of the crisis radically altered the statistical requirements – whilst the attraction of capital flows still remained a high priority, the global linkages within which national economies are bound has become of paramount importance. It is still a necessary but no longer a solely sufficient condition to attract capital – now it has also become important to identify from which country funding was obtained, in what currency, from which counterparty sector and with what instrument – the reason being that all of these factors aggravate or mitigate risks for the national economy. Insofar banking data is concerned the LBS data goes a long way in filling this increased statistical requirement.
There are various enriching data dimensions to be obtained from the South African LBS data set. As previously mentioned, one of the most rewarding characteristics of the LBS data is the detailed geographical breakdown that it provides. The breakdown is particularly suitable to assist in a quarterly compilation of a geographical breakdown of banking positions in the external accounts data for South Africa. Having this additional dimension in the South African external account data could provide additional insight into the economies from which South Africa attract its capital flows into the domestic banking sector and also to (and through) which economies SA banks direct their outward flows. Having deeper insight into this network of international banking linkages could potentially play a crucial role in understanding the systemic stability risks facing the South African banking sector.
The current LBS instrument breakdown – although more limited than required in the IIP – could also provide broad reference proxies for bank data contained within the existing IIP. Furthermore, the currency breakdown provided by the South African LBS dataset could assist with the calculation of revaluation estimates for the external account data. The external account data covers various instruments and currencies. The LBS data connects the assets and liabilities relating to non-residents and also provides a detailed breakdown of the composition. Thus currency revaluation estimation can be constructed based on a basket of currencies vis-à-vis the South African rand which is much more accurate than the currency breakdown obtained from the normal monetary survey from which the external accounts data vis-à-vis the South African banking sector is sourced.
The derivative data which is an “of which” component within the other asset and liability data of the LBS data could also provide supplementary elucidation on the size and currency dispersion of the South African OTC derivative market which is highly concentrated within the banking sector in South Africa. This could provide additional validation of the structure of this market, the currency dispersion and the volatility.