Infant malnutrition and obesity in three
population-based birth cohort studies in
Southern Brazil: trends and differences
Desnutrição e obesidade infantis em três coortes
de nascimentos no Sul do Brasil: tendências e
diferenças
1 Programa de Pós-gradu-ação em Epidemiologia, Universidade Federal de Pelotas, Pelotas, Brasil. 2 Programa de Pós-graduação em Saúde e Comportamento, Universidade Católica de Pelotas, Pelotas, Brasil.
Correspondence A. J. D. Barros Programa de Pós-gradu-ação em Epidemiologia, Universidade Federal de Pelotas.
Rua Marechal Deodoro 1160, 3o andar, Pelotas, RS 96020-220, Brasil. [email protected]
Aluísio J. D. Barros 1 Cesar G. Victora 1 Iná S. Santos 1 Alicia Matijasevich 1 Cora L. Araújo 1 Fernando C. Barros 2
Abstract
The aim of this study was to compare the evolu-tion of nutrievolu-tional deficits and overweight in one-year-old children from three birth cohorts started in 1982, 1993 and 2004 in Pelotas, Southern Bra-zil. Samples from the 1982 and 1993 cohorts and all children from 2004 were weighed and mea-sured, and their mothers interviewed. Anthro-pometric deficits and overweight were assessed using both NCHS and WHO growth standards. A comparison of the existence of nutritional defi-cits showed that, after a decline between 1982 and 1993, its prevalence stabilized between 1993 and 2004. Across the whole period, a decrease in all deficits was observed. Obesity, on the other hand, increased. A deficit in the ratio of body length to age was found to be strongly associated with family income. The group with income be-low one minimum wage was the only to present a significant reduction of stunting during the study period. The most significant improvements in the reduction of nutritional deficits occurred in the first half of the study period, while social differ-entials remained. Fighting malnutrition is still necessary among the 40% of the population con-sidered poor, and must be accompanied by efforts to combat overweight which is being observed in all social strata.
Malnutrition; Overweight; Anthropometry; Co-hort Studies
Introduction
Infant malnutrition has been declining in almost all regions of the globe, a phenomenon closely followed by a concomitant increase in obesity. A global study of trends in malnutrition, measured as height-for-age deficits, showed an overall ten-dency towards reduction, with West and East Af-rica and Central AmeAf-rica being the exceptions. One of the strongest decreasing trends in height-for-age deficits worldwide was detected in South America, where estimated prevalence fell from almost 25% in 1980 to below 5% in 2005 1.
Overweight, on the other hand, is clearly on the rise, and several studies of the adult popula-tion point to an alarming scenario 2,3,4. Although studies involving children are less frequent, esti-mates from an international survey suggest that Latin America is the region with the greatest prevalence of overweight among children un-der the age of five 5. Moreover, in South America the study estimated that 4.9% of children had z-scores for weight-for-length higher than 2 standard deviations. In Brazil, earlier studies carried out in the city of Pelotas, Southern Bra-zil, using the same criteria had already indicated an increased prevalence of overweight, which reached 8.1% of children in 1993 6.
in Brazil. In each of these years, either all the city’s children or representative samples were studied at birth and followed throughout their first year of life. The study therefore allowed us to compare prevalence rates for nutrition defi-cits and overweight across a 22-year period. We also present data on how nutritional status var-ied according to socioeconomic status, sex, and birth weight.
Methodology
Data collection in the three cohorts was carried out using similar methods, which allowed results from the three studies to be compared directly 7. The 1982 and 1993 studies begun with the iden-tification of hospital births throughout the entire year – totaling 6,011 and 5,304 births, respectively – and proceeded with follow-ups of samples of these children. The 2004 study began in a similar fashion, including 4,287 births, but attempted to locate all cohort subjects at ages three months and 12 months.
The first follow-up of the 1982 cohort took place in early 1983. This follow-up included chil-dren born from January to April 1982, who were then aged between 9 and 15 months (54% were in the 11-13 months age range).
For the 1993 cohort, on the other hand, we sought to evaluate at age 12 months a systematic sample of about 20% of all live births, in addition to all children born weighing under 2,500g, vis-iting a total of 1,364 children. In this follow-up, 1,347 children (99%) were in the 11-13 months age range. In the present analyses, data are weighted so that our results reflect the prevalence of mal-nutrition and overweight in the population.
The 12-month evaluation of the 2004 cohort included all subjects. Visits were planned so that children were seen within a window of at most 7 days before or after their first birthday. We were able to carry out 93% of visits within this window.
The anthropometric evaluations described in the present article were carried out at around 12 months. Weight was measured by trained interviewers, whenever possible with the child undressed. In case the mother did not allow the child to be totally undressed, any clothing worn was noted, and had its weight subsequently de-ducted from the measured weight. In the 1982 and 1993 cohorts, children were weighed us-ing Salter CMS mechanical scales (Salter, Ton-bridge, United Kingdom) with a 25kg maximum and 100g precision. In the 2004 cohort, children were weighed together with their mothers af-ter the mother had been weighed alone, and the weight was calculated as the difference
be-tween the two measures. Tanita electronic scales (Tanita, Tokyo, Japan) with a 150kg maximum and 100g precision were used in this study. In all studies, scales were calibrated on a weekly basis using standard weights. Length was measured for all children, regardless of age, in supine po-sition using an AHRTAG portable infantometer with 1mm precision, that was custom built from wood for the purpose of these studies. In all three cohorts, interviewers underwent training and standardization in anthropometric tech-niques, and 5-10% of interviews were repeated by supervisors.
Based on the collected data, we calculated z-scores for length-for-age, weight-for-age, and weight-for-length, according to the United States National Center for Health Statistics (NCHS) ref-erence 8. The same anthropometric indicators were recalculated based on the growth curves published by the World Health Organization (WHO) in 2006 9, using Anthro 2005 software, which can be downloaded from the WHO web-site (http://www.who.int/childgrowth/software/ en/). Children with z-scores below -2 for any of the indicators were considered to be under-weight. Overweight was defined as weight-for-length z-score above +2 standard deviations. Weight gain in the first year was calculated as the difference between weight at 12 months and birth weight.
The explanatory variables used in the pres-ent analysis were: sex, birth weight, and family income. The child’s sex was recorded based on data collected soon after birth, while the mother was still in hospital. Birth weight was recorded at the same time, based on the measurement made by the nurse assisting the delivery using a scale whose accuracy was checked on a weekly basis by the interviewer. Family income was self-re-ported by the mother at every subsequent visit, and was recorded as a multiple of the current minimum wage.
Statistical analysis included calculating the prevalence of nutritional deficits and overweight, as well as prevalence ratios for comparing differ-ent subgroups. Statistical comparisons between groups were based on χ² tests for heterogeneity in the case of nominal variables and linear trend tests in the case of ordinal variables. To compare mean weight gain, we used a linear regression model adjusting for cohort effect, family income, and the interaction between these two variables.
All analyses were performed using the Stata statistical package (Stata Corp., College Station, USA).
obtained from mothers for participation in the study. In 2004, in addition, written consent was also requested.
Results
In the 1982 cohort, we were able to trace 79% of children born between January and April of 1982. The mean age of these children was 11.2 ± 1.3 months. In 1993, the follow-up rate was 93% and the mean age was 12.2 ± 0.5 months. In 2004, the follow-up rate was 94% and the mean age 11.9 ± 0.2 months. Since the z-scores already take into consideration the child’s age, eventual differenc-es in mean age and standard deviation should not affect comparisons of nutritional status. The number of children studied at around age 1 year in each cohort is presented in Table 1, and broken down according to sex, family income, and birth weight.
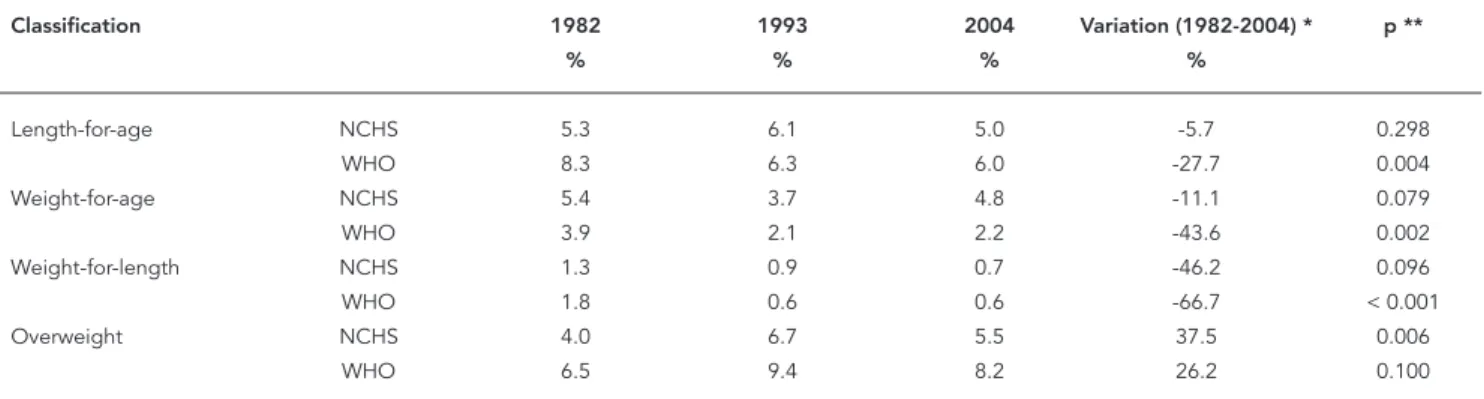
Table 2 presents the prevalence of length-for-age, weight-for-length-for-age, and weight-for-length defi-cits, as well as overweight, in each of the cohorts and according to the NCHS 8 and WHO 9 refer-ence curves. For all indicators of nutritional defi-cit, there was a reduction in prevalence between 1982 and 2004, but results for 1993 were incon-sistent with the overall trend when the NCHS 8 curve was used. In the case of length-for-age, the deficit increased between 1982 and 1993, with a
subsequent reduction between 1993 and 2004. Analysis of weight-for-age based on the WHO 9 curve showed a decreasing trend, followed by stabilization. Weight-for-length deficits were less prevalent than the other two types, and show a consistent reduction across the three cohorts ac-cording to both references. Figure 1 offers a clear-er pclear-erspective of trends according to the WHO 9 reference: an important reduction in deficits in the three indicators is observed between 1982 and 1993, followed by a period of stability be-tween 1993 and 2004.
Considering the entire period (1982 to 2004), reductions were greater according to WHO 9 than to NCHS 8 for all three indicators, which is re-flected in the existence of a statistically signifi-cant difference between cohorts only when the WHO reference is used. Table 2 also shows an increase in overweight between 1982 and 1993, with subsequent decline in 2004. This reduction took place primarily in children from families earning between 3.1 and 6 times the minimum wage (Figure 2).
All analyses presented from this point on are based on the WHO 9 reference curves alone. Table 3 shows that boys tended to show greater prevalence of deficits than girls, although only the difference in length-for-age was significant, and only for 1982 and 2004. Decreasing trends in the period were similar for both sexes. Boys also showed greater prevalence of overweight when
Table 1
Number of children examined at age 12 months in the 1982, 1993, and 2004 cohorts according to sex, family income, and birth weight. Pelotas, Southern Brazil.
Variables 1982 1993 2004
n % n % n %
Sex
Male 714 49.0 671 49.2 2,024 51.8
Female 742 51.0 693 50.8 1,883 48.2
Family income (as a multiple
of the minimum wage)
≤1.0 252 17.4 244 18.2 792 20.3
1.1-3.0 740 51.0 591 44.1 1,803 46.3
3.1-6.0 282 19. 4 298 22.2 886 22.7
6.1-10.0 91 6.3 114 8.5 216 5.5
> 10.0 85 5.9 93 6.9 199 5.1
Birth weight (g)
< 2,500 93 6.5 132 9.7 345 8.8
2,500-2,999 378 26.2 325 23.9 973 24.9
≥3,000 970 67.3 904 66.4 2,588 66.3
-compared to girls in all three studies. These dif-ferences, however, decreased with time so that prevalence among girls was virtually equal to that of boys in 2004. Between 1982 and 2004, the prevalence of obesity among boys remained stable, whereas its prevalence among girls in-creased 66% (p = 0.01).
Table 4 presents trends in anthropometric indicators according to family income. There was an important reduction – almost 50% – in the prevalence of nutritional deficits within the two poorest strata. Prevalence in the remain-ing groups, which was already very low to begin with, remained stable in 2004. There were some
Table 2
Prevalence of malnutrition and overweight at age 12 months in the 1982, 1993, and 2004 cohorts, according to National Center for Health Statistics (NCHS) 8 and World Health Organization (WHO) 9 reference levels. Pelotas, Southern Brazil.
Classification 1982 1993 2004 Variation (1982-2004) * p **
% % % %
Length-for-age NCHS 5.3 6.1 5.0 -5.7 0.298
WHO 8.3 6.3 6.0 -27.7 0.004
Weight-for-age NCHS 5.4 3.7 4.8 -11.1 0.079
WHO 3.9 2.1 2.2 -43.6 0.002
Weight-for-length NCHS 1.3 0.9 0.7 -46.2 0.096
WHO 1.8 0.6 0.6 -66.7 < 0.001
Overweight NCHS 4.0 6.7 5.5 37.5 0.006
WHO 6.5 9.4 8.2 26.2 0.100
* (%2004 - %1982)/%1982 x 100; ** χ² test for heterogeneity of proportions.
Figure 1
Prevalence of length-for-age, weight-for-age, and weight-for-length defi cits (z < 2 standard deviations) and overweight (z wei-ght-for-age > 2 standard deviations) at age 12 months in children from the 1982, 1993, and 2004 cohorts, according to World Heath Organization 9 reference levels. Pelotas, Southern Brazil.
10
8
6
4
2
0
fluctuations between 1993 and 2004 for groups with income of more than three times the mini-mum wage, but these were not statistically sig-nificant. In particular, the 2.5% prevalence of weight-for-height deficit in the group earning more than ten times the minimum wage in 2004 is worthy of note, given that no cases of deficit were recorded in this income group in either 1982 or 1993.
In spite of the reduction in deficits among lower income groups, there was still a strong
association between family income and nutri-tional deficit in 2004. For 2004, we calculated the mean deficits in the three highest income groups, so as to obtain a more stable estimate of actual prevalence rates. The values obtained were 0.9%, 3.5%, and 0.2% for weight-for-age, length-for-age, and weight-for-length, respec-tively. Comparing the poorest group with the mean of the three wealthiest groups, prevalence ratios for these indicators were 5, 2, and 10, re-spectively.
Table 3
Prevalence of malnutrition and overweight at age 12 months by sex in children from the 1982, 1993, and 2004 cohorts according to World Health Organiza-tion 9 reference levels. Pelotas, Southern Brazil.
Sex Length-for-age (%) Weight-for-age (%) Weight-for-length (%) Overweight (%)
1982 1993 2004 p * 1982 1993 2004 p * 1982 1993 2004 p * 1982 1993 2004 p *
Male 10.4 7.4 6.8 0.003 4.1 2.9 2.5 0.04 2.1 0.5 0.7 0.006 8.3 10.7 8.6 0.9 Female 6.2 5.3 5.1 0.3 3.6 1.4 1.9 0.02 1.5 0.7 0.5 0.02 4.7 8.1 7.8 0.01 p ** 0.004 0.100 0.020 - 0.700 0.070 0.200 - 0.400 0.800 0.400 - 0.005 0.100 0.400
-* χ² for linear trend 1982-2004; ** χ² for difference between sexes. Figure 2
Prevalence of overweight (z-scores of weight-for-length > 2) according to family income * among children from the 1982, 1993, and 2004 cohorts, according to World Health Organization 9 reference levels. Pelotas, Southern Brazil.
Table 5 shows evidence of a strong inverse association between birth weight and preva-lence of anthropometrical deficits. Between 1982 and 1993, reductions in anthropometric deficits were seen across almost all birth weight categories. This reduction was particularly im-portant among low birth weight babies. Very small differences were detected between 1993 and 2004, however, suggesting that these indica-tors remained stable.
A comparison of prevalence of overweight by birth weight category in 1993 and 2004 showed no increase between these dates, in contrast with what was observed between 1982 and 1993. While there was an apparent reduction among low-birth weight babies, levels for other groups remained relatively stable (Table 5). In all three cohorts, there was a clear increasing trend for prevalence as birth weight increased.
Mean weight gain in the first year of life, after adjustment for differences in age between
co-horts, was 6281.2g in 1982, 6741.3g in 1993, and 6555.9g in 2004 (p < 0.001). Weight gain, which had increased between 1982 and 1993 across all categories of family income, leveled out – or even fell slightly – between 1993 and 2004 (Figure 3). The three intermediate income groups, which showed the greatest weight gain between 1982 and 1993, were also those that, between 1993 and 2004, showed the greatest reductions. The dif-ference in weight gain between the highest and lowest income groups fell from 1.1kg in 1982 to 0.5kg in 2004. The effect of the cohort design and of income on mean weight gain was tested using a linear regression model, which was significant with p < 0.001.
The evolution of overweight according to family income (Figure 2), shows a clear change of course. In 1982, there was a highly significant (p < 0.001) linear trend, which disappeared in 1993 (p = 0.284), and was even less evident in 2004 (p = 0.499). On the other hand, an
anal-Table 4
Prevalence of malnutrition and overweight at age 12 months by family income in children from the 1982, 1993, and 2004 cohorts according to World Health Organization 9 reference levels. Pelotas, Southern Brazil.
Family income Length-for-age (%) Weight-for-age (%) Weight-for-length (%) Overweight (%) (multiple of the 1982 1993 2004 p * 1982 1993 2004 p * 1982 1993 2004 p * 1982 1993 2004 p * minimum wage)
≤1.0 16.9 10.9 8.0 < 0.001 9.6 5.600 4.4 0.003 4.0 2.1 1.5 0.020 4.0 8.0 8.1 0.050 1.1-3.0 7.9 7.4 6.8 0.300 3.9 2.000 2.2 0.030 1.9 0.3 0.6 0.005 5.7 9.0 8.0 0.100 3.1-6.0 3.9 2.2 3.6 0.900 0.7 0.800 0.5 0.60 0.7 0.2 0.1 0.090 6.7 11.9 8.1 0.900 6.1-10.0 5.5 2.9 3.3 0.400 0.0 0.300 0.9 - 0.0 0.0 0.0 - 9.9 11.0 6.5 0.200 > 10.0 2.4 4.8 3.1 0.900 0.0 0.000 2.5 - 0.0 0.0 0.5 - 16.5 5.4 12.7 0.700 p ** < 0.001 < 0.001 < 0.001 - < 0.001 < 0.001 < 0.001 - 0.020 0.020 0.005 - 0.001 0.300 0.200
-* χ² for linear trend 1982-2004;
** χ² for difference between income strata.
Table 5
Prevalence of malnutrition and overweight at age 12 months according to birth weight in children from the 1982, 1993, and 2004 cohorts according to World Health Organization 9 reference levels. Pelotas, Southern Brazil.
Birthweight Length-for-age (%) Weight-for-age (%) Weight-for-length (%) Overweight (%)
(g) 1982 1993 2004 p * 1982 1993 2004 p * 1982 1993 2004 p * 1982 1993 2004 p *
< 2,500 36.7 20.5 21.2 0.006 22.5 11.0 11.1 0.009 13.3 3.0 2.9 < 0.001 0.0 3.5 1.8 0.600 2,500-2,999 14.4 10.3 9.5 0.020 6.7 2.4 3.6 0.040 2.1 0.4 1.2 0.500 5.0 4.3 4.5 0.800
≥3,000 3.5 2.7 2.6 0.200 1.1 0.6 0.5 0.070 0.6 0.3 0.1 0.010 7.6 12.1 10.5 0.040 p ** < 0.001 < 0.001 < 0.001 - < 0.001 < 0.001 < 0.001 - < 0.001 < 0.001 < 0.001 - 0.006 < 0.001 < 0.001
-* χ² for linear trend 1982-2004;
ysis of the evolution of overweight with time, according to income group, shows an increase among the poorest population, accompanied by stability, or even a slight reduction, in other income groups.
Discussion
The availability of data from three population-based birth cohorts provides a unique opportu-nity for study in Brazil. On all three occasions, these studies included over 99% of children born in the city. Losses to follow-up were much great-er in 1982 than in 1993 or 2004, but an analysis of these losses showed that there was little varia-tion in terms of socioeconomic levels 7. In 1982, for example, we were able to locate 68% of chil-dren in the income group earning less than one minimum wage, compared to 79% of children with income higher than 10 times the minimum wage. These percentages were 92% and 96% in 1993 and 93% and 96% in 2004, respectively.
A comparison of the 1982 and 2004 cohorts shows important reductions in the prevalence of the three types of nutritional deficits studied, although prevalence rates in1993 did not always
occupy an intermediate position between those of the 1982 and 2004 cohorts. The observed re-ductions provide evidence of the nutritional transition taking place in the region.
Reductions observed between 1982 and 2004 were always more marked when the WHO 9 curves were used compared with the NCHS 8 standard, which may be a result of the better quality of the former 10. The WHO 9 growth stan-dard was constructed based on studies carried out in different countries, and, given its design, has better properties than those of the NHCS 8 standard. The use of the two standards in the present study is intended to allow for comparison with previous studies, as well as with future stud-ies – which will most likely use the new standard. It should be noted that certain inconsistencies were observed when trends were calculated using each of the two curves. For example, the weight-for-age deficit increased between 1993 and 2004 according to NCHS 8, but remained stable accord-ing to the WHO 9 standard. Generally speaking, however, time trends that used both standards were similar.
Considering the thresholds adopted (< -2 standard deviation for deficit and > +2 standard deviation for overweight), a maximum of 2.5% of a
Figure 3
Mean weight gain during fi rst year of life, according to family income *, in children from the 1982, 1993, and 2004 cohorts. Pelotas, Southern Brazil.
healthy population would be expected to fall out-side this range. According to these criteria, preva-lence of the weight-for-age deficit in 2004 is within the expected values for a population comparable to the reference. Such a conclusion is misleading, however, given that the weight-for-age score is the result of a combination of length-for-age and weight-for-length 11. Thus, even in 2004, there is still an important deficit in length-for-age (6%), combined with excess weight-for-length – indi-cated by the low prevalence of deficit (0.6%) and high prevalence of excess (8.2%) shown by this indicator. This combination of deficits in linear growth and overweight leads to the prevalence of weight-for-age appearing to be normal. This is one of the reasons why the use of weight-for-age as a criterion for nutritional evaluation of children in countries undergoing nutritional transition has been subject to criticism 12.
Prevalence of length-for-age retardation was about two times higher than that expected for a healthy population, suggesting deficiencies in linear growth already at 12 months, and indicat-ing that little progress has been made durindicat-ing this 22-year period, particularly over the last 11 years. The length-for-age deficit is typically more marked after the second year of life, and tends to fall again at the age of three 13.
When compared to other Brazilian studies, however, levels in Pelotas are reasonably low. For example, the prevalence of a height-for-age deficit in under-fives ranged from 13% to 17% in Brazil’s Northeast and North Regions in an evaluation carried out in 1996 using the NCHS curves 14. In the country’s urban Center-South, prevalence of low stature was 4.6%, slightly low-er than the levels found in the 1993 and 2004 cohorts. However, the frequency of this same indicator among under-fives in the city of São Paulo, Brazil, in 1996 was similar to that of the NCHS standard (2.4%) 15.
Returning to the WHO standards, in terms of weight-for-height, even though prevalence of the deficit in 1982 (1.8%) was already below the 2.5% expected for a population that is compared to the reference, there was a further reduction to 0.6% in 2004. This finding is confirmed by a number of other Brazilian surveys, which show that this type of deficit is very rare in these kinds of circumstances, even prior to the nutritional transition. In fact, the detection of a reduction in this already low prevalence, together with the maintenance of, or increase in, rates of length-for-age, support the notion that the determi-nants of weight gain and linear growth are – at least in part – distinct 16. For instance, greater calorie availability may result in improvements in the weight-for-age ratio, but low stature may
remain due to other limiting factors, such as a lack of micronutrients in the diet.
Weight gain in each of the cohorts was ad-justed for differences in age among children, in order to account for the fact that mean age was lower and variance higher in 1982. After adjust-ment, mean weight gain in 1993 was 431g greater than in 1982. Mean weight gain in 2004 was lower than in 1993, and Figure 3 suggests that this is due mainly to the intermediate income groups. The increased prevalence of breastfeeding seen between 1993 and 2004 17 is likely to have played a role in this phenomenon, since infants who are breastfed have slower growth after the first three months of life than formula-fed infants 10.
In the three cohorts, there was a clear inverse relationship between family income and the prevalence of a nutritional deficit. Similar trends were found in several other Brazilian studies 18,19,20. Prevalence of a deficit in the three highest income groups (above three minimum wages) in the three cohorts are already within the expected values for a healthy population, according to the WHO 9 standard. This is not surprising, given that the new WHO 9 curves are based on studies car-ried out in six cities, one of which is Pelotas. The criterion for including children from Pelotas in the curves was family income equal to or great-er than six times the minimum wage 21. Given the low prevalence of a deficit among children from wealthy families, additional progress in this group, even in 1982, was unlikely. For this reason, differences between the poorest and wealthiest families tended to decrease in these 22 years, given the certain degree of improvement among lower income groups. This is in agreement with the “reverse equity hypothesis” 22, which predicts that new interventions in health initially ben-efit the wealthy, thus leading to an increase in inequality, such as that observed in 1982. Such interventions – improvements in sanitation and in the treatment of infections that contribute to malnutrition, for example 23 – would have reached the poor during this 22-year period, while at the same time further improvements in the preva-lence of malnutrition among the wealthy were not possible. This would lead – as in fact it did – to a reduction in inequality. Nevertheless, the length-for-age deficit in 2004 among the children of families earning less than or the equivalent of the minimum wage remained at 8%, a level that is unacceptable given the region’s level of develop-ment and the overall prevalence in Pelotas.
the reverse equity hypothesis, one possibility is that wealthier families are already showing con-cern for infant obesity, and therefore adopting preventive measures, whereas poorer families are yet to modify their behaviors. A factor that may influence both the reduction of overweight among wealthier children and the stagnation of rates among the population as a whole between 1993 and 2004 is the marked increase in both exclusive and total breastfeeding 17. Breastfed children are known to show lower prevalence rates of obesity 24, a fact that is also reflected in the new WHO growth curves 10.
Differences in the prevalence of deficit ac-cording to birth weight confirmed the impor-tance of the latter’s role as a determinant of malnutrition. However, children born weighing 3,000g or more showed a markedly greater risk of becoming obese at age 12 months than did other babies. In the current epidemiological transition through which Brazil is passing, both nutritional
deficits in low-birth weight children and obesity among children with high birth weight must be faced simultaneously.
This comparison of three birth cohorts re-vealed paradoxical trends in terms of nutritional status, with an important reduction in indicators of weight deficit, a slight improvement in length deficits, and an increase in the prevalence of overweight. The reasons that explain why prog-ress regarding the prevalence of stunting was only slight need to be further investigated, while the increasing trend towards greater rates of overweight amongst infants must be the subject of interventions by healthcare professionals. The persistence of social determinants of the deficit – although somewhat attenuated by the already very low levels reached by the wealthy – and the increasing problem of obesity among the poor pose important challenges, that will require ef-fective action by healthcare professionals.
Resumo
O estudo teve como objetivo comparar a evolução dos déficits nutricionais e sobrepeso em crianças de um ano, com base em três coortes de nascimentos inicia-das em 1982, 1993 e 2004 em Pelotas, Rio Grande do Sul, Brasil. Amostras das coortes de 1982 e 1993 e todos as crianças da coorte de 2004 foram pesadas e medi-das, e suas mães foram entrevistadas. Déficits antro-pométricos e sobrepeso foram analisados utilizando os padrões de crescimento definidos pelo NCHS e OMS. A comparação dos déficits nutricionais mostrou que, depois de declinar entre 1982 e 1993, a prevalência se estabilizou entre 1993 e 2004. Durante o período intei-ro, foi observada uma diminuição em todos os déficits. Inversamente, houve um aumento na obesidade. Bai-xa estatura para a idade esteve fortemente associada com renda familiar. O grupo de renda familiar abaixo de um salário mínimo foi o único que mostrou uma redução significativa em baixa estatura para idade durante o período estudado. Houve melhorias impor-tantes na redução dos déficits nutricionais na primeira metade do período de estudo, embora ainda persistam desigualdades sociais. Combater a desnutrição ainda é necessário nos 40% mais pobres da população, em pa-ralelo com a luta contra o sobrepeso, que vem sendo observado em todas as classes sociais.
Desnutrição; Sobrepeso; Antropometria; Estudos de Coorte
Contributors
References
1. De Onis M, Frongillo EA, Blossner M. Is malnutri-tion declining? An analysis of changes in levels of child malnutrition since 1980. Bull World Health Organ 2000;78:1222-33.
2. Monteiro CA, Benicio MHD’A, Conde WL, Popkin BM. Shifting obesity trends in Brazil. Eur J Clin Nu-tr 2000; 54:342-6.
3. Marcopito LF, Rodrigues SS, Pacheco MA, Shirassu MM, Goldfeder AJ, Moraes MA. Prevalência de alguns fatores de risco para doenças crônicas na cidade de São Paulo. Rev Saúde Pública 2005; 39:738-45.
4. Fonseca MJM, Faerstein E, Chor D, Lopes CS, Andreozzi VL. Associações entre escolaridade, ren-da e Índice de Massa Corporal em funcionários de uma universidade no Rio de Janeiro, Brasil: Estudo Pró-Saúde. Cad Saúde Pública 2006; 22:2359-67. 5. De Onis M, Blössner M. Prevalence and trends of
overweight among preschool children in develop-ing countries. Am J Clin Nutr 2000; 72:1032-9. 6. Post CL, Victora CG, Barros FC, Horta BL,
Guima-rães PRV. Desnutrição e obesidade infantis em duas coortes de base populacional no Sul do Bra-sil: tendências e diferenciais. Cad Saúde Pública 1996;12 Suppl 1:S49-57.
7. Barros AJD, Santos IS, Matijasevich A, Araújo CL, Gigante DP, Menezes AMB, et al. Methods used in the 1982, 1993, and 2004 birth cohort studies from Pelotas, Rio Grande do Sul State, Brazil, and a description of the socioeconomic conditions of participants’ families. Cad Saúde Pública 2008; 24 Suppl 3:S371-80.
8. National Center for Health Statistics. Growth curves for children, birth-18 years. Hyattsville: Na-tional Center for Health Statistics; 1978.
9. WHO Child Growth Standards based on length/ height, weight and age. Acta Paediatr Suppl 2006; 450:76-85.
10. De Onis M, Onyango AW, Borghi E, Garza C, Yang H; WHO Multicentre Growth Reference Study Group. Comparison of the World Health Organi-zation (WHO) Child Growth Standards and the National Center for Health Statistics/WHO inter-national growth reference: implications for child health programmes. Public Health Nutr 2006; 9:942-7.
11. Expert Committee on Nutrition, World Health Or-ganization. Physical status: uses and interpreta-tion of anthropometry. Geneva: World Health Or-ganization; 1995. (WHO Technical Report Series, 854).
12. Uauy R, Kain J. The epidemiological transition: need to incorporate obesity prevention into nutri-tion programmes. Public Health Nutr 2002; 5:223-9.
13. Shrimpton R, Victora CG, de Onis M, Lima RC, Blossner M, Clugston G. Worldwide timing of growth faltering: implications for nutritional inter-ventions. Pediatrics 2001; 107:E75.
14. Monteiro CA. A dimensão da pobreza, da desnutri-ção e da fome no Brasil. Estud Av 2003; 17:7-20. 15. Monteiro CA, Conde WL. Tendência secular da
desnutrição e da obesidade na infância na cidade de São Paulo (1974-1996). Rev Saúde Pública 2000; 34:52-61.
16. Victora CG. The association between wasting and stunting: an international perspective. J Nutr 1992; 122:1105-10.
17. Victora CG, Matijasevich A, Santos IS, Barros AJD, Horta BL, Barros FC. Breastfeeding and feeding patterns in three birth cohorts in Southern Brazil: trends and differentials. Cad Saúde Pública 2008; 24 Suppl 3:S409-16.
18. Monteiro CA, Benicio MHD’A, Iunes R, Gouveia NC, Taddei JAAC, Cardoso MAA. ENDEF e PNSN: para onde caminha o crescimento físico da crian-ça brasileira? Cad Saúde Pública 1993; 9 Suppl 1: S85-95.
19. Agriculture and Consumer Protection Depatment, Food and Agriculture Organization of the United Nations. Nutrition country profiles: Brazil. http:// www.fao.org/ag/AGN/nutrition/bra-e.stm (ac-cessed on 17/Oct/2006).
20. Monteiro CA, Freitas ICM, Baratho RM. Saúde, nu-trição e classes sociais: o nexo empírico evidencia-do em um grande centro urbano, Brasil. Rev Saúde Pública 1989; 23:422-8.
21. Araújo CLP, Albernaz EP, Tomasi E, Victora CG. Implementation of the WHO Multicentre growth reference study in Brazil. Food Nutr Bull 2004; 25: S53-9.
22. Victora CG, Vaughan JP, Barros FC, Silva AC, Tomasi E. Explaining trends in inequities: evidence from Brazilian child health studies. Lancet 2000; 356:1093-8.
23. Victora CG, Barros FC, Kirkwood BR, Vaughan JP. Pneumonia, diarrhea, and growth in the first 4 y of life: a longitudinal study of 5914 urban Brazilian children. Am J Clin Nutr 1990; 52:391-6.
24. Horta BL, Bahl R, Martines JC, Victora CG. Evi-dence on the long-term effects of breastfeeding: systematic reviews and meta-analyses. Geneva: World Heath Organization; 2007.
Submitted on 29/Mar/2007