The risk of incidence and
persistence of obesity among
Brazilian adults according to
their nutritional status at the
end of adolescence
O risco de incidência e persistência
da obesidade entre adultos
brasileiros segundo seu estado
nutricional ao final da adolescência
Wolney Lisboa Conde I
Camila Borges II
I Department of Nutrition of the School of Public Health at Universidade de São Paulo (USP); Department of Epidemiological Research on Nutrition and Health at USP – São Paulo (SP), Brazil
II Department of Nutrition of the School of Public Health at Universidade de São Paulo (USP) – São Paulo (SP), Brazil
Study carried out at the School of Public Health. Financial Support: none.
Correspondence to: Wolney Lisboa Conde Faculdade de Saúde Pública – Departamento de Nutrição – Avenida Doutor Arnaldo, 715 – CEP: 01246-904 – E-mail: [email protected]. Conflict of interest: none
Abstract
Introduction: he prevalence of obesity has increased among adults living in devel-oped or developing countries. In Brazil, obesity among adults afected at least 10% of population from 2008 to 2009. Objec-tives: Based on data from VIGITEL, we will estimate the incidence and persistence of obesity among Brazilian adults from 2006 to 2009. Methods: We used complete cases with demographic, socioeconomic, and anthropometric data of samples from 2006 to 2009. All estimates were adapted for the Brazilian population in 2007. he relative risk (RR) for incidence and persistence of overweight or obesity was estimated by the Poisson multiple regression. All estimates were adjusted for smoking behavior, age, and practice of physical activity. Results: he incidence of overweight among individuals with low or normal weight at the age of 20 is estimated in 40% for males and 30% for females. he persistence of obesity, in turn, is estimated in 65% for males and 47% for females. he gradient of obesity as a function of schooling is virtually inexis-tent in males. Among females, the gradi-ent is negative, with linear and statistically signiicant associations. Conclusion: hese characteristics, combined with the increase of obesity among young adults found in other studies, show the urgent need to use more efective public policies, which reduce public exposure to foods of poor nutritional quality and develop initiatives to promote physical activity.
Introduction
he prevalence of obesity has increased among adults in developing and developed countries1. he World Health Organization
(WHO) estimates that at least 1 billion people are overweight, out of which 300 million are obese2. Projections based on national
surveys performed in the past decades estimate that by the year 2025 obesity may afect 40% of the population of the United States, 30% of the population in England and 20% of the Brazilian population3.
Current literature indicates that young adults are prone to obesity, or even to being overweight in the transition of infancy or adolescence to adulthood4-7. he most
critical periods for the development of obesity happen in early childhood, during the strong oscillation and transition of body adiposity, which takes place between the ages of ive, seven and adolescence8.
From the age of six, approximately, one out of two obese children becomes an obese adult, while only one out of ten non-obese children has the same future9.
he incidence or persistence of obesity among adults is associated with chronic diseases and the increased risk of early mortality10. Some data point out that the
period at risk for obesity is the transition from adolescence to the early stages of adulthood, for both genders and diferent ethnicities4. Factors such as the habit of
smoking or serum cholesterol levels are risky or may predict the development of obesity in young adults7.
In Brazil, a secular trend analysis indicates that obesity among adults is increasing, and afected at least 10% of the population in all the regions of the country11 from 2008 to 2009. he increase in
obesity rates in Brazil is less intense among women12, socioeconomic groups with
higher income and those with more years of schooling13, as well as the most developed
regions of the country. It is estimated that chronic diseases might have been respon-sible for approximately 70% of the mortality in Brazil in the decade of 200015.
Resumo
Introdução: A prevalência da obesidade vem aumentando entre adultos nos países desenvolvidos e em desenvolvimento. No Brasil, a obesidade entre adultos atingiu entre 2008 a 2009 pelo menos 10% da população. Objetivo: Com base nos dados do VIGITEL, neste trabalho, serão estima-das a incidência e a persistência da obesi-dade entre brasileiros adultos no período de 2006 a 2009. Métodos: Nas amostras de 2006 a 2009, foram utilizados casos com registros demográicos, socioeconômicos e antropo-métricos completos. As estimativas foram expandidas para a população brasileira em 2007. A estimativa do risco relativo (RR) para incidência e persistência da obesidade ou excesso de peso entre homens e mulheres foi feita com regressão múltipla de Poisson, e ajustada para hábito de fumar, idade e atividade física. Resultados: A incidência do excesso de peso entre indivíduos com peso baixo ou normal, aos 20 anos, é estimada em 40%, no sexo masculino, e em 30%, no feminino. A persistência da obesidade, por sua vez, é estimada em 65%, no sexo mascu-lino, e em 47%, no feminino. O gradiente da obesidade como função da escolariza-ção é virtualmente nulo no sexo masculi-no. Entre mulheres, o gradiente é negativo, com associações lineares e estatisticamente signiicantes. Conclusão: Essas característi-cas, associadas à forte expansão da obesida-de entre adultos jovens obesida-detectada em outros estudos, apontam a urgência da utilização de políticas públicas mais incisivas e efeti-vas, que reduzam a exposição da população à alimentação com má qualidade nutricio-nal e desenvolvam ações voltadas à promo-ção da atividade física.
he increase and dispersion of obesity and its associated factors in Brazil – and other countries – originated the development of monitoring and surveillance systems that allow to follow-up the evolution of such problems and their main branches.
In Brazil, there is a system called Telephone-based Surveillance of Risk and Protective Factors for Chronic Diseases (VIGITEL) that aims at generating continuous information on the frequency and distri-bution of the main risk or protective factors for chronic diseases in the country16.
Brazil does not have studies to describe the incidence or persistence of obesity in the transition phase from adolescence to early adulthood.
Based on VIGITEL, the analysis of incidence and persistence of obesity among Brazilian adults from 2006 to 2009 will be presented in this study. he evolution description will be performed according to age and socioeconomic strata. his study focuses particularly on the gradient between changes on nutritional status and on adult life and schooling.
Methods
VIGITEL is a system that was established by the Ministry of Health in 2006 to annually monitor the frequency and distribution of the main risk factors associated with chronic non-communicable diseases in the Brazilian population. he basic sample of VIGITEL consists of at least 2,000 individuals aged 18 years or more in the Federal District and each state capital. he adjustment of the sample to the total Brazilian population happens in two phases: irst, the weighting factor is the function of the probability of being selected and having a landline telephone line in the universe of each analyzed city; in the second phase, the adjustment is given by the relation between the frequencies of gender, age and schooling categories from VIGITEL and Census, by the Brazilian Institute of Geography and Statistics (IBGE). he detailed sampling procedures of VIGITEL were described in a diferent publication16.
For this analysis, samples from 2006 to 2009 were selected, more speciically those related to individuals aged between 21 and 39 years; with body mass index (BMI) inferior to 35 kg/m2 at the age of 20,
with simultaneous record of demographic, socioeconomic and anthropometric infor-mation. In 2006, 14,767 cases (6,803 men and 7,964 women) were selected; in 2007, the selection consisted of 15,744 partici-pants (6,634 men and 9,110 women); in 2008, 16,026 cases (6,709 men and 9,317 women) and, in 2009, 15,448 cases (6,560 men and 8,888 women). Data concerning pregnant women (or those who suspected being pregnant) were previously excluded from the samples.
he selection as to age and BMI at the age of 20 was performed with the objective to: reduce the potential memory bias of the interviewees; enable that the estimates regarding persistence of obesity is not afect by cases that are diicult to change without medicine therapy, and indirectly exclude cases of high risk of obesity associated with other chronic diseases. Also, this selection allows the comparison of data from VIGITEL with information from other national surveys.
he basic information used in this study come from questions number Q6, Q7, Q8, Q9, Q11, Q12 and Q13, Q14, Q42 to Q46, Q60 to Q64 of the standard questionnaire used for VIGITEL in 2009, being similar to previous years. he questionnaires from 2006 to 2009 may be fully accessed at: http://portal.saude.gov.br/portal/saude/ proissional.
he recorded height and weight are those informed by the participant. BMI was calcu-lated by dividing the weight (kg) by the height (m2). At the age of 20, BMI was estimated by
replacing the current weight with the value at that age, and by maintaining the current height, once it is assumed that linear growth is over by this time. Nutritional status was classiied into low weight (BMI<18.5 kg/m2),
normal weight (BMI of 18.5 to 24.9 kg/m2),
pre-obese (BMI of 25 to 29.9 kg/m2), obese
BMI is higher than 25 kg/m2, according to
nomenclature and critical values adopted by WHO for adults17.
Estimates considered the inal weighting factor, which expands the sample to the Brazilian population in 2007 according to values demonstrated by IBGE. he relative risk (RR) of being currently obese at the age of 20, according to nutritional status, by schooling was estimated by Poisson regression for each gender.
he model was adjust for the temporal diference between current age and the age of 20, frequency of physical activity, current or former use of tobacco and number of cigarettes smoked per day. he linear trend as to current schooling was tested by intro-ducing the variable in the continuous form of the model. All analyses were done with Stata®, version 11.
Results
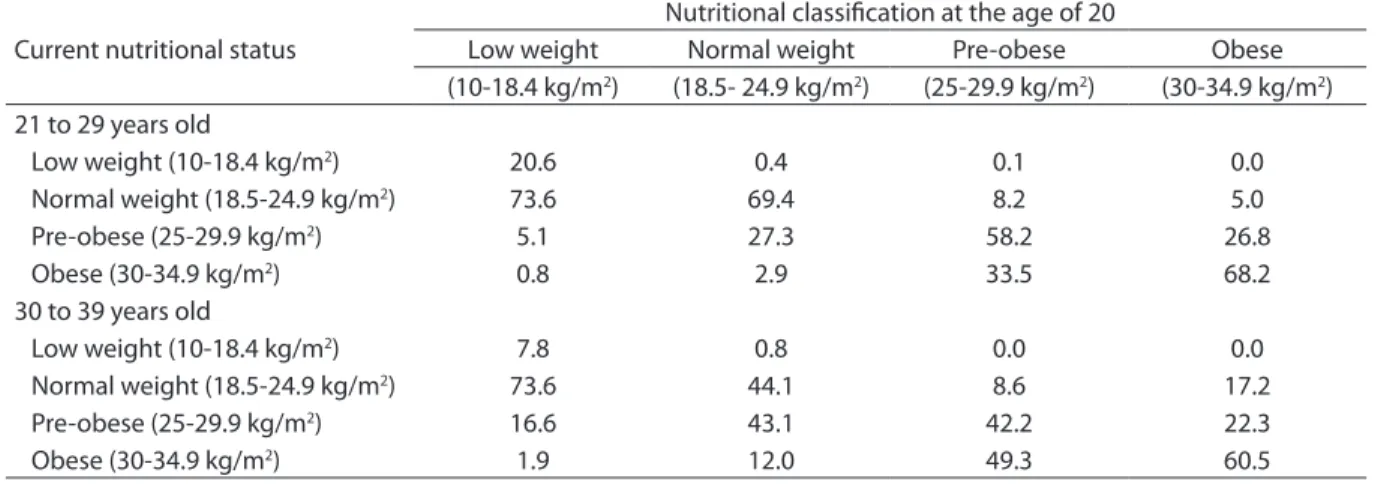
he incidence of overweight in this study among individuals with low or normal weight at the age of 20 is estimated in 40% for males and 30% for females. With the same comparison, the incidence of obesity is estimated in 7% for men and women. he incidence of obesity in individuals who are pre-obese at the age of 20 is approximately 40% for both genders (Table 1).
Data in Table 2 indicate the incidence of obesity among pre-obese men aged 20 is 5.4 times higher than that observed among men with normal weight at the same age. he age group clearly inluences the incidence of obesity. In the group of men currently aged 21 to 39 years, the same comparison shows the incidence of obesity is 11.6 times more frequent for those who were pre-obese at the age of 20. In the group of men aged 30 to 39 years, the incidence is 4.1 times more frequent in relation to the same comparison.
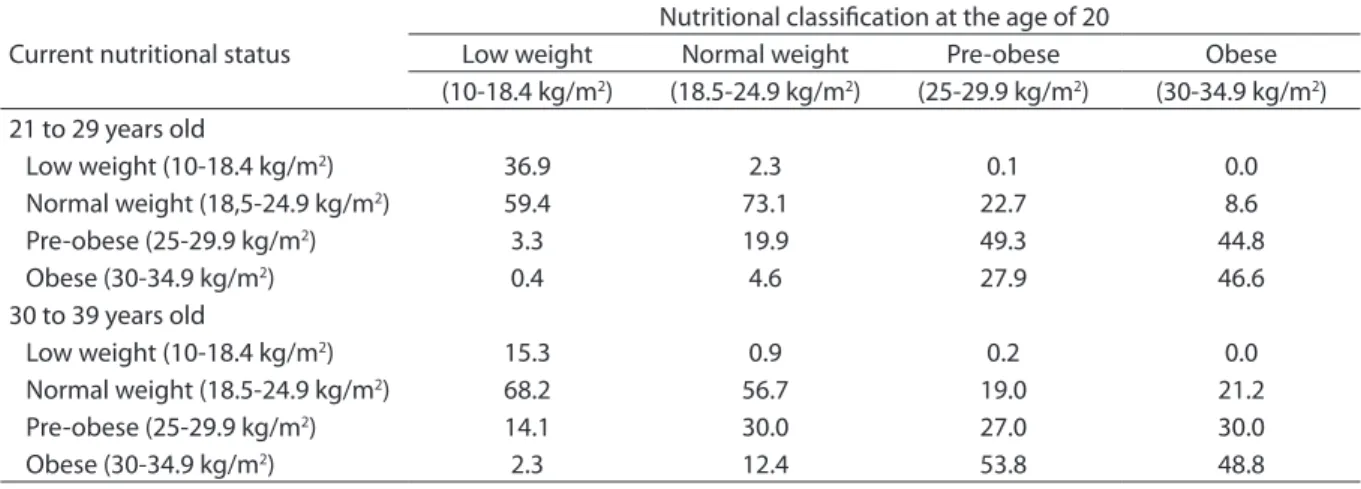
As to females, the incidence of obesity among the women who were pre-obese at the age of 20 is 4.7 times higher than among those with normal weight at the same age. For women, the diference in the incidence of obesity is less prevalent among the following age groups: for women currently aged 21 to 39 years, the incidence of obesity is 6.1 times more frequent than for those who were pre-obese at the age of 20. In the group aged 30 to 39 years, the incidence is 4.3 times higher as to the same comparison.
he persistence of overweight, that is, being overweight by the age of 20 and currently, is estimated in 91% for males and 81% for females. he persistence of obesity is estimated in 65% for males and 47% for females.
Table 1. Current nutritional status according to the World Health Organization nutritional classification and age by nutri-tional status at 20 years-old, among Brazilians men aged 21 to 39 years, VIGITEL, 2006 to 2009
Tabela 1. Estado nutricional atual segundo classificação nutricional da Organização Mundial de Saúde e faixa etária por estado nutricional aos 20 anos, entre homens brasileiros de 21 a 39 anos. VIGITEL, 2006 a 2009
Current nutritional status
Nutritional classification at the age of 20
Low weight Normal weight Pre-obese Obese
(10-18.4 kg/m2) (18.5- 24.9 kg/m2) (25-29.9 kg/m2) (30-34.9 kg/m2)
21 to 29 years old
Low weight (10-18.4 kg/m2) 20.6 0.4 0.1 0.0
Normal weight (18.5-24.9 kg/m2) 73.6 69.4 8.2 5.0
Pre-obese (25-29.9 kg/m2) 5.1 27.3 58.2 26.8
Obese (30-34.9 kg/m2) 0.8 2.9 33.5 68.2
30 to 39 years old
Low weight (10-18.4 kg/m2) 7.8 0.8 0.0 0.0
Normal weight (18.5-24.9 kg/m2) 73.6 44.1 8.6 17.2
Pre-obese (25-29.9 kg/m2) 16.6 43.1 42.2 22.3
Among men with overweight at the age of 20, 92% also were overweight afterwards, between the age of 21 and 29 years, and 90% are overweight at the age of 30 to 39 years. In relation to females, 81% of the women who were overweight at the age of 20 also presented this feature at the current age, at any age group.
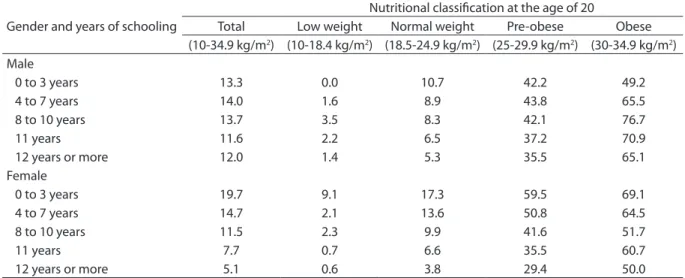
Schooling shapes the gradient of incidence of obesity diferently for each gender. For males, the association between obesity and years of schooling has a decreasing form, even if non-linear. For females, the association between obesity and years of schooling is inverse and linear. he association standard between obesity and schooling is shaped by the nutritional status at the age of 20 and, again, difers as to gender. For males, the association between obesity and years of schooling is inversely linear only among individuals with healthy weight at the age of 20, and presents a non-linear form among those who were obese at the age of 20.
For females, the association between obesity and schooling is inversely linear, regardless of the nutritional status at the age of 20. However, women who have a bache-lor’s degree, in relation to those who have had up to three years of schooling, present a risk of obesity of 0.72 when they were obese at the age of 20; 0.49, when they were
pre-obese; and 0.22 when they presented normal weight at that time.
Data from Table 3 suggest the interaction between schooling and previous nutri-tional status to determine current obesity. However, the interaction of these variables did not show statistical signiicance after the adjustment for other factors, such as: current age, habit of smoking in adulthood and practice of physical activity.
Table 4 presents the RR of becoming obese, remaining obese or overweight in adulthood as a function of the nutri-tional status at the age of 20 and schooling adjusted by current age, habit of smoking and practice of physical activity. In relation to men, women have more years of schooling (0.5 year), are older (0.5 year) and have an inferior BMI at the age of 20 (1.8 kg/m2).
As to males, the association between schooling and incidence or persistence of nutritional conditions that present risk to health is always positive, even if it is non-linear in the case of incidence or persis-tence of obesity. For females, however, the association between schooling and the incidence or persistence of nutritional conditions that present risk to health is always negative and, in cases of incidence or persistence of overweight, associations are linear and statistically signiicant.
Table 2. Current nutritional status according to the World Health Organization nutritional classification and age by nutri-tional status at 20 years-old, among Brazilians women aged from 21 to 39 years-old, VIGITEL, 2006 to 2009
Tabela 2. Estado nutricional atual segundo classificação nutricional da Organização Mundial de Saúde e faixa etária por estado nutricional aos 20 anos, entre mulheres brasileiras de 21 a 39 anos. VIGITEL, 2006 a 2009
Current nutritional status
Nutritional classification at the age of 20
Low weight Normal weight Pre-obese Obese
(10-18.4 kg/m2) (18.5-24.9 kg/m2) (25-29.9 kg/m2) (30-34.9 kg/m2)
21 to 29 years old
Low weight (10-18.4 kg/m2) 36.9 2.3 0.1 0.0
Normal weight (18,5-24.9 kg/m2) 59.4 73.1 22.7 8.6
Pre-obese (25-29.9 kg/m2) 3.3 19.9 49.3 44.8
Obese (30-34.9 kg/m2) 0.4 4.6 27.9 46.6
30 to 39 years old
Low weight (10-18.4 kg/m2) 15.3 0.9 0.2 0.0
Normal weight (18.5-24.9 kg/m2) 68.2 56.7 19.0 21.2
Pre-obese (25-29.9 kg/m2) 14.1 30.0 27.0 30.0
Discussion
he analysis of incidence and persis-tence of obesity among the Brazilian adult population in the second half of this decade shows that: the incidence of obesity is higher for males, especially those who were
pre-obese at the age of 20; the persistence of obesity is also more common among men, especially the younger ones; for females, more years of schooling functions in relation to the group of fewer years of schooling, as a protective factor as to the incidence and persistence of obesity.
Table 3. Current frequency (%) of obesity according to gender and years of schooling according to the nutritional status at the age of 20, among Brazilian adults aged 21 to 39 years. VIGITEL, 2006 to 2009
Tabela 3. Frequência (%) atual da obesidade segundo sexo e anos de estudo por estado nutricional aos 20 anos, entre adultos brasileiros de 21 a 39 anos. VIGITEL, 2006 a 2009
Gender and years of schooling
Nutritional classification at the age of 20
Total Low weight Normal weight Pre-obese Obese
(10-34.9 kg/m2) (10-18.4 kg/m2) (18.5-24.9 kg/m2) (25-29.9 kg/m2) (30-34.9 kg/m2)
Male
0 to 3 years 13.3 0.0 10.7 42.2 49.2
4 to 7 years 14.0 1.6 8.9 43.8 65.5
8 to 10 years 13.7 3.5 8.3 42.1 76.7
11 years 11.6 2.2 6.5 37.2 70.9
12 years or more 12.0 1.4 5.3 35.5 65.1
Female
0 to 3 years 19.7 9.1 17.3 59.5 69.1
4 to 7 years 14.7 2.1 13.6 50.8 64.5
8 to 10 years 11.5 2.3 9.9 41.6 51.7
11 years 7.7 0.7 6.6 35.5 60.7
12 years or more 5.1 0.6 3.8 29.4 50.0
Gender and years of schooling
Relative risk
Incidence of obesity Obesity persistence Overweight persistence (BMI 20 a <30; BMI atual ≥30) (BMI 20 a ≥30; BMI atual ≥30) (BMI 20 a ≥25; BMI atual ≥25)
Male (n=25,941) (n=519) (n=4,591)
0 to 3 years 1 1* 1*
4 to 7 years 1.15 (0.67-1.95) 1.28 (0.28-4.30) 1.18 (0.89-1.57)
8 to 10 years 1.31 (0.79-2.17) 1.50 (0.46-4.90) 1.19 (0.90-1.56)
11 years 1.15 (0.72-1.83) 2.35 (0.78-7.07) 1.18 (0.90-1.54)
12 or more years 1.14 (0.71-1.85) 1.94 (0.64-5.90) 1.21 (0.93-1.60)
Female (n=34.309) (n=427) (n=2,491)
0 to 3 years 1* 1 1*
4 to 7 years 0.93 (0.60-1.45) 0.70 (0.26-1.86) 0.96 (0.81-1.15)
8 a to 10 years 0.72 (0.46-1.13) 0.51 (0.19-1.33) 0.97 (0.82-1.15)
11 years 0.47 (0.31-0.71) 1.17 (0.56-2.42) 0.89 (0.76-1.05)
12 or more years 0.32 (0.21-0.49) 0.69 (0.29-1.64) 0.82 (0.69-0.97)
Table 4. Relative risk (RR)1 of incidence and persistence of obesity and overweight by gender and years of schooling
among Brazilian adults from 21 to 39 years-old. VIGITEL, 2006 to 2009
Tabela 4. Risco relativo (RR)1 de incidência da obesidade e persistência da obesidade e do excesso de peso, segundo sexo e anos
de estudo de adultos brasileiros de 21 a 39 anos. VIGITEL, 2006 a 2009
1 The sample was adjusted for temporal difference between current age and the age of 20, frequency of physical activity, smoking and number of cigarettes
a day. RR estimates (95%CI); * linear trend test with p<0.05.
1 O modelo foi ajustado para a diferença temporal entre a idade atual e 20 anos, frequência de atividade física, uso atual ou passado de tabaco e número de
Telephone health and nutrition surveys, like VIGITEL, are always prone to infor-mation bias. However, evidence points that bias is low, when existent18,19, and may be
adjusted20. Information gain to anticipate
trends and surveillance of associated factors compensate for the possible uncertainties of this method.
Another aspect that presents potential bias as to the results is the estimated incidence of nutritional aspects over the information of reported weight at the age of 20. In VIGITEL, values of height, weight and obesity of the years 2008 and 2009 were compared with equivalent data obtained by the Brazilian household budget survey (POF) for people aged 20 to 23 years, and there were no diferences as to the obesity average of both samples. hen anthropo-metric data from VIGITEL difer from their equivalents from POF, the diference is symmetric in relation to weight and height, which barely impacts estimates of obesity. In this comparison, the estimates of obesity for men was 5.8% against 4.5% for VIGITEL and POF, respectively; among women, it was 4.5% against 4.4%, respectively. he comparison between reported weight at the age of 20 by VIGITEL and the one measured in respective cohorts, analyzed in other surveys, projects a mean diference of 0.4 kg/m2 to calculate
BMI and 1.5% to estimate obesity. All data were estimated by the authors.
he analysis of nutritional status evolution among adults may start at diferent stages of life. Generally, when the stage of life to be compared is early, the analytical rigor and the quality of information are higher. In a recent systematic review of literature on the follow-up of overweight children until adulthood, Singh et al. identiied 25 publi-cations that met their minimum quality criteria; out of these, 13 could be considered as high quality. his review clearly shows that overweight children and adolescents are more prone to becoming obese adults, or remaining overweight21.
In this analysis, we chose to separate the category “overweight” in two BMI groups in order to describe the risk of obesity in
adulthood more properly. hus, it is possible to observe that the average incidence of obesity among individuals who were obese at the age of 20 is approximately ive times higher than that observed for individuals with normal BMI. Also, such incidence is more intense among younger adults. his vigorous development of the incidence of obesity also takes place in other countries: in the United States, obesity doubles from adolescence to early adulthood, and doubles again until the early 30s5. In Greece, the ive year follow-up
of individuals aged 18 years pointed to incidence of obesity in 22% of the men and 12% of the women who were analyzed; among individuals with normal initial BMI, the incidence was 10 and 7%, respectively7.
One of the impediments to the expansion of obesity has been the socioeconomic condition of the exposed individual, even if the income or schooling strata are more efective for females than males22,23. In this
study, the gradient of obesity in relation to schooling is virtually insigniicant among men and well established among women. he new information resulting from VIGITEL is the reduction in the incidence and persistence of obesity or overweight among females, especially those with more years of schooling. hus, even women who start adulthood overweight have good chances of returning to a normal BMI.
Another relevant aspect in the analysis of VIGITEL is the information regarding the increase from relatively moderate frequencies of obesity at the end of adoles-cence to high frequencies in less than two decades of adult life. his information is harder to interpret and compare with trends and data from other countries. One hypothesis is that this population group has been excluded from academic studies and the focus of public policies due to its histori-cally low frequency of obesity.
hus, the assessment of individuals aged 15 to 29 years is relevant for the analysis of the increasing incidence and persistence of obesity n Brazil, due to their biological and social characteristics.
Conclusion
he main trends observed in this study indicate that the incidence of obesity is more prevalent among men and young adults. Among women, schooling blocks the incidence or persistence of obesity.
When these characteristics are associated with the increased obesity among young adults, the urgency to establish more efective public policies is detected, in order to reduce the exposure of the population to an unbalanced or nutritionally poor diet, and to increase actions or programs directed to the encouragement of physical activity. Also, it is important that body weight evolution be monitored in younger individuals as they go to social apparatus such as schools and health care units.
References
1. Popkin BM. Global context of obesity. Handbook of Obesity Prevention. 2007;227-38.
2. Haslam DW, James WPT. Obesity. Lancet. 2005;366(9492):1197-209.
3. Hu FB. Obesity epidemiology. USA: Oxford University Press; 2008.
4. Gordon-Larsen P, Adair LS, Nelson MC, Popkin BM. Five-year obesity incidence in the transition period between adolescence and adulthood: the National Longitudinal Study of Adolescent Health. Am J Clin Nutr. 2004;80(3):569-75.
5. Gordon-Larsen P, he NS, Adair LS. Longitudinal Trends in Obesity in the United States From Adolescence to the hird Decade of Life. Obesity. 2009;18(9):1801-4.
6. Singh AS, Mulder C, Twisk JWR, Van Mechelen W, Chinapaw MJM. Tracking of childhood overweight into adulthood: a systematic review of the literature. Obes Rev. 2008;9(5):474-88.
7. Yannakoulia M, Panagiotakos D, Pitsavos C, Lentzas Y, Chrysohoou C, Skoumas I, et al. Five-Year Incidence of Obesity and Its Determinants: he ATTICA Study. Pub Heal Nutr. 2009;12(1):36-43.
8. Dietz W. Critical periods in childhood for the development of obesity. Am J Clin Nutr. 1994;59(5):955-9.
9. Guo SS, Wu W, Chumlea WC, Roche AF. Predicting overweight and obesity in adulthood from body mass index values in childhood and adolescence. Am J Clin Nutr. 2002;76(3):653.
10. Ezzati M, Lopez AD, Rodgers A, Vander Hoorn S, Murray CJL. Selected major risk factors and global and regional burden of disease. Lancet. 2002;360(9343):1347-60.
11. Instituto Brasileiro de Geograia e Estatística (IBGE). Pesquisa de Orçamentos Familiares 2008-2009.
Antropometria e estado nutricional de crianças,
adolescentes e adultos no Brasil. [Internet]. Rio de Janeiro: Instituto Brasileiro de Geograia e Estatística; 2010 [cited 12:49:54]. Available from: http://www.ibge.gov.br/home/ estatistica/populacao/condicaodevida/pof/2008_2009/ POFpublicacao.pdf.
12. Monteiro CA, Conde WL, Castro IRR de. A tendência cambiante da relação entre escolaridade e risco de obesidade no Brasil (1975-1997). Cad Saúde Pub. [Internet]. 2003 [cited 10:08:58];19. Available from: http://www.scielo.br/scielo.php?pid=S0102-311X2003000700008&script=sci_arttext&tlng=pt.
13. Monteiro CA, Conde WL, Popkin BM. Independent efects of income and education on the risk of obesity in the Brazilian adult population. J Nutr. 2001;131(3):881S.
14. Monteiro CA, Conde WL, Popkin BM. Is obesity replacing or adding to undernutrition? Evidence from diferent social classes in Brazil. Pub Health Nutr. 2002;5(1A):105-12.
15. Abegunde DO, Mathers CD, Adam T, Ortegon M, Strong K. he burden and costs of chronic diseases in low-income and middle-income countries. Lancet. 2007;370(9603):1929-38.
16. Moura EC, Morais Neto OL, Malta DC, Moura L, Silva NN, Bernal R, et al. Vigilância de Fatores de Risco para Doenças Crônicas por Inquérito Telefônico nas capitais dos 26 estados brasileiros e no Distrito Federal (2006). Rev Bras Epidemiol. 2008;11(Supl 1):20-37.
17. World Health Organization. Obesity: preventing and managing the global epidemic. World Health Organization; 2000.
18. Bernal R, Silva NN. Cobertura de linhas telefônicas residenciais e vícios potenciais em estudos epidemiológicos. Rev Saude Pub. 2009;43(3):421-6.
20. Ezzati M, Martin H, Skjold S, Hoorn SV, Murray CJL. Trends in national and state-level obesity in the USA after correction for self-report bias: analysis of health surveys. J R Soc Med. 2006;99(5):250-7.
21. Singh AS, Mulder C, Twisk JWR, Van Mechelen W, Chinapaw MJM. Tracking of childhood overweight into adulthood: a systematic review of the literature. Obesity Rev. 2008;9(5):474-88.
22. McLaren L. Socioeconomic Status and Obesity. Epidemiol Rev. 2007;29(1):29-48.
23. Monteiro CA, Moura EC, Conde WL, Popkin BM. Socioeconomic status and obesity in adult populations of developing countries: a review. Bulletin of the World Health Organization. 2004;82:940-6.
24. Popkin BM, Conde W, Hou N, Monteiro C. Is here a Lag Globally in Overweight Trends for Children Compared with Adults? &ast. Obesity. 2006;14(10):1846-53.
Submitted on: 02/02/2011 Final version presented on: 06/06/2011