2255-4823/$ – see front matter © 2013 Elsevier Editora Ltda. All rights reserved.
ASSOCIAÇÃO MÉDICA BRASILEIRA
7PMVNFt/ÞNFSPt/PWFNCSP%F[FNCSPt*44/t*44/ 0OMJOF
www.ramb.org.br
ARTIGOS
ARTIGOS ORIGINAIS _____________Qualidade da informação da internet disponível para pacientes em páginas em português ___________________________________________________________645 Acesso a informações de saúde na internet: uma questão de saúde pública? ______650 Maus-tratos contra a criança e o adolescente no Estado de São Paulo, 2009_______659 Obesidade e hipertensão arterial em escolares de Santa Cruz do Sul – RS, Brasil ___666 Bone mineral density in postmenopausal women with and without breast cancer ___673 Prevalence and factors associated with thoracic alterations in infants born prematurely __________________________________________________679 Análise espacial de óbitos por acidentes de trânsito, antes e após a Lei Seca, nas microrregiões do estado de São Paulo ___________________________________685 Sobrevida e complicações em idosos com doenças neurológicas em nutrição enteral ______________________________________________________691 Infliximab reduces cardiac output in rheumatoid arthritis patients without heart failure ______________________________________________________698 Análise dos resultados maternos e fetais dos procedimentos invasivos genéticos fetais: um estudo exploratório em Hospital Universitário _______________703 Frequência dos tipos de cefaleia no centro de atendimento terciário do Hospital das Clínicas da Universidade Federal de Minas Gerais __________________709 ARTIGO DE REVISÃO ______________Influência das variáveis nutricionais e da obesidade sobre a saúde e o metabolismo __714
EDITORIAL
Conclusão: como exibir a cereja do bolo 633
PONTO DE VISTAOs paradoxos da medicina contemporânea 634
IMAGEM EM MEDICINAObstrução duodenal maligna: tratamento endoscópico paliativo utilizando prótese metálica autoexpansível 636 Gossypiboma 638
DIRETRIZES EM FOCO
Hérnia de disco cervical no adulto: tratamento cirúrgico 639
ACREDITAÇÃO
Atualização em perda auditiva: diagnóstico radiológico 644 SEÇÕES ____________________________
www.ramb.org.br
Revista da
ASSOCIAÇÃO MÉDICA BRASILEIRA
Original article
Comparison of NCHS, CDC, and WHO curves in children
with cardiovascular risk
q
Grasiela Junges de Oliveira
a,b, Sandra Mari Barbiero
b, Claudia Ciceri Cesa
a,
Lucia Campos Pellanda
a,b,*
aUniversidade Federal de Ciências da Saúde de Porto Alegre (UFCSPA), Porto Alegre, RS, Brazil
bInstituto de Cardiologia/Fundação Universitária de Cardiologia (IC/FUC), Porto Alegre, RS, Brazil
A RT I C L E I N F O
Article history:
Received 3 October 2012 Accepted 11 February 2013
Keywords: Growth curves Nutritional assessment Cardiovascular diseases
q
Study conducted at Instituto de Cardiologia do Rio Grande do Sul / Fundação Universitária de Cardiologia (IC/FUC), Porto Alegre, RS, Brazil. * Corresponding author.
E-mail: [email protected] (L.C. Pellanda).
A B S T R A C T
Objective: The study aimed to compare the prevalence of overweight and obesity according to three growth curves, created by the World Health Organization (WHO/2006), by the National Center for Health Statistics (NCHS/1977), and by the Centers for Disease Control and Prevention (CDC/2000) in children with cardiovascular risk factors.
Methods: Data from 118 children and adolescents, aged between 2 and 19 years, treated between the years 2001 to 2009 at the Pediatric Preventive Cardiology Outpatient Clinic of the Instituto de Cardiologia de Porto Alegre were evaluated. The variables analyzed were: weight, height, age, and gender. Variables were classified according to the following criteria: weight/ age, height/age, and body mass index (BMI). The cutoff points used were obtained from the three growth curves: WHO/2006, NCHS/1977, and CDC/2000.
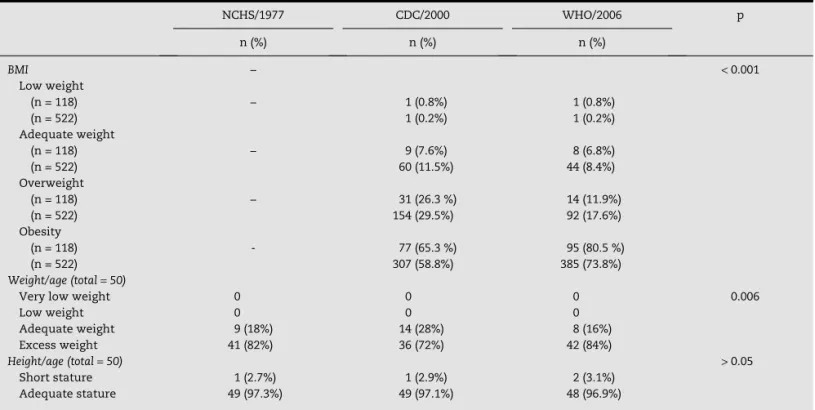
Results: Regarding the criterion weight/age by the NCHS curve, 18% of the children were classified as having normal weight, and 82% had excess weight; by the CDC curve, 28% had normal and 72% had excess weight; by the WHO curve, 16.0% had normal weight and 84% had excess weight. According to the BMI, 0.8% of the population was underweight. 7.6% and 6.8% had normal weight; 26.3% and 11.9% were overweight; and 65.3% and 80.5% were obese, according to the CDC and WHO curves, respectively. Regarding the height/age criterion, there was no significant difference between the references and, on average, 98.3% of the population showed adequate height for age.
Conclusion: The new WHO curves are more sensitive to identify obesity in a population at risk, which has important implications for preventive and therapeutic management.
Comparação das curvas NCHS, CDC e OMSem crianças com risco cardiovascular
R E S U M O
Objetivo: O objetivo deste trabalho foi comparar a prevalência de sobrepeso e obesidade de acordo com três curvas de crescimento: Organização Mundial de Saúde (OMS/2006), National Centre for Health Statistics (NCHS/1977) e Centers for Disease Control and Prevention (CDC/2000) em crianças com fatores de risco cardiovascular.
Métodos: Foram avaliados dados de 118 crianças e adolescentes, com idade entre 2 e 19 anos, atendidos entre os anos de 2001 a 2009 no Ambulatório de Cardiologia Pediátrica Preventiva do Instituto de Cardiologia de Porto Alegre. As variáveis analisadas foram: peso, altura, idade e sexo. Estas foram classificadas quanto aos critérios peso/idade, estatura/idade e índice de massa corpórea (IMC). Os pontos de corte adotados foram de três curvas de crescimento OMS/2006, NCHS/1977, CDC/2000.
Resultados: Quanto ao critério peso/idade pelo NCHS, 18% das crianças foram classificadas com eutrofia e 82% com peso elevado; pelo CDC, 28% eutróficas e 72% peso elevado; e pela OMS, 16,0% com eutrofia e 84% com peso elevado. Segundo o IMC, foram classificadas com baixo peso 0,8% da população, segundo CDC e OMS; eutróficos 7,6% e 6,8%, sobrepeso 26,3% e 11,9%, e com obesidade 65,3% e 80,5%, pelo CDC e OMS, respectivamente. Quanto ao critério estatura/idade, não houve diferença significativa entre os referenciais, sendo que, em média, 98,3% da população estudada apresentou estatura adequada para idade.
Conclusão: Conclui-se que as novas curvas da OMS são mais sensíveis para identificar obesidade em uma população de risco, o que tem importantes implicações para o manejo preventivo e terapêutico.
© 2012 Elsevier Editora Ltda. Todos os direitos reservados. Palavras-chave:
Curvas de crescimento Avaliação nutricional Doenças cardiovasculares
Introduction
The monitoring of growth and nutritional status during childhood and adolescence enables the early diagnosis of potential problems such as malnutrition, overweight, or obesity in adulthood.1 For this evaluation, anthropometry is
an important tool for the analysis of children’s health and nutritional status. In the last three decades, the use of two sets of growth curves, by the National Center for Health Statistics (NCHS/1977)2,3 and by the Centers for Disease Control and
Prevention (CDC 2000),4,5 has predominated. The 1977 reference
has some limitations, such as samples consisting mostly of formula-fed children, all from North America, among others.6 To try to minimize some of the problems of the
previous reference curves, the CDC reconstructed the 1977 reference using a series of modifications, releasing it in the year 2000. The sample of children was increased, incorporating data of children who had been breastfed, more modern statistical methods were used, and the body mass index (BMI) was included, among other changes.7
In 2006, the World Health Organization (WHO) established the new standard for infant growth, based on a multicenter study involving six countries: Brazil (Pelotas), Ghana (Accra), India (New Delhi), Norway (Oslo), Oman (Muscat), and United States (Davis). The sample of assessed children and their families should comprise different eligibility criteria, including:
exclusive breastfeeding at four months of age; intention to follow the dietary recommendations; socioeconomic situation that would not hinder the child’s growth; mother who did not smoke before and after delivery.8 The use of this standard
was recommended by the Brazilian Ministry of Health in 2007, and the growth curves were included in the Child Health Handbook.9,10 In the same year, this new standard was
extended to children aged between 5 and 19 years, after the analysis of the original NCHS/1977 sample, by using advanced statistical methods.11-13
There have been few studies in literature that compared the three curves and included children who already had cardiovascular risk factors treated at referral centers. Most studies that compared the curves assessed children younger than 5 years from unselected populations, where the proportion of children at risk is much lower. There is evidence that the atherosclerotic process begins in childhood and progresses with age, and that its severity is directly proportional to the number of risk factors displayed by the individual.11
Methods
This study was carried out with a database obtained from a cohort study, started in 2001 by the research group of ACPP - IC/FUC, entitled “Risk factors for ischemic heart disease in children and adolescents: primary prevention and early detection outpatient strategy”.
For the present study, data were extracted from specific cohort files, comprising 522 evaluations of 118 individuals aged 2 to 19 years. The BMI analyses were performed using data from 522 evaluations and, in order to verify result validity, an analysis was carried out with data from the first consultation of 118 patients. The study included individuals who had associated cardiovascular risk factors, such as dyslipidemia, obesity, hypercholesterolemia, hypertension, and family history. Fifteen individuals were excluded from the study due to incomplete data in the file, or loss to follow-up, as well as those with some type of congenital heart disease.
Three indices were analyzed to assess the nutritional status of the studied population: weight/age (W/A), height/ age (H/A), and BMI. These indices were obtained by comparing the information on weight, height, age, and gender of the patients from the original study. Weight was measured using a Welmy digital scale accurate to 0.1 kg, coupled to the scale stadiometer, accurate to 0.1 cm. These measures were collected by properly trained interns or professionals from the outpatient clinic, so that data collection standards were maintained.
The collected data were classified and analyzed according to the NCHS/1977, the CDC/2000, and the WHO/2006 reference curves. The BMI variable was compared only to the CDC/2000 and WHO/2006 references (the NCHS/1977 has no classification for BMI). The weight/age (W/A) and height/age (H/A) variables were compared using the NCHS/1977, CDC/2000, and WHO/2006 references; however, as the WHO/2006 reference has no classification of these two variables for ages above 10 years, it was decided to only assess children under 10 years using the three references, totaling 50 evaluations. The WHO/2006 curves were adopted by the Brazilian Ministry of Health and the Food and Nutrition Surveillance System (Sistema de Vigilância Alimentar e Nutricional – SISVAN),14 and
are adopted nationally as the gold standard regarding the nutritional status of children and adolescents.
The cutoff points for BMI according to the WHO/2006 curves are underweight, percentile < 3; adequate weight, 3 ≤ percentile
< 85; overweight, 85 ≤ percentile < 97; and obesity, percentile
≥ 97.14 The cutoffs for W/A according to the curves are very low
weight for age, percentile < 0.1; low weight for age, 0.1 ≤ percentile
< 3; adequate weight for age, 3 ≤ percentile < 97; and excess weight for age, percentile ≥ 97. As for the H/A criterion, the following classification was used: low stature, percentile < 3; adequate height for age, percentile ≥ 3.14 For the BMI assessment,
data from 522 patients were considered, and for the assessment of W/A and H/A, a subsample of 50 subjects was selected.
Statistical analysis was performed using the Statistical Package for Social Sciences (SPSS) release 11.0. Continuous variables were described as means and standard deviations or medians and interquartile ranges. Percentiles obtained
in the three curves were compared using concordance analysis; the non-parametric Wilcoxon test was used for BMI, and the non-parametric Friedman’s test was used for the others. Two analyses were performed: one considering only the first assessment of each patient (n = 118) to describe the frequencies. The other analysis included all other evaluations regarding the concordance. Significance was set at p < 0.05.
This study was approved by the Ethics Committee of the Instituto de Cardiologia do Rio Grande do Sul, protocol No. 4401/09 of December 18, 2009.
Results
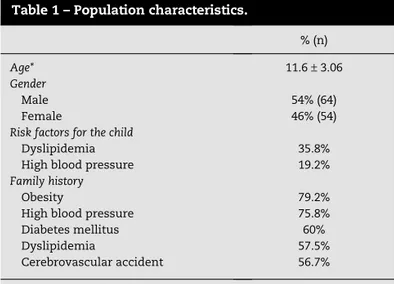
A total of 118 children and adolescents aged 2 to 19 years were studied, with a total of 522 evaluations (from 1 to 17 evaluations per patient, with a mean of 4.35). The general characteristics of the study population are shown in Table 1. The prevalences of overweight and obesity according to the different references are shown in Table 2.
Figure 1 shows the distribution of the population according to BMI in percentiles, using the CDC/2000 and WHO/2006 references. The WHO reference shows a significant increase in obesity when compared to the CDC reference, and a consequent reduction in normal weight and overweight (p < 0.001). When the BMI prevalence values were analyzed by gender, no statistical difference was observed (p = 0.58) between the CDC/2000 and WHO/2006 references.
Regarding the distribution of the population with high weight for age in years, it was observes that from the age of 5 onward there were differences among the three references, with the WHO/2006 curves showing a higher index of high weight for age.
Discussion
According to the results obtained, it was observed that the study population is mostly obese, according to BMI and W/A
% (n)
Age* 11.6 ± 3.06
Gender
Male 54% (64)
Female 46% (54)
Risk factors for the child
Dyslipidemia 35.8%
High blood pressure 19.2%
Family history
Obesity 79.2%
High blood pressure 75.8% Diabetes mellitus 60%
Dyslipidemia 57.5%
Cerebrovascular accident 56.7%
*Mean and standard deviation.
criterion, with adequate height for age according to H/A. There was a significant difference between the BMI and W/A curves evaluated according to the references. This was not observed with the H/A criterion; this difference was probably
not found due to the fact that the cutoffs had a very large range of classification, making the visualization of different classifications in these intervals difficult. Another justification for this result is that children and adolescents who are
NCHS/1977 CDC/2000 WHO/2006 p
n (%) n (%) n (%)
BMI − < 0.001
Low weight
(n = 118) − 1 (0.8%) 1 (0.8%)
(n = 522) 1 (0.2%) 1 (0.2%)
Adequate weight
(n = 118) − 9 (7.6%) 8 (6.8%)
(n = 522) 60 (11.5%) 44 (8.4%)
Overweight
(n = 118) − 31 (26.3 %) 14 (11.9%)
(n = 522) 154 (29.5%) 92 (17.6%)
Obesity
(n = 118) - 77 (65.3 %) 95 (80.5 %)
(n = 522) 307 (58.8%) 385 (73.8%)
Weight/age (total = 50)
Very low weight 0 0 0 0.006
Low weight 0 0 0
Adequate weight 9 (18%) 14 (28%) 8 (16%)
Excess weight 41 (82%) 36 (72%) 42 (84%)
Height/age (total = 50) > 0.05
Short stature 1 (2.7%) 1 (2.9%) 2 (3.1%)
Adequate stature 49 (97.3%) 49 (97.1%) 48 (96.9%)
Table 2 – Distribution and classification of nutritional status, weight for age, height for age, and body mass index (BMI) according to the National Center for Health Statistics (NCHS)/1977, Centers for Disease Control and Prevention (CDC)/2000, and World Health Organization (WHO)/2006 curves.
Fig. 1 – Obesity according to body mass index. Distribution of obese population in years according to body mass index, using the World Health Organization (WHO) and Centers for Disease Control and Prevention (CDC) references.
0%
10%
20%
30%
40%
50%
60%
70%
80%
90%
100%
2 3 4 5 6 7 8 9 10
11
12
13
14
15
16
17
18
19
Age in years
overweight or obese have an earlier growth spurt than the general population,15 so children and adolescents in this study
may have had greater height for age when compared to the rest of the population, explaining the high rate of height adequacy in this study.
Percentiles and Z-scores are the most frequently used scales to compare anthropometric measurements as a standard reference.16 In this study, BMI percentiles were used, since they
were already used in clinical practice at ACPP, in addition to being an excellent reference.
One of the best parameters to assess the nutritional status of children and adolescents is the BMI, as it considers age, weight, and height, and it is also applicable into adulthood.17,18 For
evaluation according to the BMI, the WHO reference was more sensitive for obesity, and it is indicated for the evaluation of children and adolescents, as it allows for early identification of children who may develop obesity. In 2009, one in three Brazilian children was overweight;19 considering that excess
weight may persist into adulthood, early identification is crucial for prompt intervention.
Obesity is associated with dyslipidemia, hypertension, and diabetes mellitus type 2, among others.20,21 The various
cohorts from the Bogalusa study showed that cardiovascular risk factors are present from childhood/adolescence, and are related to atherosclerotic lesions demonstrated in autopsy studies of young individuals.22
Table 1 shows that this study population already presented such associated risk factors. It is known that obesity in childhood and adolescence tends to continue into adulthood. If not controlled, it can lead to increased heart disease incidence and a consequent decrease in life expectancy.23-25 Thus,
early detection is essential for children at higher risk for the development of obesity, so that effective control measures can be taken to achieve a more favorable prognosis in the long term. The WHO/2006 curves resulted in the earlier identification of these children,12,26 as shown in Figures 1, 2,
and 4; that is, when using this reference, risk factors can be prevented in advance. Farias et al.27 found that BMI according
to WHO/2006 tends to show greater sensitivity than that of the CDC/2000 reference.
The weight/height criterion was not analyzed, as this type of reference is found only for children younger than 5 years, according to the WHO/2006, and it has maximum values of only 145 cm and 137 cm for males and females, respectively, according to NCHS/1977 and CDC/2000. The weight/height data are not available for most males older than 11 years and females older than nine years.4 Moreover, 97.3% of the study
population was older than 5 years, thus the authors decided against this type of analysis.
The results show that the study population does not have low weight for age. The same occurs with the classification according to the BMI, where only 0.2% of the population had low weight.
This can be explained by the fact that the assessed children were treated at a clinic specializing in children and adolescents with cardiovascular risk factors, and obesity is one of the most prevalent risk factors.
This study had some limitations, as it was retrospective; however, data were carefully collected, considering it was
performed in a referral service. Another limitation is the fact that up to the age of 6, the analyses were compromised, as the total number of evaluations at this was only 25, which is insufficient for a correct and significant analysis.
Based on the results of this study, it can be concluded that the new WHO curves are more sensitive to identify children and adolescents with obesity, and their use is recommended for the assessment of these individuals. These results can direct outpatient care, as the identification and early intervention on lifestyles can have an impact on behavior in adulthood.
Conflicts of interest
All authors declare no conflicts of interest.
R E F E R E N C E S
1. Bergmann GG, Garlipp DC, Silva GMG, Gaya A. Crescimento somático de crianças e adolescentes brasileiros. Rev Bras Saúde Mater Infant. 2009;9:85-93.
2. Hamill PV, Drizd TA, Johnson CL, Reed RB, Roche A, Moore WM. Physical growth: National Center for Health Statistics percentiles. Am J Clin Nutr. 1979;32:607-29.
3. Dibley MJ, Goldsby JB, Staehling NW, Trowbridge FL. Development of normalized curves for the international growth reference: historical and technical considerations. Am J Clin Nutr. 1987;46:736-48.
4. Centers for Disease Control and Prevention. National Center For Health Statistics. 2000 CDC growth charts: United States. Hyaltsville: CDC; 2002.
5. Kuczmarski RJ, Ogden CL, Guo SS, Grummer-Strawn LM, Flegal KM, Mei Z, et al. CDC growth charts: United States. Advance data from vital and health statistics; n. 314. Hyattsville: National Center for Health Statistics; 2000.
6. Roberts SB, Dallal GE. The new childhood growth charts. Rev Nutr. 2001;59:31-5.
7. Soares NT. Um novo referencial antropométrico de crescimento: significados e implicações. Rev Nutr. 2003;16: 93-104.
8. Onis M, Garza C, Adelheid W, Borghi E. Comparison of the WHO Child Growth Standards and the CDC 2000 Growth Charts. J Nutr 2007;137:144-8.
9. Brasil. Ministério da Saúde. Caderneta de Saúde da Criança [accessed 15 Aug 2008]. Available from: http://portal.saude.gov. br/portal/saude/visualizar_texto.cfm?idtxt=29889&janela=1 10. Damaceno RJ, Martins PA, Devincenzi MU. Nutritional status
of children assisted in public health care settings of the city of Santos, São Paulo, Brazil. Rev Paul Pediatr. 2009;27:139-47. 11. Borghi E, de Onis M, Garza C, Van den Broeck J, Frongillo EA,
Grummer Strawn L, et al. Construction of the World Health Organization child growth standards: selection of methods for attained growth curves. Stat Med. 2006;25:247-65.
12. WHO Multicentre Growth Reference Study Group. WHO Child Growth Standards: length/height-for-age, weight-for-age, weight-for-length, weight-for-height and body mass index-for-age: methods and development. Geneve: World Health Organization; 2006.
of anthropometry in infants. Bull World Health Organ. 1995; 73:165-74.
14. Ministério da Saúde. Sistema de Vigilância Alimentar e Nutricional (SISVAN): orientações básicas para coleta, processamento, análise de dados e informação em serviços de saúde. Brasília (DF): Ministério da Saúde; 2008.
15. Stark O, Peckham CS, Moynihan C. Weight and age at menarche. Arch Dis Child. 1989;64:383-7.
16. World Health Organization. Physical status: the use and interpretation of anthropometry. WHO Technical Report Series, n. 854. Geneve: WHO; 1995.
17. World Health Organization. WHO Child Growth Standards: length/height-for-age, weight-forage, weight-for-length, weight-for-height and body mass index-for-age. Methods and development. Geneva: WHO; 2006.
18. de Onis M, Onyango AW, Borghi E, Siyam A, Nishida C, Siekmann J. Development of a WHO growth reference for school-aged children and adolescents. Bull World Health Organ. 2007;85:660-7.
19. Instituto Brasileiro de Geografia e Estatística – IBGE. Antropometria e estado nutricional de crianças, adolescentes e adultos no Brasil – POF 2008 2009 [accessed 26 Apr 2010]. Available from: http://www.ibge.gov.br/home/presidencia/ noticias/noticia_ impressao.php?id_noticia=1699
20. Eckersley RM. Losing the battle of the bulge: causes and consequences of increasing obesity. Med J Aust. 2001;174:590-2. 21.World Health Organization. Physical status: the use and
interpretation of anthropometry. Geneve: WHO; 1995. 22. Berenson GS, Srnivasan SR. Bogalusa Heart Study Group.
Cardiovascular risk factors in young with implications for aging: the Bogalusa Heart Study. Neurobiol Aging. 2005;26:303-7. 23. Must, A. Morbidity and mortality associated with elevated
body weight in children and adolescents. Am J Clin Nutr. 1996; 63:445-7.
24. Rössner S. Childhood obesity and adulthood consequences. Acta Paediatr. 1998;87:1-5.
25. Freedman DS, Dietz WH, Srinivasan SR, Berenson GS. The relation of overweight to cardiovascular risk factors among children and adolescents: the Bogalusa Heart Study. Pediatrics. 1999;103:1175-82.
26. Victora CG, Araújo CL, Onis M. Uma nova curva de crescimento para o século XXI [accessed 26 Apr 2010]. Available from: http://189.28.128.100/nutricao/docs/geral/nova_curva_cresc_ sec_xxi.pdf