Role of
T. cruzi
exposure in the pattern of T cell
cytokines among chronically infected HIV and Chagas
disease patients
Tania Regina Tozetto-Mendoza,I,II,#Dewton de Moraes Vasconcelos,III,#Karim Yaqub Ibrahim,IVAna Marli Christovam Sartori,IVRita C. Bezerra,VIVera Lu´cia Teixeira de Freitas,I,VMaria Aparecida Shikanai-YasudaI,V,* ILaboratorio de Imunologia (LIM 48), Hospital das Clinicas HCFMUSP, Faculdade de Medicina, Universidade de Sao Paulo, Sao Paulo, SP, BR.IILaboratorio
de Virologia (LIM 52), Universidade de Sao Paulo, Instituto de Medicina Tropical, Sao Paulo, SP, BR.IIILaboratorio Dermatologia e Imunodeficiencias (LIM-56), Hospital das Clinicas HCFMUSP, Faculdade de Medicina, Universidade de Sao Paulo, Sao Paulo, SP, BR.IVDivisao de Doencas Infecciosas e Parasitarias, Hospital das Clinicas HCFMUSP, Faculdade de Medicina, Universidade de Sao Paulo, Sao Paulo, SP, BR.VDepartamento de Doencas Infecciosas e Parasitarias, Faculdade de Medicina FMUSP, Universidade de Sao Paulo, Sao Paulo, SP, BR.VILaboratorio de Parasitologia (LIM 46), Hospital das Clı´nicas HCFMUSP, Faculdade de Medicina, Universidade de Sao Paulo, Sao Paulo, SP, BR.
OBJECTIVES: The impact of Chagas disease (CD) in HIV-infected patients is relevant throughout the world. In fact, the characterization of the adaptive immune response in the context of co-infection is important for predicting the need for interventions in areas in which HIV and Chagas disease co-exist.
METHODS:We described and compared the frequency of cytokine-producing T cells stimulated with soluble antigen ofTrypanosoma cruzi (T. cruzi) using a cytometric assay for the following groups: individuals with chronic Chagas disease (CHR, n=10), those with Chagas disease and HIV infection (CO, n=11), those with only HIV (HIV, n=14) and healthy individuals (C, n=15).
RESULTS:We found 1) a constitutively lower frequency of IL-2+and IFN-g+T cells in the CHR group compared with the HIV, CO and healthy groups; 2) a suppressive activity of solubleT. cruziantigen, which down-regulated IL-2+CD4+and IFN-g+CD4+phenotypes, notably in the healthy group; 3) a down-regulation of inflammatory cytokines on CD8+T cells in the indeterminate form of Chagas disease; and 4) a significant increase in IL-10
+CD8+cells distinguishing the indeterminate form from the cardiac/digestive form of Chagas disease, even in the presence of HIV infection.
CONCLUSIONS:Taken together, our data suggest the presence of an immunoregulatory response in chronic Chagas disease, which seems to be driven by T. cruzi antigens. Our findings provide new insights into immunotherapeutic strategies for people living with HIV/AIDS and Chagas disease.
KEYWORDS: Intracellular Cytokines; Chagas Disease; HIV; Trypomastigote Antigen; T Cells.
Tozetto-Mendoza TR, Vasconcelos DM, Ibrahim KY, Sartori AM, Bezerra RC, de Freitas VL, et al. Role of T. cruzi exposure in the pattern of T cell cytokines among chronically infected HIV and Chagas disease patients. Clinics. 2017;72(11):652-660
Received for publication onMarch 6, 2017;First review completed onJune 23, 2017;Accepted for publication onJuly 19, 2017 *Corresponding author. E-mail: [email protected]
#These authors contributed equally to this work.
’ INTRODUCTION
Chagas disease (CD), caused by the protozoan Trypano-soma cruzi (T. cruzi), which is transmitted to humans by a vector (reduviid bugs), is currently one of the most important neglected diseases in Latin America. After the control of transmission byTriatoma infestans,the main vector in Brazil, the most important route is oral transmission associated with
acute cases and outbreaks (1). Migration from rural areas has made chronic CD primarily an urban disease in Latin America and the United States (1-6). Transmission of CD through blood transfusion, blood by-products, or organ transplanta-tion is currently a serious problem in non-endemic areas. At least 5 to 6 million chronically infected individuals live in endemic and non-endemic countries, and the disease con-tinues to represent a health threat around the world (6).
Acute CD is characterized by alterations in the mono-nuclear phagocytic system, causing lymphadenopathies and, less frequently, severe myocarditis or meningoencephalitis. Additionally, although most chronically infected individuals are asymptomatic, approximately 30 to 40% develop recog-nized cardiomyopathy or gastrointestinal tract disorders (7).
Reactivation of CD manifests as a febrile syndrome with meningoencephalitis and/or myocarditis, which is also
DOI:10.6061/clinics/2017(11)02
Copyright&2017CLINICS–This is an Open Access article distributed under the terms of the Creative Commons License (http://creativecommons.org/licenses/by/ 4.0/) which permits unrestricted use, distribution, and reproduction in any medium or format, provided the original work is properly cited.
associated with HIV infection and other immunodeficiency states such as haematological malignancies, bone marrow, kidney, or heart transplantation, and corticosteroid therapy (8-11). Reactiva-tion of CD in AIDS patients has been observed in p20% of
co-infected patients and has sometimes been reported as the first opportunistic infection (12). According to Almeida et al. 2011 (13), the overall mortality rate of HIV patients was 30%, and mortality occurred in 73% of the cases in which there was reactivation of CD. The frequency of individuals co-infected with HIV and
T. cruzi was estimated at 1.3% in a Brazilian study with a macro-regional approach (14). The impact of co-infection is extremely relevant, as approximately 1.5 million individuals with HIV/AIDS live in Latin America and approximately 21,420 HIV/T. cruzico-infected patients are estimated to live in this area (15).
Immunoregulatory mechanisms may influence the patho-genesis and clinical evolution of CD (16). Because CD and HIV infection are both associated with T cell responses and disturbances of cytokine networks (17, 18), the characteriza-tion of cytokine-secreting T cells is particularly relevant to improving our understanding of the immunopathogenesis of CD and to controlling concomitant intracellular infections in AIDS and other immunosuppressive conditions. A study of the differential regulation of Th1 and Th2 responses in HIV infection showed that decreased secretion of type-1 cyto-kines, such as IL-2 and IFN-g, was associated with a higher
susceptibility to opportunistic infections (19). Conversely, previous studies of the pathogenesis and clinical evolution of CD have reported higher IL-4/IFN-gratios in patients with
HIV/Chagas disease as well as the preferential involvement of inflammatory cytokines and activated T cells (18, 20). However, it is unclear whether the presence of HIV and
T. cruzico-infection modifies this mechanism in humans. Recent studies have demonstrated the impact of a specific antigenic stimulus on the course of a chronic infection in mice, as seen in the association between an HIV vaccine and helminthic infection (21). Accordingly, the characterization of the adaptive immune response either in mouse models or in human infections is relevant to interpreting or predicting therapeutic interventions in endemic areas where HIV and other infections co-exist.
This study aimed to describe and compare the profiles of cytokine-producing T cells from individuals with chronic Chagas disease and/or HIV infection with those from healthy individuals using a cytometric assay, which detects the intra-cellular accumulation of cytokines in CD4+ and CD8+
T lymphocytes stimulated with soluble trypomastigote anti-gens and mitoanti-gens.
’ MATERIALS AND METHODS
Ethics Statement
The Human Research Ethics Committee of the Hospital das Clínicas, Faculdade de Medicina, University of São Paulo approved the research protocol (CAPPesp 010/95-B). A signed informed consent form was obtained from all 50 participants (35 patients diagnosed with CD and/or HIV infection and 15 healthy individuals) for the period of 2001-2005 to partici-pate in the present cross-sectional study based on convenience sampling.
Study Groups and Methods
We enrolled 35 patients diagnosed with chronic CD and/or HIV infection who attended the Outpatient Clinic, Division
of Clinics of Infectious and Parasitic Diseases of the Hospital das Clínicas, Faculdade de Medicina, University of São Paulo. HIV infection was diagnosed with ELISA and confirmed with Western blotting. CD4+ and CD8+ T cell counts were measured by flow cytometry, and HIV viral load was determined by polymerase chain reaction (PCR). All HIV-infected individuals received Highly Active Antiretroviral Therapy (HAART), according to the national guidelines for antiretroviral therapy (15). For CD diagnosis (the CHR group), seropositivity in at least two of three tests forT. cruzi
infection (i.e., ELISA, indirect immunofluorescence assay, and indirect haemagglutination assay) was required. The clinical forms of CD were classified according to Sartori et al. 2007 (22): (1)‘‘Indeterminate form’’(IND), meaning no symp-toms or signs and normal results for electrocardiogram (ECG), chest X-ray, and oesophagography. (2)‘‘Non-typical cardiopathy’’or‘‘atypical manifestations’’(AT), meaning ECG changes possibly related to conditions other than CD. (3)
‘‘Typical cardiopathic form’’ with ECG changes considered typical of CD, including sinus bradycardiao50 beats/min,
right bundle-branch block, second-degree atrioventricular block, and/or complex ventricular arrhythmia. (4)‘‘Digestive form’’, meaning megaoesophagus or megacolon. (5)‘‘Typical digestive and cardiopathy’’ (TDC), meaning typical cardiac and/or digestive manifestation. Xenodiagnosis (23) and blood culture (24) were requested according to medical orientation and performed by the Laboratory of Parasitology of the Clinics Hospital. Blood culture and/or xenodiagnosis data were used to confirm the presence or absence of para-sites (T. cruzi) or reactivation of infection byT. cruzi at the time of this study. Qualitative PCR was performed using primer pairs for S35 and S36 kinetoplast sequences (25). Qualitative PCR was also performed using TCZ3/TCZ4 microsatellite sequences (26).
Therefore, we analysed four groups. There were 10 indivi-duals with chronic CD and not infected with HIV (CHR group), 11 with chronic CD and HIV infection (CO group), 14 with HIV infection without CD (HIV group) and 15 healthy individuals (C group). The C group consisted of individuals reporting the absence of CD, HIV diagnosis or any other chronic or acute illnesses, with CD4+ and CD8+ levels above those associated with susceptibility to opportunistic diseases (4500 cells/mm3) and agedo50 years old.
We assessed the frequencies of CD4+ or CD8+ T cells staining positive for IL-2, IFN-g, IL-4, and IL-10 after being
incubatedin vitrowith SAg and/or mitogens (phorbol and ionomycin), according to the methods described below.
Concerning the available data on the clinical form of CD in individuals with or without HIV infection, we compared two sub-groups of CD: typical digestive and/or cardiac manifes-tation (TDC) (n=8) and indeterminate form (IND) (n=8). Two patients with an atypical clinical (AT) form of CD and three with an unknown or non-identified (NI) form of CD were excluded from these analyses.
Cell Preparation andIn VitroStimulation with Soluble
Antigen ofT. cruziTrypomastigote (SAg)
Samples of peripheral blood mononuclear cells (PBMCs) were isolated from heparinized venous blood (30 mL) using density gradient sedimentation (1.077 g/mL) in accordance with the recommendations of the manufacturer (FicollPaque -Amersham Bioscience, Piscataway, NJ, USA). The cells were then washed three times with sterile phosphate-buffered
CLINICS 2017;72(11):652-660 Cytokines in Chagas disease and HIV infection
saline (PBS) without Mg++/Ca++(Gibco BRL, UK) and re-suspended at 2.5 x 10⁶cells/mL in RPMI 1640 (Gibco BRL, UK) supplemented with 10% heat inactivated foetal calf serum (HyClone, Logan, Utah, USA), 2 mM L-glutamine (Gibco BRL, UK) and antibiotics, according to Sousa e Victorino, (1998) (27) for in vitrostimulation and immunofluorescence staining of freshly isolated cells.
The soluble antigen obtained by complete disruption of 1.0 x 10⁶parasites/mL (10 cycles of freezing and thawing at the trypomastigote stage) was kindly provided by Dr. Ises de Almeida Abrahamsohn (Department of Immunology of the Institute of Biomedical Sciences of the University of São Paulo, SP, Brazil).
Two different antigenic stimuli were used to stimulate cells
in vitro, according to De Barros-Mazon et al. (2004) (20), but with some modifications. One set of cells was stimulated with specific soluble trypomastigote antigen (SAg) for 72 hours followed by brefeldin A (BFA, Sigma Chemical) at a final con-centration of 10 mg/ml and phorbol 12-myristate 13-acetate
(PMA, Sigma Chemical) + ionomycin (I, Sigma Chemical) at a final concentration of 50 ng/mL and 500 ng/mL, respec-tively, for the last 4 hours. In addition, another sample of cells was subjected to the same protocol with only PMA+I+
BFA and not SAg to measure the potential capability of each
cell to produce these cytokines. It has been shown that following stimulation of lymphocytes with PMA and ionomy-cin, a rapid down-regulation of CD4 molecules on the surface of lymphocytes occurs (28). In our hands, a rapid decrease in CD4 occurred within 4 hours after stimulation. Therefore, a negative-gating strategy (among CD3+ T cells, CD8- cells were selected) was used to measure the intracellular cytokine expression in CD3+CD4+cells. To normalize the comparison of inter-assay results, each assay analysed PBMCs from individuals in the four groups, with at least one individual of each group (C, CO, HIV and CHR) measured simultaneously.
Monoclonal Antibodies (MoAbs) for Intracellular and Cell Surface Staining
The following phycoerythrin-conjugated anti-human cyto-kines and corresponding isotype controls were used for each antibody and each patient: IL-2, clone M062626; anti-IFN-g, clone M064882; anti-IL-4, clone M064843; anti-IL-10,
clone M063277; rat IgG2a, clone M063752; and mouse IgG1, clone M056389. Surface staining was performed with anti-CD3 phycoerythrin-cyanin 5 (PE-Cy5), clone M047602, and anti-CD8 fluorescein isothiocyanate (FITC), clone M055034. All anti-bodies were purchased from Pharmingen (San Diego, CA).
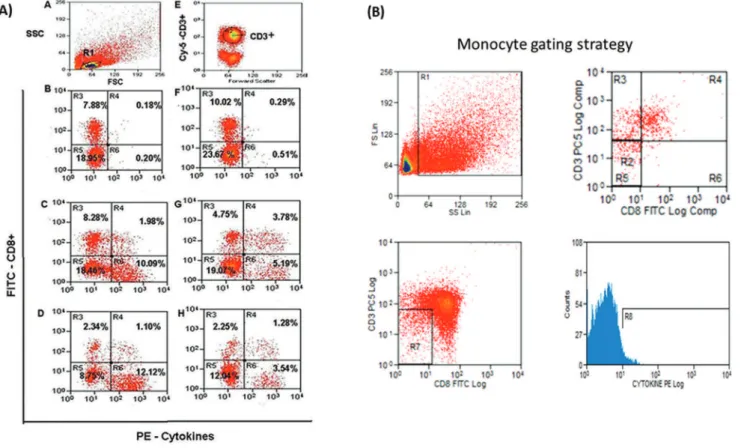
Figure 1 - Flow cytometric evaluation. (A)T. cruzi-stimulated cells.Lymphocytes in the R1 region based on the SSC/FSC (Side Scatter/Forward
Scatter) ratio; (E) CD3 surface marker staining on lymphocytes gated in R1; (B, C, D, F, G, H) CD8 surface- and intracellular IFN-g-stained cells
were simultaneously gated in R1 (lymphocytes) and R2 (CD3+cells). R3 and R5 regions represent CD8+and CD8- (i.e.: CD4+) cells negative for IFN-g, respectively; R4 and R6 represent CD8+IFN-g+and CD4+IFN-g+cells, respectively. Peripheral blood mononuclear cells were cultured for 72 h withoutT. cruziantigen (B, C, D) and withT. cruziantigen (F, G, H) and subsequently exposed to PMA, ionomycin, and brefeldin A (BFA) for the last 4 h. For each analysis, approximately 50,000 events were acquired on a FACSCalibur flow cytometer.
(B) Monocyte gate strategy.Flow cytometric acquisition and subsequent analysis were manually performed within a monocyte gate defined
Immunofluorescence Staining and Flow Cytometric Analyses
Cells were washed in PBS with 0.1% sodium azide (PBS-azide). First, the Fc receptors of the cells were blocked with 2mg of human IVIg (50mg/ml) and incubated for 20 minutes
at room temperature to decrease non-specific staining. Next, the cells were washed in PBS-azide and re-suspended in PBS (Gibco, without Ca+and Mg+) with 1% bovine serum albumin (BSA, Sigma) and 0.1% sodium azide (Azide) (stain-ing buffer). After surface stain(stain-ing with CD8 and anti-CD3 MoAbs, the cells were washed with staining buffer and fixed with PBS-1% paraformaldehyde (fixation buffer). These steps were performed at 4o
C in the dark. Subsequently, the cells were permeabilized with PBS with 1% BSA and 0.5% saponin (permeabilization buffer). Intracellular staining was performed by incubation with anti-IL-2, anti-IL-4, anti-IL-10, and anti-IFN-g MoAbs or respective isotype controls for 30 minutes at room temperature in the dark. Next, the cells were washed and re-suspended in PBS-azide for flow cytometric analysis.
For each analysis, approximately 50,000 events were acquired on a FACSCalibur flow cytometer (Becton-Dickinson, San Jose, CA, USA). Flow cytometric acquisition was performed within a lymphocyte gate defined for each sample using CellQuest (BD Bioscience, Immunocytometry System) and displayed as dot plots showing cytokines (PE) versusCD3 (PE-Cy5) and CD8 (FITC) fluorescence in multiple dot plots. The CD8 dot plot was analysed for double dependence and CD3 expression on an FSC-SSC lymphocyte gate (Figure 1, Figure 1A). The monocyte gate was determined by FSC-SSC and exclusion of CD3+ and CD8+ populations (Figure 1, Figure 1 B).
Statistical Analysis
For comparisons between two groups, the Mann-Whitney test was used. For within-group comparisons, the Wilcoxon test was used. For comparisons among three groups (HIV, C and CHR), the Kruskal Wallis test was used. Statistical signi-ficance was set at 5% (po0.05). The Spearman correlation
coefficient was used to measure bivariate associations of the proportion of cytokines.
’ RESULTS
Clinical and Laboratory Data of the Study Groups
Data regarding the clinical groups at the time of enrolling in the study are shown in Table 1.
The median age distribution was 30, 40, 47 and 42 years old for the C, HIV, CO and CHR groups, respectively. The proportion of male participants was lower in the CHR group (30.0%) than in the CO group (54.5%) and HIV group (78.6%), but the differences did not reach statistical sig-nificance among these groups (Kruskal Wallis test,p=0.9639). There was an equal proportion of females in the CHR group and C group (70-73%). Moreover, there was no difference in the CD4+cell count among the HIV, CO and CHR groups (Kruskal Wallis test,p=0.0921) (Table 1A).
The distribution of CD sub-groups and the mean CD4+
cell count among individuals with positive (n=4) and negative parasitaemia (n=11) detected by haemoculture, xenodiagnosis and PCR were also presented. PCR analysis for parasite DNA fragments was positive in two chagasic individuals with HIV infection (CO group) of eight avail-able plasma samples. The CD4+ cell count tended to be higher in individuals with negative parasitaemia than with positive parasitaemia, but without statistical significance (Table 1B).
Table 1A-Study groups according to CD4+cell count, age, sex and sub-groups of Chagas disease.
Variables groups C HIV CO CHR
n 15 14 11 10
CD4+count /cells/mm3 median (min-max) 961 (933-988) 475 (243-870) 505 (218-837) 855 (551-1198)
Age years (median) 30 40 47 42
Female % 73.0 21.4 45.5 70.0
Subgroups of CD
TDC n NA NA 4 4
IND n NA NA 4 4
AT n NA NA 2 0
NI n NA NA 1 2
min=minimum; max=maximum; n=number of individuals; CD=Chagas disease; C=healthy controls; HIV=HIV infection; CO=co-infected with Chagas disease and HIV; CHR=chronic Chagas disease; TDC=typical digestive and/or cardiac involvement; IND=indeterminate form of CD; AT=atypical form of CD; NI=not identified; NA=not applied; (SD)=standard deviation; n=number of patients.
Table 1B-CD4 cells/mm3in 15 Chagas disease individuals (ALL) according to the presence of parasitaemia (detected by PCR, haemoculture and xenodiagnoses).
ALL Chagas disease Positive parasitemia
Negative parasitemia
Disease form (Number of Patients)
n n
CO and IND 1 3
CO and TDC 1 4
CHR and IND 1 2
CHR and TDC 1 1
CHR and NI 0 1
HIV viral load (copies/mL)
Mean (SD) 3.6 (3.5)a 4.3 (4.1)b
Indetectable (%) 25.0 66.7
Mean (SD) CD4 cells/mm3 361 (166)c 680 (278)c
Total Number of Patients 4 11
CD=Chagas disease; C=healthy controls; HIV=HIV infection; CO=co-infected with Chagas disease and HIV; CHR=chronic Chagas disease; TDC=typical digestive and/or cardiac involvement; IND=indeterminate form of CD; AT=atypical form of CD; NI=not identified; (SD)=standard deviation; n=number of patients.
atwo with available HIV viral load data. bsix with available HIV viral load data. cp
40.05 between CD4+cells of positive and negative parasitaemia patients (Mann-Whitney test).
CLINICS 2017;72(11):652-660 Cytokines in Chagas disease and HIV infection
Figure 2 - Comparison of the potential capability of T cells to produce cytokines. (A-D) Proportion of cytokines on CD4+T cells. (E-H)
Proportion of cytokines on T CD8+T cells.C = healthy controls; HIV = HIV infection; CO = co-infected with Chagas disease and HIV;
Comparison of the Phenotype Frequency of Cytokines
on CD4+and CD8+T cells from the C, HIV, CO, and
CHR Groups
In the Absence of SAg Antigen. The potential capacity of production of IL-2+and IFN-g+Tcells in the CHR group was low, as determined by comparing the CHR group with each other group (C, HIV, CO) and shown in Figure 2 (Figure 2A, 2B, 2E). No significant differences were found in other cellular phenotypes (Figure 2C, 2D, 2F, 2G, 2H).
In the Presence of In Vitro SAg Stimulation. When we compared cells stimulated and non-stimulated with SAg from healthy individuals (group C) in particular, we observed a reduced proportion of IL-2+CD4+and IFN-g+CD4+cells in the presence of SAg, as shown in Figure 3 (Figure 3A, Figure 3B). We found no significant differences when we compared other T cell phenotypes from the CO, CHR and HIV groups in the presence or absence of SAg.
Comparison between the Indeterminate Form and Typical Clinical Manifestation of CD
The results indicated a differential frequency of cell pheno-types between the IND and TDC sub-groups of CD (n=16), as shown in Figure 4.
In Both the TDC (n=8) and IND (n=8) sub-groups, half of the patients were HIV-infected patients with low or undetectable viral load. In addition, six positive parasitolo-gical tests were detected in the sub-groups of CD.
In the absence of SAg, the frequencies of IL-2+CD8+and IL-10+CD8+ phenotypes were higher in sub-group IND than in sub-group TDC (Mann-Whitney test, p=0.0080 and 0.0426, respectively). Conversely, the frequency of the IL-2
+CD8+phenotype in IND was lower in the absence of SAg than in the presence of SAg (IND and IND*, Wilcoxon test,
p=0.0078). Furthermore, in the presence of cellular stimula-tion by SAg, the proporstimula-tion of IFN-g+CD8+cells was lower in IND than in TDC (Mann-Whitney test,p=0.0464). Similarly, we observed that the frequency of this phenotype was signi-ficantly lower in all chagasic individuals, even in those
co-infected with HIV (ALL and ALL*, Mann-Whitney test,
p=0.0317, Figure 4).
We also found a negative correlation between IFN-gand
IL-10 (p=0.0390; r=-0.6691) when the source of cytokines was CD8+T cells derived from chronic chagasic patients.
’ DISCUSSION
We have described the profile of intracellular cytokine production in T cells from HIV-infected and/or chagasic individuals by focusing on three important aspects, showing that T. cruzi exposure played a pivotal role in the down-regulation of inflammatory cytokine-producing T cells in human infections.
First, we showed that the potential capability of T cells to produce IL-2 and IFN-g was lower in individuals with
chronic CD compared with each of the other groups analysed (HIV, CO or C). IL-2 has been described as a prototypic Th1 cytokine, being essential for the differentiation and activation of regulatory T cells, and as noted here, the decreased IL-2 production in chronic CD seems to suggest that an adap-tive activation mechanism is triggered by prior exposure to
T. cruzi infection (Figure 2, Figure 2A, 2B and 2E). The decreased inflammatory profile could be associated with the pathogenesis of cardiac and gastrointestinal diseases, since the immunoregulatory features seem to be linked to the indeterminate form of CD (29, 30).
Second, we observedin vitroan immunomodulatory effect of SAg, mainly expressed in cells from healthy individuals. In fact, a significant down-regulation of IL-2+CD4+ and IFN-g+CD4+ cells was observed in healthy individuals (group C), who reported the absence of acute or chronic disease and did not belong to the risk group exposed to
T. cruzi or HIV infection (Figure 3, Figure 3A, Figure 3B). We observed the absence of this effect in the CHR group, as these cell phenotypes were already low at background level in these patients. Corroborating our data, other protocols based either on soluble antigen or on cell cultures stimulated by living trypomastigotes suggest that this effect of the
HIV-T. cruziinteraction on cytokine secretion is parasite driven (31, 32). By contrast, protocols based on cellular stimulation with epimastigotes or recombinant B13 antigen do not seem
Figure 3 - Comparison of the proportion of cytokines on T cells with and without SAg stimulus. (A). IL-2+CD4+. (B) IFN-c+CD4+.
The asterisk (*) represents the condition in which cells were stimulated with solubleT. cruziantigen. The difference between non-stimulated and non-stimulated* cells was significant for IL-2+CD4+(Wilcoxon test,p=0.0093) and IFN-g+CD4+T cells (Wilcoxon test,
p=0.048). No statistically significant differences were observed in relation to the other phenotypes.
CLINICS 2017;72(11):652-660 Cytokines in Chagas disease and HIV infection
to induce a suppressive immune response like the response observed in this study using trypomastigote antigen (20).
Third, despite the limited sample size, we observed a polar-ized Th1 CD8+ T cell response when cells from chagasic individuals were exposed in vitro to SAg stimuli, thus dis-tinguishing the typical digestive/cardiac form (TDC group) from the indeterminate form of CD (IND group) (Figure 4). In the TDC group, we clearly verified an up-regulation of inflammatory cytokines on CD8+ T cells challenged with soluble trypomastigote antigen. However, the biased inflam-matory response characterizing individuals with the cardiac and/or digestive form of CD (33) could be justified by the absence of the activation of a regulatory immune mechanism. Moreover, the profile of cytokines observed in the IND sub-group has been previously suggested to be a strategy that improves the chances of parasite survival (28). Additionally, CD8+T cells seem to play a role in the balance between pro-inflammatory responses to eradicate the pathogen and anti-inflammatory responses to limit inflammation as described in CD and other infections (34,35). In fact, the TDC sub-group presented a lower frequency of IL-10+CD8+ cells and a higher frequency of IFN-g+CD8+cells than individuals with the indeterminate form of CD (IND). This was especially true for individuals with HIV infection (Figure 4, red points).
Nevertheless, studies on the source of IL-10 in humans are conflicting, partly due to the different assessment methods used (36,37,38). Thus, we also assessed the production of IL-10 by monocytes with and without SAg stimulation, but we did not find any significant difference between the clinical groups (data not shown). On the other hand, we were able to detect a significant difference between the IND and TDC sub-groups in relation to the IL-10+CD8+phenotype. Our findings corroborate the fact that IL-10 produced by T cells seems to act mainly as a regulatory cytokine to protect the infected hosts against unwanted excessive Th1 activation and severe inflammatory pathology (20,29,34).
Our patients exhibited a trend of higher IL-4 production by SAg-stimulated CD4+ T cells in the co-infected (CO) group compared with the HIV group, similar to the patients studied by Rodrigues et al. (2005) (18). The percentage of IL-4-producing CD4+T cells stimulated by SAg varied from zero to 27.47% with a median of 10.71% in the CO group, while in HIV group, the same cell population was between zero and 46.79% with a median of 0.0% (p=0.0957).
Moreover, the same tendency was noted by comparing the CO and CHR groups, as the former tended to show higher percentages of SAg-stimulated IL-4-producing CD4+T cells than the latter. The percentage of IL-4-producing SAg-stimulated CD4+T cells varied from zero to 27.47% with a median of 10.71% in the CO group, while that of the CHR group varied from zero to 20.84% with a median of 4.24% (p=0.1108). This trend was not observed when we compared the non-SAg-stimulated CD4+T cells of the CO group with those of the HIV or CHR groups. These data suggest that SAg can induce the synthesis of IL-4 and that the co-infected group is more sensitive to this stimulus.
Recently, studies have characterized the adaptive immune response in different epidemiologic contexts. In fact, the interference of previous exposure to a specific antigen (vacci-nated or not) has been reported in both dual infections or other models of infections involving HIV. In the infection model ofSchistosomain mice, the suppression of the immune response to a Th1-type HIV vaccine and impaired expansion of pathogen-specific cytotoxic CD8+ T cell responses was
Figure 4 - Proportion of cytokine-producing CD8+ T cells in
chagasic sub-groups. (A) IL-2+CD8+. (B) IFN-c+CD8+. (C) IL-10+
reported (21). In addition, in children living with HIV, higher CD4+ T cell activation leads to poor vaccine response, which may be related to a disequilibrium of T regulatory responses (39, 40). In infant macaques vaccinated with BCG or M. tuberculosis, CD4+T cells were persistently activated in oral and/or gastrointestinal tissues, which may have facilitated oral SIV infection, according to the authors (41). Moreover, in HIV-infected Kenyan infants, higher central memory Th1 responses to M. tuberculosis antigens were observed at three months, but reduced effector memory Th1 responses to vaccine antigens were seen at three and 12 months. Long-term monitoring of vaccine efficacy and T-cell immunity in this vulnerable population is warranted (42).
Our study, however, has some important limitations. First, because it was not possible to obtain serial CD4+cell counts, HIV viral loads or parasitological data, it would be very useful to verify additional relationships with immune responses. This fact is directly linked to the limited access patients with CD have to medical assistance and diagnosis. Second, our critical findings were based on a limited number of available samples. However, we screened a rare and well-characterized group of HIV and/or chagasic individuals.
’ ACKNOWLEDGMENTS
The authors would like to thank Mrs. Erika Gakiya from the Laboratory of Parasitology (LIM46) of HCFMUSP and Mrs. Célia Regina Furucho from the Laboratory of Immunology (LIM 48) of HCFMUSP for technical sup-port and to Prof. Ises A. Abrahamson from the Department of Immunology of the Institute of Biomedical Sciences of the University of São Paulo for supplying soluble T. cruzi trypomastigote antigens. Sponsorship: Japan International Cooperation (JICA) and State of São Paulo Foundation for Research Support (FAPESP 2012/50273-0).
’ AUTHOR CONTRIBUTIONS
Tozetto-Mendoza TR and Vasconcelos DM were responsible for writing and revising the manuscript, performing the cellular assays, analysing the data and supervising the study. Ibrahim KY and Sartori AM were responsible for the clinical analysis of the participants and paper revision. Bezerra RC and de Freitas VL were responsible for performing the parasitological tests. Shikanai-Yasuda MA was responsible for the study coordination and for writing and critically revising the manuscript.
’ REFERENCES
1. Dias JC, Ramos AN Jr, Gontijo ED, Luquetti A, Shikanai-Yasuda MA, Coura JR, et al. 2nd Brazilian Consensus on Chagas Disease, 2015. Rev Soc Bras Med Trop. 2016; 49Suppl 1 (Suppl 1): 3-60.
2. Kirchhoff LV, Gam AA, Gilliam FC. American trypanosomiasis (Chagas’ disease) in Central American immigrants. Am J Med. 1987;82(5):915-20, http://dx.doi.org/10.1016/0002-9343(87)90152-5.
3. Schmunis GA, Zicker F, Cruz JR, Cuchi P. Safety of blood supply for infectious diseases in Latin American countries, 1994-1997. Am J Trop Med Hyg. 2001;65(6):924-30, http://dx.doi.org/10.4269/ajtmh.2001.65.924. 4. Schmunis GA, Yadon ZE. Chagas disease: a Latin American health
pro-blem becoming a world health propro-blem. Acta Trop. 2010;115(1-2):14-21, http://dx.doi.org/10.1016/j.actatropica.2009.11.003.
5. Garcia MN, Woc-Colburn L, Aguilar D, Hotez PJ, Murray KO. Historical Perspectives on the Epidemiology of Human Chagas Disease in Texas and Recommendations for Enhanced Understanding of Clinical Chagas Disease in the Southern United States. PLoS Negl Trop Dis. 2015;9(11): e0003981, http://dx.doi.org/10.1371/journal.pntd.0003981.
6. World Healthy Organization. Chagas disease (American Trypanoso-miasis). [Internet] Geneva: World Healthy Organization; 2015 [cited 2015 Nov 13]. Updated Mar 2017. Available: http://www.who.int.mediacentre/ factsheets/fs340/en/
7. Umezawa ES, Stolf AM, Corbett CE, Shikanai-Yasuda MA. Chagas’ disease. Lancet. 2001;357(9258):797-9, http://dx.doi.org/10.1016/S0140-6736(00)04174-X.
8. Grant IH, Gold JW, Wittner M, Tanowitz HB, Nathan C, Mayer K, et al. Transfusion-associated acute Chagas disease acquired in the United
States. Ann Intern Med. 1989;111(10):849-51, http://dx.doi.org/10.7326/ 0003-4819-111-10-849.
9. Riarte A, Luna C, Sabatiello R, Sinagra A, Schiavelli R, De Rissio A, et al. Chagas’disease in patients with kidney transplants: 7 years of experience 1989-1996. Clin Infect Dis. 1999;29(3):561-7, http://dx.doi.org/10.1086/ 598634.
10. Altclas J, Sinagra A, Dictar M, Luna C, Verón MT, De Rissio AM, et al. Chagas disease in bone marrow transplantation: an approach to preemptive therapy. Bone Marrow Transplant. 2005;36(2):123-9, http://dx.doi.org/10.1038/sj.bmt.1705006.
11. Campos SV, Strabelli TM, Amato-Neto V, Silva CP, Bacal F, Bocchi EA, et al. Risk factors for Chagas’disease reactivation after heart transplan-tation. J Heart Lung Transplant. 2008;27(6):597-602, http://dx.doi.org/ 10.1016/j.healun.2008.02.017.
12. Sartori AM, Lopes MH, Caramelli B, Duarte MI, Pinto PL, Neto V, et al. Simultaneous occurrence of acute myocarditis and reactivated Chagas’ disease in a patient with AIDS. Clin Infect Dis. 1995;21(5):1297-9, http:// dx.doi.org/10.1093/clinids/21.5.1297.
13. Almeida EA, Ramos Júnior AN, Correia D, Shikanai-Yasuda MA. Co-infection Trypanosoma cruzi/HIV: systematic review (1980-2010). Rev Soc Bras Med Trop. 2011;44(6):762-70, http://dx.doi.org/10.1590/ S0037-86822011000600021.
14. Almeida EA, Lima JN, Lages-Silva E, Guariento ME, Aoki FH, Torres-Morales AE, et al. Chagas’disease and HIV co-infection in patients without effective antiretroviral therapy: prevalence, clinical presentation and natural history. Trans R Soc Trop Med Hyg. 2010;104(7):447-52, http://dx.doi.org/10.1016/j.trstmh.2010.02.004.
15. World Health Organization. Global AIDS. Updated 2016. Available 2 June 2017: http://www.who.int.entity/hiv/pub/arv/global-AIDS-update-2016_en.pdf?ua=1-79K.
16. Laucella SA, Postan M, Martin D, Hubby Fralish B, Albareda MC, Alvarez MG, et al. Frequency of interferon- gamma -producing T cells specific for Trypanosoma cruzi inversely correlates with disease severity in chronic human Chagas disease. J Infect Dis. 2004;189(5):909-18, http://dx.doi. org/10.1086/381682.
17. Bailer RT, Holloway A, Sun J, Margolick JB, Martin M, Kostman J, et al. IL-13 and IFN-gamma secretion by activated T cells in HIV-1 infection associated with viral suppression and a lack of disease progression. J Immunol. 1999;162(12):7534-42.
18. Rodrigues DB, Correia D, Marra MD, Giraldo LE, Lages-Silva E, Silva-Vergara ML, et al. Cytokine serum levels in patients infected by human immunodeficiency virus with and without Trypanosoma cruzi coinfection. Rev Soc Bras Med Trop. 2005;38(6):483-7, http://dx.doi.org/ 10.1590/S0037-86822005000600007.
19. Maggi E, Mazzetti M, Ravina A, Annunziato F, de Carli M, Piccinni MP, et al. Ability of HIV to promote a TH1 to TH0 shift and to replicate preferentially in TH2 and TH0 cells. Science. 1994;265(5169):244-8, http:// dx.doi.org/10.1126/science.8023142.
20. de Barros-Mazon S, Guariento ME, da Silva CA, Coffman RL, Abrahamsohn IA. Differential regulation of lymphoproliferative res-ponses to Trypanosoma cruzi antigen in patients with the cardiac or indeterminate form of Chagas disease. Clin Immunol. 2004;111(1):137-45, http://dx.doi.org/10.1016/j.clim.2004.01.002.
21. Bui CT, Shollenberger LM, Paterson Y, Harn DA. Schistosoma mansoni soluble egg antigens enhance T cell responses to a newly identified HIV-1 Gag H-2b epitope. Clin Vaccine Immunol. 2015;22(2):193-9, http://dx.doi. org/10.1128/CVI.00514-14.
22. Sartori AM, Ibrahim KY, Nunes Westphalen EV, Braz LM, Oliveira OC Jr, Gakiya E, et al. Manifestations of Chagas disease (American trypanoso-miasis) in patients with HIV/AIDS. Ann Trop Med Parasitol. 2007;101(1): 31-50, http://dx.doi.org/10.1179/136485907X154629.
23. Borges-Pereira J, Willcox HP, Marcondes CB, Coura JR. Parasitemia em pacientes chagásicos crônicos avaliada pelo índice de triatomínios infec-tados no xenodiagnóstico. Rev Soc Bras Med Trop. 1989;22(1):39-44, http://dx.doi.org/10.1590/S0037-86821989000100007.
24. Luz ZM, Coutinho MG, Canc¸ado JR, Kretti AU. Hemocultura: técnica
sensível na detecc¸ão do Trypanosoma cruzi em pacientes chagásicos na
fase crônica da doenc¸a de Chagas. Rev Soc Bras Med Trop. 1994;27(3):143-8,
http://dx.doi.org/10.1590/S0037-86821994000300004.
25. Britto C, Cardoso MA, Wincker P, Morel CM. A simple protocol for the physical cleavage of Trypanosoma cruzi kinetoplast DNA present in blood samples and its use in polymerase chain reaction (PCR)-based diagnosis of chronic Chagas disease. Mem Inst Oswaldo Cruz. 1993;88(1):171-2, http:// dx.doi.org/10.1590/S0074-02761993000100030.
26. de Freitas VL, da Silva SC, Sartori AM, Bezerra RC, Westphalen EV, Molina TD, et al. Real-time PCR in HIV/Trypanosoma cruzicoinfection with and without Chagas disease reactivation: association with HIV viral load and CD4 level. PLoS Negl Trop Dis. 2011;5(8):e1277, http://dx.doi. org/10.1371/journal.pntd.0001277.
27. Sousa AE, Victorino RM. Single-cell analysis of lymphokine imbalance in asymptomatic HIV-1 infection: evidence for a major alteration within the CD8+T cell subset. Clin Exp Immunol. 1998;112(2):294-302, http://dx. doi.org/10.1046/j.1365-2249.1998.00585.x.
CLINICS 2017;72(11):652-660 Cytokines in Chagas disease and HIV infection
28. O’Neil-Andersen NJ, Lawrence DA. Differential modulation of surface and intracellular protein expression by T cells after stimulation in the presence of monensin or brefeldin A. Clin Diagn Lab Immunol. 2002; 9(2):243-50.
29. Dutra WO, Gollob KJ. Current concepts in immunoregulation and patho-logy of human Chagas disease. Curr Opin Infected Dis. 2008;21(3):287-92, http://dx.doi.org/10.1097/QCO.0b013e3282f88b80.
30. de Araujo FF, Correa-Oliveira R, Rocha MO, Chaves AT, Fiuza JA, Fares RC, et al. Foxp3+CD25(high) CD4+ regulatory T cells from indeterminate patients with Chagas disease can supress the effector cells and cytokines and reveal altered correlations with disease severity. Immunobiology. 2012;217(8): 768-77, http://dx.doi.org/10.1016/j.imbio.2012.04.008.
31. Mosca W, Briceño L, Hernández MI. Cell mediated immunity in Chagas’ disease.Trypanosoma cruziantigens induce suppression of the in vitro proliferative response of mononuclear cells. Mem Inst Oswaldo Cruz. 1991;86(2):147-52, http://dx.doi.org/10.1590/S0074-02761991000200002. 32. Van Voorhis WC. Coculture of human peripheral blood mononuclear cells
withTrypanosoma cruzileads to proliferation of lymphocytes and cytokine production. J Immunol. 1992;148(1):239-48.
33. Couper KN, Blount DG, Riley EM. IL-10: the master regulator of immunity to infection. J Immunol. 2008;180(9):5771-7, http://dx.doi.org/10.4049/ jimmunol.180.9.5771.
34. Machado FS, Dutra WO, Esper L, Gollob K, Teixeira MM, Factor SM et al. Current understanding of immunity toTrypanosoma cruziinfection and pathogenesis of Chagas disease. Semin Immunopathol. 2012;34(6):753-70, http://dx.doi.org/10.1007/s00281-012-0351-7.
35. Sun L, St Leger AJ, Yu CR, He C, Mahdi RM, Chan CC, et al. Interferon Regulator Factor 8 (IRF8) Limits Ocular Pathology during HSV-1 Infection by Restraining the Activation and Expansion of CD8+T Cells. Plos One. 2016;11(5):e0155420, http://dx.doi.org/10.1371/journal.pone.0155420. 36. Brockman MA, Kwon DS, Tighe DP, Pavlik DF, Rosato PC, Sela J, et al.
IL-10 is up-regulated in multiple cell types during viremic HIV infection
and reversibly inhibits virus-specific T cells. Blood. 2009;114(2):346-56, http://dx.doi.org/10.1182/blood-2008-12-191296.
37. Kwon DS, Angin M, Hongo T, Law KM, Johnson J, Porichis F, et al. CD4+ CD25+ regulatory T cells impair HIV-1-specific CD4 T cell responses by upregulating interleukin-10 production in monocytes. J Virol. 2012; 86(12):6586-94, http://dx.doi.org/10.1128/JVI.06251-11.
38. de Melo AS, de Lorena VM, de Moura Braz SC, Docena C, de Miranda Gomes Y. IL-10 and IFN-g gene expression in chronic Chagas disease patients after in vitro stimulation with recombinant antigens of Trypa-nosoma cruzi. Cytokine. 2012;58(2):207-12, http://dx.doi.org/10.1016/ j.cyto.2012.01.008.
39. Milagres LG, Costa PR, Silva GP, Carvalho KI, Pereira-Manfro WF, Ferreira B, et al. Subsets of memory CD4+T cell and bactericidal anti-body response to Neisseria meningitidis serogroup C after immunization of HIV-infected children and adolescents. PLoS One. 2014;9(12):e115887, http://dx.doi.org/10.1371/journal.pone.0115887.
40. Milagres LG, Costa PR, Santos BA, Silva GP, Cruz AC, Pereira-Manfro WF, et al. CD4+T-cell activation impairs serogroupC Neisseria meningitis
vaccine response in HIV-infected children. AIDS. 2013;27(17):2697-705, http://dx.doi.org/10.1097/QAD.0000000000000007.
41. Jensen K, Dela Pena-Ponce MG, Piatak M Jr, Shoemaker R, Oswald K, Jacobs WR, et al. Balancing trained immunity with persistent immune activation and the risk of Simian Immunodeficiency Virus Infection in infant macaques vaccinated with attenuatedMycobacterium tuberculosisor Mycobacterium bovis BCG vaccine. Clin Vaccine Immunol. 2016; 24 (1). pii:e00360-16, http://dx.doi.org/10.1128/CVI.00360-16.