*UFRJ, Rio de Janeiro, RJ, Brasil Recebido 05/10/2011; Aceito 22/10/2012
The relationship between the logistics complexity of
manufacturing companies and their
supply chain management
Peter Fernandes Wankea*, Henrique Luiz Corrêab
a*[email protected], UFRJ, Brasil
b[email protected], Rollins College, Estados Unidos da América
Abstract
This study aims to investigate whether, and the means by which, supply chain managers of large manufacturing companies adopt a context-dependent approach (also called contingency approach) in their supply chain decisions; it empirically explores the correlation between logistics complexity-related contextual conditions and supply chain management (SCM) objectives and decision areas. The study involves a comprehensive literature review, followed by an analysis of survey data (based on a sample of 108 large manufacturing companies in Brazil), using cluster analysis, factor analysis and binary logistic regression. In this study, we not only investigate the major effects of supply chain objectives and decision areas as predictors of the logistics complexity of manufacturing but also investigate their second order interactions. Statistically significant relationships were found between logistics complexity-related contextual conditions and objectives and decision areas involving the supply chain. The managers of large companies who were surveyed considered different objectives and decision areas to be critical to the achievement of supply chain excellence when their companies had different levels of logistics complexity.
Keywords
Brazilian companies. Logistics complexity. Supply chain management. Decision areas. Contingency approach.
1. Introduction
Central to the contingency approach is the proposition that the structure and process of an organization must fit its context. The contingency approach to management basically argues that there is no one best way to manage (DRAZIN; VAN DE VEN, 1985). This is in contrast with the “best practice” approach (VOSS, 1995), which is reflected in the proliferation of operations and supply chain management practices that have frequently and long been considered by some advocates as having universal applicability such as total quality management (FEIGENBAUM, 2004), six sigma (MARTIN, 2007) and lean production (WOMACK; JONES; ROOS, 1990; JONES; WOMACK, 2003).As a counter-example,Fearne and Fowler (2006) challenged conventional thinking with respect to the universal applicability of lean principles when analyzing the construction industry.
most adequate planning approach for each situation in the supply chain.
A number of research papers reported in the supply chain management literature have contributed to the development of models that adopt the contingency approach, departing from Fisher’s seminal paper (1997). His model has been tested and enriched in several studies. For example, Li and O’Brien (2001) have carried out a quantitative analysis to mach product types to supply chains; Ramdas and Spekman (2000) explored the contingent relationship between supply chain management processes and the characteristics of the products being produced and delivered; Lee (2002) expanded the framework to consider the supply risk and uncertainty in upstream operations; Germain, Claycomb and Dröge (2008) studied the effectiveness of different organization structures to deal with different contextual conditions, namely the level of demand predictability faced by supply chains and Blackburn et al. (2004) suggested that different configurations of reverse supply chains should be used for different categories of products being commercially returned. These studies have demonstrated the importance of aligning management practices with context in achieving better supply chain performance.
This paper attempts to contribute to the development of the contingency approach applied to supply chain management. The relationships between logistics complexity-related contextual conditions (e.g., size of the company, number of stock keeping units (SKU), and frequency of product launches, among others) and two aspects of supply chain management are analyzed: (1) the perception of how critical supply chain managers consider different practices and decision areas (e.g., vendor-managed inventory, logistics and distribution networks, and sourcing) for achieving supply chain excellence and (2) the supply chain managers’perceptions of the criticality of different supply chain objectives (e.g., cost, customer service, time, response, and profitability) for achieving supply chain excellence.
Although it has been extensively shown that uncertainty, measured both in terms of demands and lead times, not only influences supply chain performance but also the decision course taken by managers, there are still some contradictory signs with respect to logistics complexity and the organizational size measures embedded within it (CHRISTENSEN; GERMAIN; BIROU, 2007). This research is an additional effort to understand size, as a key driver for logistics complexity, in supply chain decision making.More precisely, its general objective is to investigate whether and how supply chain executives of manufacturing companies adopt a contingency approach in their
supply chain management decisions, by focusing on whether logistics-complexity-related contextual conditions are significant contingency factors in their supply chain choices. Once it is understood whether the surveyed supply chain executives define different objectives and prioritize different decisions and practices depending on the complexity of their own company’s logistics conditions, a framework to differentiate supply chain management accordingly is provided.
More formal research questions are presented in the section following the research literature review discussed below.
2. Literature review
2.1.
Supply chain management practices
and decision areas
Frankel et al. (2008) define supply chain management as a framework that integrates logistics and distribution networks, production operations, and sourcing activities within and across companies.
2.1.1.
Integrated logistics and distribution
networks
The distribution network provides the basic physical infrastructure where the supply chain operates (BALLOU, 2001). Network design is critical for supply chains because it is a relevant area of capital investment and also because it is essential for a business to provide their markets the appropriate level of customer service (DOTOLI et al., 2005).
An integrated distribution network is a set of consecutive operating units (e.g., plants and warehouses) connected by common objectives as well as communication and transportation links (DOTOLI et al., 2005). Visibility is a critical element in the integration of distribution networks (GAUKLER; ÖZER; HAUSMAN, 2008), and for the purpose of this research it means the real-time capturing, monitoring, and sharing of relevant information between companies in the supply chain (BARTLETT; JULIEN; BAINES, 2007).
Barratt and Oke (2007) suggest that supply chain performance improves when member companies have demand, inventory, and process visibility. Apparently, the level of visibility could have different impacts in supply chains that are more or less complex.
to enhance supply chain visibility, to coordinate decision-making, and to improve performance (HELMS; ETTKIN; CHAPMAN, 2000; HOLMSTROM et al., 2002; KHADAR, 2007; RODRIGUEZ et al., 2008; CLAASSEN; WEELE; RAAIJ, 2008).
Network visibility supported by real-time information sharing can also create opportunities for the use of business intelligence (BI) that can better inform supply chain decision making (CHAN, 2006). BI is provided by IT-supported analytic processes that transform internal and external data into relevant information to support different initiatives, activities and decisions within the supply chain (SAHAY; RANJAN, 2008). According to Gulledge and Chavusholu (2008), IT-enabled BI can be an important component of a company supply chain’s ability to be more responsive and competitive.
It applied to supply chain integration is an important tool in enhancing visibility and managing supply chain demand. Demand management has become even more important because of the growth in supply chain uncertainty (BOWER, 2007) and logistics complexity over the past decade. Increases in uncertainty and complexity have been caused by several factors: increased competitive pressure, increased level of outsourcing, lead time variability with global sourcing, more frequent new product launches, new governmental regulations, price changes, exchange rate instability, and promotional activities.
Effective demand management is important when supply chains try to mitigate the bullwhip effect (LEE; PADMANABHAN; WHANG, 1997). Blankley (2008) and Blankley,Khouja and Wiggins (2008) add that the management of demand uncertainty and inventory optimization should be conducted simultaneously, whenever possible (COLLIN; LORENZIN, 2006).
As components of the integrated logistics and distribution networks, transportation (FABER; KOSTER; VELDE, 2002; GALBRETH; HILL; HANDLEY, 2008) and warehousing (GREEN, 2001; KADIYALA; KLEINER, 2005) are important drivers of supply chain responsiveness and agility. This has increased with the emergence of IT applications that have changed the way these activities operate to leverage global supply chain performance (MASON et al., 2003; STEFANSSON; LUMSDEN, 2009) in an increasingly complex world. Integrated systems that include TMS (transportation management systems), WMS (warehouse management systems) and global inventory visibility can lead to reduced costs and improved customer service (MASON et al., 2003).
2.1.2.
Integrated production operations
It is becoming increasingly important to consider the two operations – production and distribution – in conjunction so that synergies are achieved and supply chain performance is improved (PARK, 2005; ERENGUC; SIMPSON; VAKHARIA, 1999). By exploring opportunities to redesign physical and information flows that run through manufacturing and distribution operations, such as changing the flows from push to pull, firms can also help mitigate the bullwhip effect (NONINO; PANIZZOLO, 2007; MIEMCZYK; HOWARD, 2008; WANKE; ARKADER; RODRIGUES, 2008).
A change from push flows to pull flows also requires different ways of managing sales and orders (DEKKERS, 2006). Effective order management can help enhance visibility and agility (AFFONSO; MARCOTTE; GRABOT, 2008) while supporting the achievement of high customer service levels (KIRCHE; NADIPASAOGLU; KHUMAWALA, 2005). Empirical evidence seems to support a positive correlation between order management performance and customer satisfaction (BHARADWAJ; MATSUNO, 2006).
Postponement is also an important operations practice that can help improve supply chain performance (WANKE; ZINN, 2004), as the successful and highly acclaimed Dell supply chain model for desktop computer production demonstrates (FARHOOMAND; LOVELOCK; NG, 2000). Postponement may involve not only the delay of the differentiating final stages of production until a customer order is received (SKIPWORTH; HARRISON, 2006), but also direct distribution to customers, avoiding echeloned distribution via warehouses.
2.1.3.
Integrated sourcing
2.2.
Supply chain management objectives
Within effective supply chains, each company may have its own goals, but all members should share common supply chain objectives (MENTZER et al., 2001). Authors are not unanimous in defining lists of relevant objectives for supply chains. Nuthall (2003) for example identifies four key supply chain management objectives: cost, customer service, time and response, and profitability. Sharma and Bhagwat (2007) present a more comprehensive framework by grouping supply chain objectives under four different perspectives: finance, customer service, internal business, and innovation.
However, there seems to be agreement that, when establishing major supply chain objectives, companies should be aware of the nature of their impacts on other members in the chain (POHLEN; COLEMAN, 2005).
2.2.1.
Customer service objectives
One supply chain objective that is present in most authors’ lists relates to how well customers are served (SAHAY; GUPTA; MOHAN, 2006; SEBASTIÃO; GOLICIC, 2008). This can be captured by several measures (BOWERSOX; CLOSS; STANK, 1999), such as on-time delivery, order completeness (GAUDENZI; BORGHESE, 2006; SHARMA; BHAGWAT, 2007), on-time-in-full (OTIF), and perfect order (OTIF and in perfect condition) indexes (GUNASEKARAN; PATEL; TIRTIROGLU, 2001; GUNASEKARAN; PATEL; McGAUGHEY, 2004; SHARMA; BHAGWAT, 2007).
2.2.2.
Finance/cost-related objectives
Merely serving the customer well is not enough. Ellram and Liu (2002) argue that if supply chain management is to be integrated into the strategic management of companies, its objectives and measures of performance should also account for shareholder value and for the translation of non-financial performance into financial performance. The cash-to-cash cycle (GUNASEKARAN; PATEL; TIRTIROGLU, 2001; FARRIS II; HUTCHISON, 2002) and the cash-conversion cycle (TSAI, 2008) are examples of finance-based measures that encompass inbound, production and outbound material activities. These measures may be useful as ways to guide companies willing to increase inventory turnover as well as reduce costs in supply chains (POHLEN; COLEMAN, 2005; SHARMA; BHAGWAT, 2007).
There are other important objectives related to the efficient use of assets and to costs. The use of third-party logistics (3PL) providers, for example, can help in achieving higher levels of asset productivity and cost reductions in the supply chain (LIU et al., 2008).
2.2.3.
Reactivity/agility-related objectives
Another supply chain objective that is considered as important in the literature is the ability of the chain to adapt to changes in demand, also known as ‘reactivity’ (GAUDENZI; BORGHESE, 2006) or “agility” (LEE, 2004). Here, the argument is that supply chains should not only serve customers well and efficiently but that they should also be agile and lean in order to cope with a rapidly changing environment (CHOPRA; MEINDL, 2004; TANG; TOMLIN, 2008). However, the ability to build agile, and lean supply chains has not developed as rapidly as anticipated, not only because the development of IT to support these concepts is still under way, but also due to the lack of well-defined measures to assess performance (JAIN; BENYOUCEF; DESHMUKH, 2008). For the purposes of this research, and to avoid the use of vague definitions during data collection, the objective of achieving reactivity/ agility is broken into some of its constituent tasks: synchronizing supply chain via enhanced visibility, shortening lead times, and changing the business model from push to pull.
Effective IT adoption, collaboration, and process redesign, resulting in enhanced supply chain visibility and synchronization, seem to be important enablers of the ability to effectively react to demand changes and uncertainty (KOK et al., 2005; SWAFFORD; GHOSH; MURTHY, 2008; WANG; LIU; WANG, 2008). One key aspect regarding agility and leanness is how supply chains achieve benefits from visibility in terms of coping with demand uncertainty and achieving shortened lead times (FAWCETT et al., 2007). Visibility may enable companies to design/operate logistics networks so as to provide rapid response to markets (GUNASEKARAN; PATEL; TIRTIROGLU, 2001; BAKER, 2008). Visibility can also allow multi-echelon inventory synchronization to control demand uncertainty (KOK et al., 2005).
Visibility can also favor pull-type supply chains with higher inventory turnovers (WANG; LIU; WANG, 2008). The successful AutoGiro system, implemented by General Motors Brazil in 2000 to manage their spare parts supply chain, is based on increased visibility and integration across the chain and on transforming a traditional push system into a pull system (CORRÊA; NOGUEIRA JUNIOR, 2008).
2.3.
Contingency approach to supply chain
management
an organization (WREN, 1994). This is in contrast with the “best practice” approach to operations management, which would be more universally applicable – regardless of context.
The contingency approach applied to supply chain management would assume that there is no universal way to achieve excellence because contextual factors and situations vary, and they change over time. Supply chain excellence is the capability of a firm to excel in all dimensions of supply chain management that are important to the customer (KUEI et al., 2005). Nuthall (2003) suggests that the pursuit of supply chain excellence has a positive impact on the firm’s performance, thus contributing to the achievement of supply chain objectives. The frequency with which firms have changed their supply chain management decisions and practices and refocused their objectives indicates that finding or maintaining the best strategy is difficult in today’s rapidly changing business environment. According to Chow, Heaver and Henriksson (1995), the weaknesses of the “one best way” approach to supply chain excellence indicate that alternatives, such as applying contingency theory to supply chain management, could prove to be more useful foci for research. Bowersox, Closs and Stank (1999) also seem to concur that a contingency approach to supply chian management would a better approach to research than a “best practice” approach.
Still, the literature provides little discussion on the contingency approach related to supply chain management. Cigolini, Cozzi and Perona (2004) propose an interesting prescriptive framework to support the definition of the choice of supply chain tools and techniques to be used. In their work, supply chain management is considered to be contingent upon three variables: which phase is dominant within the end products’ life cycle (whether most products are in the launch, growth, maturity or decline phase in their product life cycles), the structural complexity of the product itself, and the type of supply chain (i.e., quick, efficient, or lean).Stonebraker and Liao (2006), departing from a similar perspective and exploring product and environmental contingencies, advocate that a strategic fit must exist between supply chain and environmental, strategic, and operations variables.
One important and highly visible contribution to the contingency approach to supply chain management comes from Fisher (1997). This model is also prescriptive. It has been often cited and has appeared in a number of popular textbooks on supply chain management, such as Simchi-Levy, Kaminski and Simchi-Levy (2003) and Wisner, Tan and Leong (2008). Fisher argues that supply chain design and management should be contingent upon
the type of product being delivered. According to this notion, products can be categorized as ‘functional’ or ‘innovative.’ Functional products are staples that usually satisfy basic needs; do not change much over time; have lower profit margins, longer life cycles, and, more importantly, low forecast uncertainty. Canned soup and washing powder are examples. Innovative products are the opposite: they have frequent product launches and changes, higher profit margins, shorter life cycles and usually less predictable demand. Here, fashion and electronics products provide good examples.
According to Fisher (1997), each category of product – functional or innovative – should require a different supply chain. Functional products would require more physically efficient supply chains where asset utilization and cost control (e.g., keeping low inventories by using pull systems and seeking economies of scale in all activities) would play a crucial role. Innovative products, however, would require more market-responsive supply chains, where, for example, excess buffer stocks of parts and finished products are normally needed and aggressive initiatives to reduce lead times should be pursued.
According to this notion, different practices and decisions regarding, for instance, the location and definition of safety stock levels, the emphasis on push vs. pull flows and the level of resource utilization would be contingent to the type of product being produced and delivered by the supply chain.
Ramdas and Spekman (2000) report findings of survey research that builds on Fisher’s (1997) work. Their survey is based on a sample of 208 companies that include high and low performers and producers of innovative and functional products. They conclude that in general terms there were no statistically significant differences in supply chain management practices in use between the total sample of innovative and functional producers. However when they compared innovative high performers with functional high performers they found significant differences in practices.This finding reinforces the idea that high performance can be associated with good alignment between context and practices.
performance (partially mediated by supply chain variability). Their findings also imply that to achieve higher levels of performance, supply chain managers should make choices and decisions that are contingent on context. Managers have always sought the best way to deal with the broad scope of supply chain management decisions and have focused on how different supply chain objectives should be prioritized. Pfohl and Zollner (1997) indicate that the answer to these questions requires an extensive analysis of important logistical contingency factors and their relationships to supply chain management choices. Under a contingency perspective, the right thing to do depends on contextual factors.
2.4.
Defining context in this research: the
role of logistics complexity
The application of contingency theory to supply chain management would require the identification of the way in which context-related factors might be related to supply chain performance. In this sense, according to Chow, Heaver and Henriksson (1995), environmental heterogeneity is a relevant contingency factor that can be defined as the degree of complexity in a firm’s logistical environment (e.g., number of markets, suppliers, products, and clients). More precisely, environmental complexity describes the number of units that require interaction and the amount of knowledge about products and customers that the manager must secure (STONEBRAKER; LIAO, 2006). Although the complexity of logistics systems is mentioned by some authors (see for e.g. CHRISTOPHER, 1998), and despite the fact that the issue of complexity has been variously studied in operations management and supply chain management research (VACHON; KLASSEN, 2002; HOOLE, 2005; STONEBRAKER; LIAO, 2006; BOZARTH et al., 2009), literature focusing specifically on logistics complexity is relatively scarce (NILSSON, 2006).
In some studies, operational complexity and size appear to be related. Masters et al. (1992, p. 47) analyzed the pattern of adoption of distribution resource planning (DRP) systems within 54 North American companies, and found that the decision to adopt DRP “is related to the size [of the firm] and complexity of the distribution systems,” and that “increases in either characteristic increased the likelihood of adoption.” Anderson and Katz (1998, p. 1), when studying strategic sourcing, noted an inseparable trend – namely, that the purchasing function “has been increasing in importance, size (total amount spent), and [therefore] complexity”. Germain and Droge (1995, p. 27) analyzed the factors leading
to just-in-time (JIT) adoption in North American companies. The authors found that
JIT correlated positively with size [of the firm]” and that“the extent of JIT is associated positively with environmental uncertainty, which may be a reflex of production complexity and number of SKUs [stock keeping units].”
According to the authors,
[…] proliferation in SKUs may mean a greater number of markets, new competitors, and energized existing customers, all of which may lead to perceptions of uncertainty in a [large] organization’s environment (GERMAIN; DROGE, 1995, p. 27).
Pfohl and Zollner (1997, p. 309) also recognize the relationship between the size of the firm and logistics complexity. They argue that while the number of production plants, warehouses, and the dependencies between them indicate the size of the organization, it can be assumed that, as these variables increase, the underlying environmental relations also increase in complexity and dynamics, in terms of the logistical tasks to be accomplished in supply, production, and distribution. Still, according to the authors, “the criteria of complexity cover the structural dimensions, number, and variety of the environmental relations which are relevant to logistics.” The number of employees, a variable frequently used to represent the size of the organization, affects structure and, therefore, logistics complexity (PFOHL; ZOLLNER, 1997, p. 309).
Complexity seems to be also related to the quantity, level and type of interactions present in a given system. According to Milgate (2001), complexity can be viewed as a deterministic component related to the number and variety of interacting elements in a system.Although related until some point complexity, differently from demand and lead time uncertainty, still presents some contradictory signs with respect to supply chain management. For example,according to Christensen, Germain and Birou (2007), while demand and lead time uncertainty are closely related to a poor financial performance, by means of additional inventories, the same could no be concluded in so far with respect to operations complexity and organizational size. This research should be understood as an additional effort to understand size, as a key driver for logistics complexity and as a single context mediator, in supply chain decision making.
(CHOW; HEAVER; HENRIKSSON, 1995; MASSON et al., 2007), number of employees (PFOHL; ZOLLNER, 1997), number of employees involved in supply chain management, number of active SKUs (CHOW; HEAVER; HENRIKSSON, 1995; LOWSON, 2007), number of distribution centers (RAO; Young, 1994; PFOHL; ZOLLNER, 1997; HOFFER; KNEMEYER, 2009), number of orders processed (RAO; YOUNG, 1994; HOFFER; KNEMEYER, 2009), and number of product launches per year (RAO; YOUNG, 1994; HOFFER; KNEMEYER, 2009).
We use the measures of logistics complexity to explore the possibility that companies’ level of logistics complexity may be an important contingency factor in supply chain management decisions. This would mean that supply chain managers may consider different objectives and different decision areas as critical when their companies face different levels of logistics complexity.
3. Research questions
Our basic proposition is that companies adopt a contingency approach to manage their supply chains. In order to investigate the validity of this
basic proposition, we will analyze the criticality perceived by companies’ executives in two areas of their supply chain management: the decision areas and the objectives they consider as critical, which are summarized in Table 1.
After characterizing the way in which companies manage their supply chains in terms of the two aforementioned areas, we then investigate the level of logistics complexity of the researched companies and try to find correlations between the level of logistics complexity and the way companies make their supply chain management choices, as depicted in Figure 1. We work with two major research questions (RQ):
RQ1. Are there significant relationships between logistics complexity and the criticality, as perceived
Figure 1. A contingency perspective of the impact of logistics complexity on supply chain management choices.
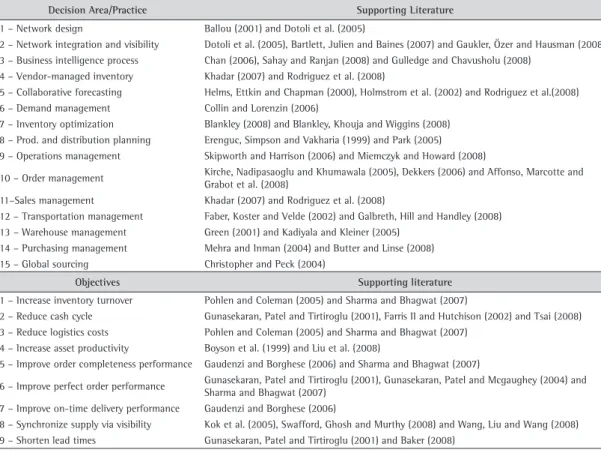
Table 1. Supply chain management-related decision areas/practices and objectives.
Decision Area/Practice Supporting Literature
1 – Network design Ballou (2001) and Dotoli et al. (2005)
2 – Network integration and visibility Dotoli et al. (2005), Bartlett, Julien and Baines (2007) and Gaukler, Özer and Hausman (2008) 3 – Business intelligence process Chan (2006), Sahay and Ranjan (2008) and Gulledge and Chavusholu (2008)
4 – Vendor-managed inventory Khadar (2007) and Rodriguez et al. (2008)
5 – Collaborative forecasting Helms, Ettkin and Chapman (2000), Holmstrom et al. (2002) and Rodriguez et al.(2008) 6 – Demand management Collin and Lorenzin (2006)
7 – Inventory optimization Blankley (2008) and Blankley, Khouja and Wiggins (2008) 8 – Prod. and distribution planning Erenguc, Simpson and Vakharia (1999) and Park (2005) 9 – Operations management Skipworth and Harrison (2006) and Miemczyk and Howard (2008)
10 – Order management Kirche, Nadipasaoglu and Khumawala (2005), Dekkers (2006) and Affonso, Marcotte and Grabot et al. (2008)
11–Sales management Khadar (2007) and Rodriguez et al. (2008)
12 – Transportation management Faber, Koster and Velde (2002) and Galbreth, Hill and Handley (2008) 13 – Warehouse management Green (2001) and Kadiyala and Kleiner (2005)
14 – Purchasing management Mehra and Inman (2004) and Butter and Linse (2008) 15 – Global sourcing Christopher and Peck (2004)
Objectives Supporting literature
1 – Increase inventory turnover Pohlen and Coleman (2005) and Sharma and Bhagwat (2007)
2 – Reduce cash cycle Gunasekaran, Patel and Tirtiroglu (2001), Farris II and Hutchison (2002) and Tsai (2008) 3 – Reduce logistics costs Pohlen and Coleman (2005) and Sharma and Bhagwat (2007)
4 – Increase asset productivity Boyson et al. (1999) and Liu et al. (2008)
5 – Improve order completeness performance Gaudenzi and Borghese (2006) and Sharma and Bhagwat (2007)
6 – Improve perfect order performance Gunasekaran, Patel and Tirtiroglu (2001), Gunasekaran, Patel and Mcgaughey (2004) and Sharma and Bhagwat (2007)
7 – Improve on-time delivery performance Gaudenzi and Borghese (2006)
by managers, of the different decision areas and objectives of supply chain management?
RQ2. Are there significant secondary interaction effects between decision areas and objectives that can be explained by logistics complexity?
4. Methodology
This study is exploratory and is intended to achieve a better understanding of supply chain management major features by uncovering possible relationships as stated in the proposed research questions. An empirical study based on data collected in a comprehensive survey was conducted to try to answer the proposed questions. Three fundamental issues are addressed next: data collection and non-response bias, measurement, and construct validity.
4.1.
Data collection and non-response bias
Respondents of the questionnaire consisted of high ranked managers involved with several aspects of the supply chain decision areas in large Brazilian companies. The survey was conducted in the last quarter of 2008. The survey population consisted of manufacturing companies included in the Exame 500 (a Brazilian listing similar to the Fortune 500 list).
All companies were contacted by telephone so as to verify whether they were willing to participate in the research. Questionnaire items were developed based on previous literature review and on results from in-depth interviews conducted with four large Brazilian manufacturing companies’ executives and focused on several aspects of supply chain management and logistics complexity. The main objective of this phase was to ensure that the questions included encompassed all relevant aspects regarding these issues.
The questionnaire was pre-tested to validate structure and content. A number of professors and managers with knowledge of logistics and supply chain management helped during this phase to finalize the substantive content of the questionnaire and avoid duplication. As a result, minor modifications were introduced. A pilot mailing was conducted with four companies to ensure that the research instrument would be well understood by target respondents to guarantee construct validity. Based on observations from these pilot respondents, a few questions were removed from the original questionnaire.
The electronic questionnaire was then sent out by e-mail to a mailing list of 273 manufacturing companies that had agreed to participate. The final sample consists of the 108 companies that returned usable questionnaires (response rate of 39.6% of the
sent questionnaires, which also represents 21.6% of the population of five hundred companies present in the Exame500 listing). All survey items were completed, with the exception of five questionnaires where information about gross revenue was missing. This piece of information was completed based on data provided by the Exame 500 listing.
Frequency distributions of the responses in terms of economic sector were cross-tabulated against corresponding data from the population to verify that there was no no-response bias. Three tests to measure the ordinal association between variables were performed: Goodman and Kruskal’s Gamma, Kendall’s Tau-B and Kendall’s Tau-C (RODRIGUES; STANK; LYNCH, 2004). No significant differences between sample and population distributions were determined at p < 0.05. The variables collected are presented in Table 2.
4.2.
Measurement and construct validity
One of the major issues in conducting surveys relates to construct validity. More specifically, construct validity assesses the transition from antecedents to theoretical correspondence (from the literature review) to empirical correspondence based on the data gathered during the survey (MENTZER; FLINT, 1997). From a measurement concern, the major components of construct validity encompass nomological validity and trait validity issues (which are composed of convergent validity, discriminant validity, and reliability).
According to Mentzer and Flint (1997), the degree to which the constructs fit within the logical network of theory is nomological validity, a measure of the theoretical correspondence between the theory and the constructs within the theory. Thus far, there is no statistical test of nomological validity, which should be qualitatively assessed by experts or cross-checked with the literature review. However, there are several steps that can be taken during the measurement process that can assure trait validity.
In the first step an exploratory cluster analysis was performed with SPSS 15.0 to split the 108 companies in the sample into two different groups using k-means: companies with high logistics complexity and companies with low logistics complexity. One of the unique characteristic of k-means clustering is the so-called uniform effect; that is, k-means tends to produce clusters with relatively uniform sizes (WU; XIONG; CHEN, 2009), which can be useful for group comparison in exploratory studies.
information. A common approach for evaluating clustering results is to use validity indexes. Clustering validity approaches can basically use two criteria: external, where the results are evaluated with respect to a pre-specified structure, and internal, where the results are evaluated with respect to intrinsic information as to the original data (RENDÓN et al., 2011). While many validation measures have been developed for evaluating the performance of clustering algorithms, these measures often provide inconsistent information about the clustering performance and the best suitable measures to use in practice remain unknown. Nevertheless, Wu, Xiong and Chen (2009) filled this crucial gap by presenting an organized study of 16 validation measures for k-means clustering, that is, by providing a guideline to select the most representative validation measures for k-means clustering.
In this research, two types of k-means cluster validity measurements were performed using the clValid package from R (BROCK et al., 2008): internal and stability measures. Similarly to Wu, Xiong and Chen (2009) and Rendón et al. (2011), internal validation measures take only the dataset and the clustering partition as inputs and use the intrinsic
information of the data to assess the quality of the clustering. On the other hand, the stability measures compare the results from clustering based on the full data to those based on removing each column, one at a time. Results presented in Section 5 indicate, under the light of the most fundamental clustering internal and stability validity measurements that two clusters correspond to an adequate representation of the surveyed companies.
After clustering an extraction of factors from the 15 variables related to supply chain management decision areas was conducted using Exploratory Factor Analysis (EFA) with Varimax standardized rotation for the data collected within the sample of 108 companies. In a similar way, as regards the supply chain management objectives an extraction of factors from its nine related variables was also conducted using EFA with Varimax standardized rotation. In both cases, only factor loads greater than 0.50 and eigenvalues greater than 1.0 were interpreted (TABACHNICK; FIDELL, 2001).
So, in order to validate the major results initially obtained from EFA, such as those related to variable selection, number of factors, and naming of factors, not only a Confirmatory Factor Analysis (CFA) was
Table 2. Surveyed variables potentially related to supply chain management and logistics complexity.
Dimension Research variables Mean SD Scale Type of scale
Supply chain decision areas and practices To what extent do you agree that each of the following supply chain management decision areas is critical for your company to achieve supply chain excellence?
1 - Network design
2 – Network integration and visibility 3 – Business intelligence process 4 – Vendor managed inventory 5 – Collaborative forecasting 6 – Demand planning 7 – Inventory optimization
8 – Production and distribution planning 9 – Operations management – postponement 10 – Order management
11 – Sales management 12 – Transportation management 13 – Warehouse management 14 – Purchasing management 15 – Global sourcing
3.73 3.82 3.65 2.75 2.94 3.81 4.24 4.08 3.46 3.69 2.39 4.24 4.20 3.90 3.41 1.48 1.40 1.39 1.60 1.64 1.49 1.19 1.24 1.46 1.44 1.62 1.24 1.25 1.46 1.60
5 = Strongly agree 3 = Neutral 1 = Strongly disagree
Ordinal
Supply chain objectives To what extent do you agree that each of the following supply chain management objectives is critical for your company to meet its most important performance objectives?
1 – Increase inventory turnover 2 – Reduce cash cycle 3 – Reduce logistics costs 4 – Increase asset productivity
5 – Improve order completeness performance 6 – Improve perfect order performance 7 – Improve on-time delivery performance 8 – Synchronize supply chain
9 – Shorten lead times
4.12 4.12 4.33 4.44 4.10 3.98 4.27 4.02 3.50 1.14 1.02 0.80 0.73 0.84 1.05 0.78 0.99 1.28
5 = Strongly agree 3 = Neutral 1 = Strongly disagree
Ordinal
Logistics complexity Please provide information on the following variables related to your company’s logistics complexity:
1 - Gross revenue 2 - Number of employees
3 - Number of employees involved in SCM 4 - Number of suppliers
5 - Number of active clients 6 - Number of active SKUs
7 - Number of product launchings (per year) 8 - Number of distribution centers 9 - Number of orders (per day)
performed using the sem package from the R software (HAIR; ANDERSON; TATHAM, 1998; STEIGER, 2012), but also a Multitrait Multimethod (MMTM) approach for scale validation (FALISSARD, 2012) using the psy package, equally from R. In both methods, a bootstrap sample size of 1,000 was considered.
As a matter of fact, the MMTM approach is simpler and more robust than CFA with respect to asymptotic limits - correlations vary from –1 to +1 (MAINDONALD; BRAUN, 2010; FALISSARD, 2012; RAYKOV, 2012) - what justifies the fact ofit being readily employed in social sciences when the increasingly popular latent variable methodology is used. Anyway, researchers should be aware of the key underlying ideas regarding the assessment of the convergent and discriminant validity of scales in both approaches: (i) variables belonging to the same factor should correlate highly among themselves, and (ii) variables belonging to different factors should not correlate highly (HAIR; ANDERSON; TATHAM, 1998).
As discussed later, results presented in Section 5 suggest both convergent and discriminant validity, after performing EFA, CFA, and MMTM, since all the questions related to a given construct - within either supply chain decision areas or objectives – loaded on one specific factor, and all the questions of a separate construct loaded on different factors (MENTZER; FLINT, 1997). Finally, as regards reliability – that is, how consistently the measures yield the same results through multiple applications – Cronbach’s alpha indicated satisfactory levels of reliability for the constructs extracted.
Finally, in the last step, the standardized scores of the extracted factors were used to discriminate the two clusters previously determined for logistics complexity, using stepwise binary logistics regression. Interactions between supply chain management decisions and objectives were also tested in order
to further explore these relationships. Results are presented and discussed next.
5. Development and discussion
5.1.
Logistics complexity and cluster
analysis
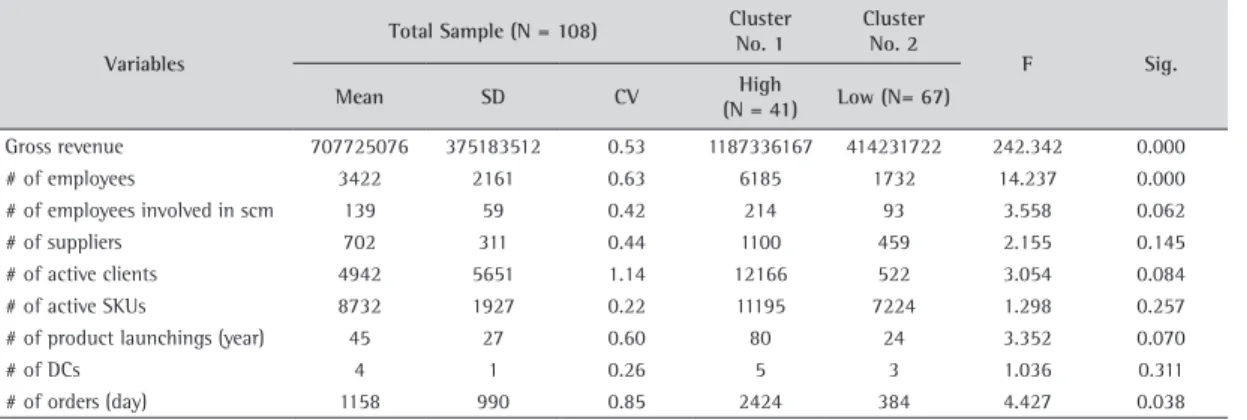
The variables considered during the cluster analysis are listed in Table 3, which also presents the final cluster centers and the F tests for differences between clusters.
According to Table 3 results, companies located in Cluster No. 1 not only have greater revenue, but also a greater number of employees, suppliers, SKUs, product launchings, distribution centers, and orders received, thus characterizing high logistics complexity. The reverse is true for Cluster No. 2, where companies have low logistics complexity. Although only Number of suppliers, Number of active SKUs, and Number of distribution centers cannot be considered significant at .10 level - acceptable within exploratory research in logistics (WANKE; ZINN, 2004) – F tests conducted should be considered only for descriptive purposes, as clusters have been chosen so as to maximize the differences among cases in each cluster (HAIR; ANDERSON; TATHAM, 1998). Additionally, there seems to be evidence in the literature that operational complexity and size are related as previously discussed (MASTERS et al., 1992; ANDERSON; KATZ, 1998; GERMAIN; DROGE, 1995).
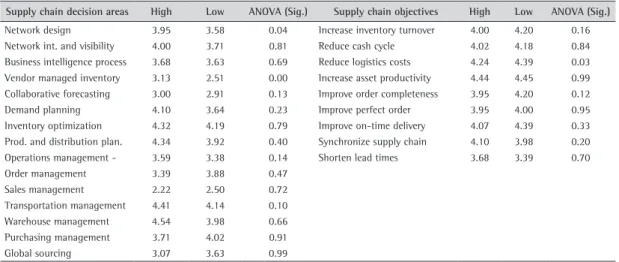
The means of each of the researched variables are presented for each cluster in Table 4. Significances for one-way ANOVA tests between both clusters are also provided. With respect to the variables related to the decision areas, Network Design and VMI presented significant differences at 0.05 between both clusters. On the other hand, reduce logistics
Table 3. Sample demographics and final cluster centers.
Variables
Total Sample (N = 108) Cluster No. 1
Cluster No. 2
F Sig.
Mean SD CV High
(N = 41) Low (N= 67)
Gross revenue 707725076 375183512 0.53 1187336167 414231722 242.342 0.000
# of employees 3422 2161 0.63 6185 1732 14.237 0.000
# of employees involved in scm 139 59 0.42 214 93 3.558 0.062
# of suppliers 702 311 0.44 1100 459 2.155 0.145
# of active clients 4942 5651 1.14 12166 522 3.054 0.084
# of active SKUs 8732 1927 0.22 11195 7224 1.298 0.257
# of product launchings (year) 45 27 0.60 80 24 3.352 0.070
# of DCs 4 1 0.26 5 3 1.036 0.311
costs was found to be significantly different at 0.05 when objectives were considered. The next step is to analyze, in-depth, whether the managers of the two clusters differ in their perception of criticality, considering simultaneously all the different aspects of the supply chain management objectives and decision areas.
The analysis of alternative k-means partitions (k = 2, 3, 4, 5, and 6) with respect to cluster connectivity that is, to what extent observations are placed in the same cluster as their nearest neighbors in the data space (HANDL; KNOWLES; KELL, 2005), indicates that two clusters outperform every other partition scheme with three or more clusters, achieving the lowest connectivity value, according to Figure 2. Similarly conclusions are found when the Average Proportion of Non-overlap (APN) is taken into account. This measure relates to the average proportion of observations not placed in the same cluster by first
clustering based on the full data and then clustering based on the data with a single column removed (DATTA; DATTA, 2003; YEUNG; HAYNOR; RUZZO, 2001). The APN ranges between the interval [0, 1], with values close to zero corresponding with highly consistent clustering results. This was found for two clusters (APN close to zero according to Figure 2). Cluster connectedness and average proportion of observations constitute internal and stability validity measures, respectively.Results for other partitioning schemes are also illustrated in Figure 2.
5.2.
Supply chain decision areas factor
analysis
Results of the EFA conducted on the variables related to supply chain management decision areas are presented in Table 5. We found four main factors that represent supply chain management
Figure 2. Cluster validation measures.
Table 4. Cluster means for each level (low or high) of logistics complexity.
Supply chain decision areas High Low ANOVA (Sig.) Supply chain objectives High Low ANOVA (Sig.)
Network design 3.95 3.58 0.04 Increase inventory turnover 4.00 4.20 0.16 Network int. and visibility 4.00 3.71 0.81 Reduce cash cycle 4.02 4.18 0.84 Business intelligence process 3.68 3.63 0.69 Reduce logistics costs 4.24 4.39 0.03 Vendor managed inventory 3.13 2.51 0.00 Increase asset productivity 4.44 4.45 0.99 Collaborative forecasting 3.00 2.91 0.13 Improve order completeness 3.95 4.20 0.12 Demand planning 4.10 3.64 0.23 Improve perfect order 3.95 4.00 0.95 Inventory optimization 4.32 4.19 0.79 Improve on-time delivery 4.07 4.39 0.33 Prod. and distribution plan. 4.34 3.92 0.40 Synchronize supply chain 4.10 3.98 0.20 Operations management - 3.59 3.38 0.14 Shorten lead times 3.68 3.39 0.70
Order management 3.39 3.88 0.47
Sales management 2.22 2.50 0.72
Transportation management 4.41 4.14 0.10 Warehouse management 4.54 3.98 0.66 Purchasing management 3.71 4.02 0.91
decision areas, as presented in Table 6 heading: Factor 1 - Network design and integration management; Factor 2 - Logistics operations management; Factor 3 - Demand management; and Factor 4 - Sourcing management. The overall Chronbach’s reliability coefficient alpha is 0.78 and the KMO is 0.750 (Chi-square = 642.927; Sig. = 0.000). It is worth mentioning that the tests performed with a larger number of factors (5, 6, and 7) did not produce substantial improvements in the percentage of variance explained - which remained below 60% - while eigenvalues of the extra-factors dropped below 0.8; 1.0 is the acceptable level.
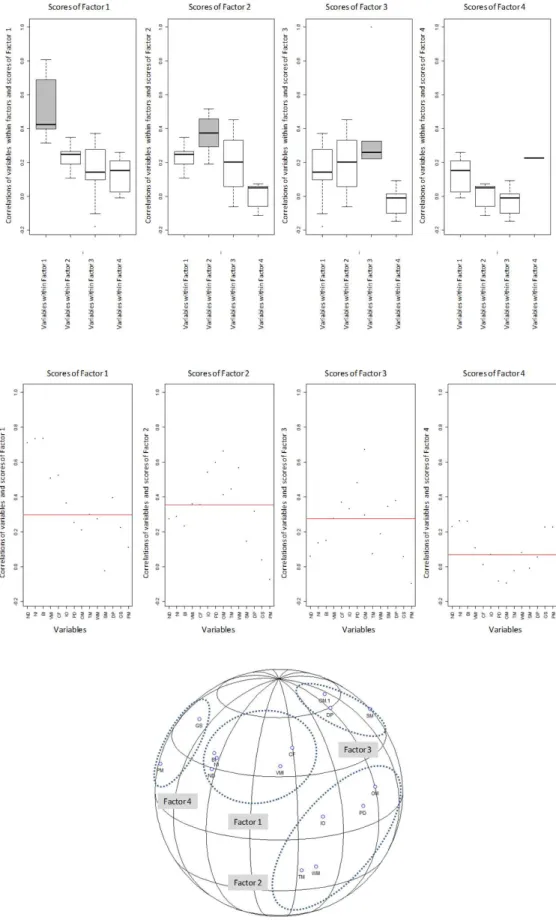
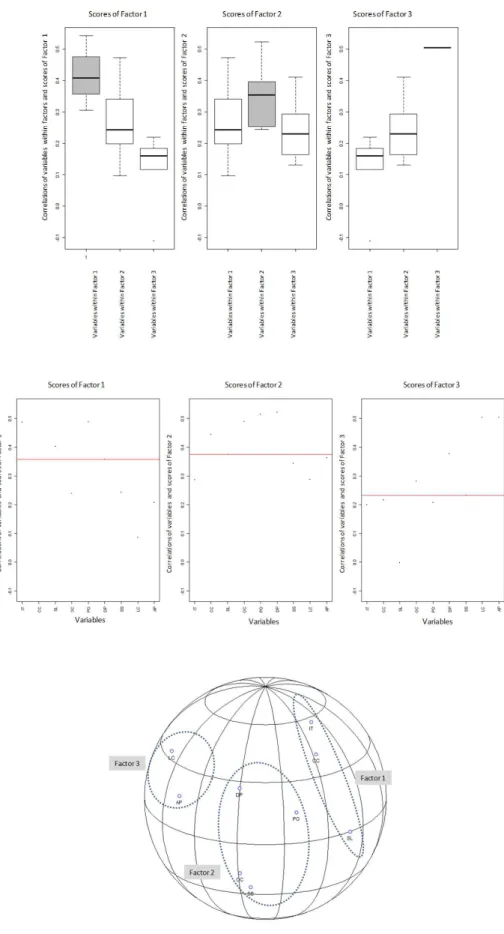
Although the CFA presented a significant adjusted goodness-of-fit index (0.81, in a scale ranging from zero to one), both variables related to Factor 4, Global Sourcing and Purchasing Management, were not
found to be significant at 0.05 after resampling. On the other hand, in Figure 3, several graphs derivedfrom the MMTM approach are presented in order to illustrate the convergent and the discriminant validity of the four factors previously extracted: (i) on the top, in grayscale, the boxplots of the distributions of the Pearson’s correlations between the score of each one of the four factors and the variables thatare containedwithin each respective factor; (ii) on the bottom, a graphical 3D representation of the correlation matrix similarly to Principal Component Analysis (PCA), illustrating how the different variables converge/diverge to a given factor within this spatial representation; and (iii) on the middle, the Pearson’s correlations between the score of each one of the four factors and all variables. On the graph at the top of Figure 3, readers should note that the distribution
Table 5. Results of factor extraction for supply chain management decision areas and practicesa.
Factors Variables Factor Loads Coefficients % of Variance Explained
Cronbach´s
alpha Communalities
Factor 1 – Network
design and integration management
Network design (ND) 0.83 0.27
26.93% 0.841
0.74
Network integration and visibility (NI) 0.86 0.28 0.80
Business intelligence (BI) 0.86 0.30 0.77
Vendor managed inventory (VMI) 0.55 0.16 0.49
Collaborative forecasting (CF) 0.60 0.21 0.60
Factor 2 – Logistics
operations management
Inventory optimization (IO) 0.65 0.26
13.39% 0.743
0.58
Production and distribution planning (PD) 0.70 0.25 0.66
Operations management - postponement
(OM) 0.53 0.17 0.49
Transportation management (TM) 0.67 0.29 0.71
Warehousing management (WM) 0.75 0.34 0.66
Factor 3 – Demand management
Order management (OM.1) 0.52 0.26
8.34% 0.512
0.47
Sales management (SM) 0.82 0.42 0.72
Demand planning (DP) 0.56 0.25 0.65
Factor 4 – Sourcing management
Global sourcing (GS) 0.50 0.27
7.18% N/A
0.47
Purchasing management (PM) 0.68 0.48 0.58
a N/A – non-applicable due only two variables.
Table 6. Results of factor extraction for the supply chain management objectivesa.
Factors Variables Factor
Loads Coefficients
% of Variance Explained
Cronbach´s
alpha Communalities
Factor 1 – Supply chain agility and
responsiveness
Increase inventory turnover (IT) 0.78 0.38
33.19% 0.551
0.72
Reduce cash cycle (CC) 0.78 0.33 0.69
Shorten lead times (SL) 0.66 0.29 0.70
Factor 2 – Supply chain reliability
Improve order completeness performance (OC) 0.72 0.36
13.85% 0.667
0.72
Improve perfect order performance (PO) 0.53 0.20 0.70
Improve on-time delivery performance (DP) 0.54 0.19 0.72
Synchronize supply chain (SS) 0.54 0.25 0.75
Factor 3 – Supply chain cost
Reduce logistics costs (LC) 0.88 0.56
11.71% NA 0.84
Increase asset productivity (AP) 0.75 0.46 0.85
of correlations between a given factor score and the variables that form this specific factor is higher (grayscale) than the correlations of this factor with variables that pertain to other factors. There are four boxplots for each factor score, as each factor score is tested against a group of variables - whether contained or not in a given specific factor.
5.3.
Supply chain objectives factor analysis
Similarly, results of the exploratory factor analysis conducted on the variables related to supply chain management objectives are presented in Table 6. Three main factors are adequate to represent the objectives of supply chain management, given as follows: Factor 1 - Supply chain agility and responsiveness; Factor 2 - Supply chain cost; and Factor 3 - Supply chain reliability. The overall Chronbach’s reliability coefficient alpha is 0.76 and the KMO is 0.755 (Chi-square = 300.79; Sig. = 0.000). Tests were also performed with a larger number of factors (4, 5, and 6) and they did not produce substantial improvements in the percentage of variance explained - which remained below 62% - while eigenvalues of the extra-factors dropped below 0.8-1.0 is the acceptable level.
Again, although the CFA presented a significant adjusted goodness-of-fit index (0.90), both variables related to Factor 3, Reduce Logistics Costs and Increase Asset Productivity, were not found to be significant at 0.05 after resampling. Similarly as in Figure 3, in Figure 4, several graphs derived from the MMTM approach are presented in order to illustrate the convergent and the discriminant validity of the three factors previously extracted.
5.4.
Logistics complexity, supply chain
decision areas and objectives
Although the standardized scores of the seven factors – four related to decision areas and three related to objectives - were used to discriminate between the two clusters previously determined for logistics complexity. A stepwise binary logistic regression analysis was performed using SPSS 15.0 to assess the accurate prediction of membership in one of two categories of outcome (high logistics complexity and low logistics complexity), on the basis of the seven factors. There was a good model fit (discrimination between companies with high/low logistics complexity) and the comparison of log-likelihood ratios for models with and without these seven factors showed reliable improvement(Intercept only = 59.339; Final = 54.205; Chi-Square = 5.134; Sig. = 0.023). Table 7 presents the results of the binary logistic regression. The
positive sign of the predictor variable indicates that the greater the factor, the more complex tends to be the company’s logistics. P-values below 0.10 were considered as the significance cut-off points.
Results show that only one of the seven factors is significant: Network design and integration management. This factor has a positive sign. It means that the supply chain management decision areas represented by this factor are more likely to be found in companies with higher logistics complexity - the higher this factor, the more likely it is that the company will belong to the cluster of high logistics complexity. The remaining factors for decision areas and objectives do not present significant differences between clusters.
To go one step further from previous efforts reported in literature, secondary interaction effects between supply chain management decision areas and objectives are also analyzed via stepwise binary logistics regression, in order to assess accurate prediction of membership in one of the two logistics complexity clusters.
Regression analysis may have two different goals: to predict the dependent variable by using a set of independent variables; and to quantify, simultaneously, the relationship of one or more independent variables to a dependent variable (KLEINBAUM et al., 1998). The first of these goals was accomplished by means of the analyses presented in Table 7. The second goal is of particular interest when the relationship under study is assumed to be significantly different at different levels of the independent variables. It is accomplished by incorporating secondary effects into the analysis.
Although most of the statistical textbook literature focuses on interactions between categorical and continuous variables (KLEINBAUM et al., 1998), there can also be interactions between two continuous variables, as described by Jaccard, Turrisi and Wan (1990) and Aiken and West (1991). However, as Jaccard, Turrisi and Wan (1990) and Aiken and West (1991) note, there are a number of difficulties in interpreting such interactions. This being the underlying cause, both authors note with regret that such interaction terms are not used more widely in the social sciences. A few highlights from their discussions may be helpful in providing some guidance on the discussion of results that follows:
• In general, models with interaction effects should
original variables can result in important changes in the apparent effects of the interaction terms;
• In models with multiplicative terms, the regression
coefficients for the independent variables reflect conditional relationships of a given explanatory variable on the dependent variable when the other explanatory variable in the interaction is assumed, say, to be equal to zero;
• Effects can therefore often be made more
interpretable by centering variables first. This is the case in EFA, where factor scores are centered around the mean(zero) after standardization. In such cases hen variables are centered, the regression coefficient for the independent variable is the effect on the dependent variable for a company who is “average” with respect to the other explanatory variable in the interaction.
So, Table 8 presents the results of the stepwise binary logistic regression. There was also a good model fit, and the comparison of log-likelihood ratios for models with and without these factors showed reliable improvement (Intercept only = 59.339; Final = 38.794; Chi-Square = 20.544; Sig. = 0.005). When comparing the models presented in Tables 7 and 8, results indicate that the null hypothesis of both models being equal should be rejected in favour of the model presented in Table 8 (Chi-Square = 15.410, df = 6, Sig. = 0.0173).
A positive sign on the predictor variables indicate that, the greater the factor, the more complex the company’s logistics tend to be. On the other hand, negative signs indicate that the greater the factor, the smaller the complexity. Cluster # 2 (low complexity) is the reference category, upon which probabilities of belonging to a given cluster are calculated.
The objectives related to Supply chain reliability and the decision areas related to Logistics operations management and to Sourcing management constitute a common ground perceived as critical by companies located in both clusters, since they do not present significant differences between companies with high and low logistics complexity.
However, when secondary effects are taken into consideration, the objectives related to Supply chain cost (reduction) turn out to be significant, thus indicating that they are more typical of companies characterized by lower logistics complexity. An in-depth analysis performed on the secondary effects reveals the circumstances regarding this change. The interaction given by the simultaneous effects of the objectives related to Supply chain cost (reduction) and the decision areas related to Sourcing management has a negative sign. Briefly, secondary effects in this case mean that reducing supply chain costs by means of Sourcing management is more likely to be found within companies with lower logistics complexity. If we consider that Sourcing management (Purchasing and Global sourcing) has traditionally been used to reduce material costs – see, for instance, Monczka,Trent and Handfield (1998) and Handfield and Nichols (1999) -, it should be no surprise that lower logistics complexity companies tend to emphasize reducing costs within these two areas since opportunities in logistics operations may be less evident due to a small number of SKUs, distribution centers, clients, suppliers, etc. For instance, a highly automated operation producing few products like high volume washing powder would have few opportunities to reduce costs at the manufacturing facility. In this case, it would focus their cost reduction efforts more on the supply side.
Table 7. Stepwise binary logistic regression: supply chain management decision areas and practicesa.
Factor B Wald Sig.
Network design and integration management .971 3.880 .049
Constant –2.55 30.420 .000
a Criterion variable: High logistics complexity vs. Low logistics complexity. Nagelkerke’s R-Square = .114
Table 8. Stepwise binary logistic regression results: accounting for secondary effectsa.
Factor B Wald Sig.
Network design and integration management 1.72 5.35 0.02
Supply chain reliability –0.15 0.09 0.76
Logistics operations management –0.10 0.03 0.86
Supply chain reliability *Logistics operations management –0.96 4.69 0.03
Supply chain cost –1.14 5.81 0.02
Sourcing management –0.26 0.36 0.55
Supply chain cost *Sourcing management –1.47 6.24 0.01
Constant –3.86 18.13 0.00
Another secondary effect that deserves attention is the one given by the simultaneous effects of the objectives related to achieving Supply chain reliability and the decision areas related to Logistics operations management. It also has a negative sign, thus indicating that companies with lower logistics complexity focus their objectives on improving reliability at different stages of the logistics operation. We consider this effect to be driven chiefly by the difficulties inherent in a smaller size (with corresponding lower economies of scale). In the literature review section we discussed that to a certain extent size tends to be correlated to complexity. Smaller (or lower logistics complexity companies) may face financial and/or human resource constraints for buying and implementing information technologies that help in planning and controlling the inbounds and outbounds at different stages of the logistics operations.
In summary, Table 9 offers a possible way to emphasize different aspects of supply chain management – objectives and decision areas – with respect to logistics complexity. It could be helpful not only to establish a differentiation between companies, but also for companies with large product portfolios operating in more intricate environments.
6. Conclusions and implications
This study contributes to existing contingency research in operations management by unveiling the existence of significant relationships between the level of logistic complexity and supply chain management decision areas and objectives. Sousa and Voss (2008, p. 711) suggest that “contingency research is important both for the development of the operations management field and for practitioners”. From a scientific perspective,“operations management should provide theories that are useful across a spectrum of contexts” (SOUSA; VOSS, 2008, p. 711). Sousa and Voss (2008) also suggest that research in operations management practices should start to shift from the justification of the value of such practices to the understanding of the contextual conditions under which they are effective. In line with this notion, our research found empirical evidence to support a contingency approach for supply chain
management, which is currently one of the most visible and rapidly developing areas of operations management. The more it becomes clear that different contexts require different approaches as to decision areas and objectives to pursue, the more research can be directed towards providing theories that are better suited to each context. This is one of the contributions of our findings to theory.
In terms of practical implications, the findings of this research provide evidence that decisions and choices in supply chain management should be aligned to contextual conditions instead of being exclusively based on “best practices” that would be principles of general applicability. Also, the contingency relationships found between logistics complexity and practices provide some guidance to managers in terms of what contextual variables to look at when making decisions and choices regarding supply chain practices. Said guidance may bring a new perspective for “best practices” or general principles that should be observed by managers. Under this new perspective, logistics complexity may become one underlying contingency factor to assess the suitability of a given (“best”) practice.
Our analysis indicates that a company’s level of logistics complexity is a driver of at least some of the choices in supply chain decision areas and objectives, confirming our initial proposition that managers actually tend to prefer choices that are context-related; network design and integration management are considered more critical to achieving supply chain excellence by managers of manufacturing companies with higher levels of logistics complexity, whereas sourcing management decision areas together with cost reduction are considered more critical for companies with lower levels of logistics complexity. So, companies with more numerous and varied interacting logistics elements consider decision areas related to matching supply and demand as more critical, whereas companies with simpler logistics tend to consider sourcing as more critical. This may be because with simpler logistics matching supply and demand is also simpler and more easily achievable (not a differentiating factor); therefore, the best opportunities for improving supply chain performance lay outside, in the supply side. This would lead executives of companies with lower
Table 9. Impact of logistics complexity on supply chain management.
Supply chain decision areas
Network design and integration management
Logistics operations
management Demand management Sourcing management
Supply chain objectives
Agility and responsiveness High Complexity (Decisions) High and Low complexity (Objectives)
Reliability Low complexity Both
logistics complexity to place greater emphasis on the decision areas that are related to gaining efficiencies via sourcing initiatives.
If our results can be generalized, companies with more complex logistics would consider network intelligence and integration as critical decision areas because its constituents (VMI, BI, CPFR, CF) are related to integration between supply chain members. On the other hand, companies with less complex logistics should pursue practices that emphasize more sourcing (e.g., pursuing excellence in global strategic sourcing, offshoring, and purchasing decisions). According to our results, decision areas related to demand management did not appear to be contingent upon logistics complexity. We did not expect that they would, since the emphasis on managing demand and the customer seems to be ubiquitous among managers nowadays, especially given the intense and increased competitive pressure their companies face.
An issue that deserves further research is the fact that we found a significant interaction between companies with lower logistics complexity and the objective of reliability. Here, one hypothesis would be that companies with lower levels of logistics complexity may be dealing with fewer product launches, fewer SKUs, and possibly more demand predictability. If this is the case, then service responsiveness may possibly become less critical and reliability more critical. For instance, for a company producing motor oil with a predictable demand and low level of logistics complexity, the ability to be responsive would be less critical because market frequent/drastic changes are not the rule. In these markets, it is usual that companies work with scheduled deliveries. Responsiveness would not be critical in this situation, but delivery reliability would.
As for the limitations of our findings, we did not investigate the actual supply chain decision-making process of the surveyed companies but only the perceptions of their managers regarding the criticality of supply chain objectives and decisions. Thus, there may be dissonance between what managers consider as critical and their actual decision-making processes. Further research should also be conducted to explore the impact of uncertainty altogether with complexity on supply chain management decision areas and objectives, unveiling their possible interactions.
Another limitation of the research is that although we tested our sample for non-response bias it should be noted that the sampling process was not random; therefore the results are exploratory, limited and not directly generalizable beyond the 108 companies of the analyzed sample.
We also did not explicitly investigate the performance of these companies in light of the practices adopted. Instead, we dealt with this issue by implicitly assuming that these practices would lead to supply chain excellence, based on the interviewees’ best judgment. Furthermore, since our sample consists of manufacturing companies only, we would not assume or even hypothesize that our results would hold true for service companies, given the substantial differences between the contexts and conditions in which they operate. More research would be needed here if we were to try to generalize our results in that way.
Another limitation is that our sample contains only companies operating in Brazil. We would, however, hypothesize that our findings should also hold true for large manufacturing companies not based in Brazil, but this also merits further research.
References
AFFONSO, R.; MARCOTTE, F.; GRABOT, B. Sales and operations planning: the supply chain pillar. Production Planning & Control, v. 19, n. 2, p. 132-141, 2008. http://
dx.doi.org/10.1080/09537280801896144
AIKEN, L. S.; WEST, S. G. Multiple regression: Testing and interpreting interactions. London: Newbury Park Sage, 1991.
ANDERSON, M. G.; KATZ, P. B. Strategic sourcing. International Journal of Logistics Management, v. 9, n. 1, p. 1-13, 1998. http://dx.doi.org/10.1108/09574099810805708 BAKER, P. The design and operation of distribution centres
within agile supply chains. International Journal of Production Economics, v. 111, n. 1, p. 27-41, 2008. http://dx.doi.org/10.1016/j.ijpe.2006.09.019
BALLOU, R. Unresolved issues in supply chain network design. Information Systems Frontiers, v. 3, n. 4, p. 417-426, 2001. http://dx.doi.org/10.1023/A:1012872704057 BARRATT, M.; OKE, A. Antecedents of supply chain visibility
in retail supply chains: a resource-based theory perspective. Journal of Operations Management, v. 25, n. 6, p. 1217-1233, 2007. http://dx.doi.org/10.1016/j. jom.2007.01.003
BARTLETT, P. A.; JULIEN, D. M.; BAINES, T. S. Improving supply chain performance through improved visibility. International Journal of Logistics Management, v. 18, n. 2, p. 294-313, 2007. http://dx.doi. org/10.1108/09574090710816986
BHARADWAJ, N.; MATSUNO, K. Investigating antecedents and outcomes of customer firm transaction cost savings in supply chain relationship. Journal of Business Research, v. 59, n. 1, p. 62-72, 2006. http://dx.doi.org/10.1016/j. jbusres.2005.03.007
BLACKBURN, J. D. et al. Reverse Supply Chains for Commercial Returns. California Management Review, v. 46, n. 2, p. 6-22, 2004. http://dx.doi.org/10.2307/41166207 BLANKLEY, A. A conceptual model for evaluating the