A New Approach in Copolymerization: Monte Carlo
Method for the Reactivity Ratios Calculation
in Copolymerization of Furfuryl Acrylate
with 2-Hydroxyethyl Methacrylate.
D. Zaldívar, G. Fuentes, D. Monett, C. Peniche, R. W. Arcís, A. Soto and J. San Román
Abstract::::: Copolymers of furfuryl acrylate (A) with 2-hydroxyethyl methacrylate (H) were prepared by free radical copolymerization in DMF solution at 50°C, using 2,2'-azobisisobutyronitrile (AIBN) as initiator. The reactivity ratios of both monomers were calculated according to the general copolymerization equation using the Fineman-Röss and Kelen-Tüdos 1inearization methods, as well as the Tidwell-Mortimer non linear least-squares treatment and the Monte Carlo random method. The reactivity ratios obtained were rA = 0.93 and rH = 1.42. Similar results were obtained by both, the Monte Carlo and the non-linear least squares methods. The microstructure of copolymer chains based on the first order Markov statistics is described.
Keywords::::: Reactivity ratios, copolymerization microstructure, furfuryl acrylate, 2-hydroxyethyl methacrylate,
Introduction
The classical copolymerization model describes the relative change in monomer concentrations (d[M1]/d[M2] as a junction of the instantaneous
monomer concentrations [M1] and [M2], and the
monomer reactivity ratios r1 and r2 by means of the
general copolymerization equation:
[ ]
[ ]
[ ] [ ]
[ ] [ ] [ ]
2(
(
1 2[ ]
2)
)
2 1 1 1 2
1
M r M M
M M r M M
d M d
⋅ + ⋅
+ ⋅ ⋅ =
This equation can be also expressed as a function of the molar fractions in feed:
2 2 2 2 1 2 1 1
2 1 2 1 1 1
2 f f r f
f r
f f f r F
⋅ + ⋅ ⋅ + ⋅
⋅ + ⋅
(1)
where F1 is the M1 molar fraction in the copolymer
composition.
The reactivity ratios are not just parameters suited for the estimation of relative reactivities of monomers, but can also provide valuable and precise information for the determination of microstructural parameters such as the distribution of units and sequence lengths along the macromolecular chains[1]. Therefore, the
calculation procedures employed for the determination of r1 and r2 must be adjusted as
D. Zaldívar, G. Fuentes, D. Monett, C. Peniche, R. W. Arcís, A. Soto, Biomaterials Center (BIOMAT), University of Havana P.O. Box 6323, CP 10600, Havana, Cuba; J. San Román, Institute of Polymers Science and Technology, CSIC, Juan de la Cierva St. # 3, 28006, Madrid, Spain
A
R
T
I
G
O
T
É
C
N
I
C
O
C
I
E
N
T
Í
F
quantitatively as possible to the experimental behavior of the copolymerization system.
The different methods proposed for calculating the reactivity ratios can be classified as: ap-proximation[2], curve fitting[3], intersection[4],
linearization[5-7] and non-linear least squares
methods[8,9]. It has been pointed out by Tidwell and
Mortimer that the first four methods are not entirely satisfactory, since they all rely on a subjective weighting of data in the evaluation of the reactivity ratios. Also they do not provide possible means of establishing the quantitative error limits for the computed values. On the other side, the non-linear least squares method derived by Tidwell and Mortimer gives better pair of values of reactivity ratios in comparison with the linear ones, independently of any subjective judgement of the experimental data and allows to quantify the errors in meaningful terms. However, the majority of researchers report the reactivity ratios using one of the methods derived from the composition equation, possibly due to the mathematical complexity of the non-linear least squares method.
A recent work related with these topics is the study of the kinetic behavior of the systems 2-hydroxyethyl methacrylate with methacrylic monomers such as N-(4-metacryloyloxyphenyl)-2(4-methoxyphenyl) acetamide and N-[4(4-methoxyphenylacetyloxy)phenyl] methacrylamide where the microstructure of the copolymer chains was determined statistically from the reactivity ratios, considering the terminal model for both copolymerization processes[10]. Besides, acrylfuranics
monomers as furfuryl methacrylate and tetrahy-drofurfuryl methacrylate were copolymerized with hydrofilic monomers like N-vinyl-2-pyrrolidone and 2-hydroxyethyl methacrylate and were obtained copolymeric hydrogels with potential applications in medicine[11].
Other methods to find the optimum values for the reactivity ratios are considered using evolutionary techniques[12-14] (genetic algorithms) to evolve
solutions to difficult problems, such as function optimization. These methods are search procedures based on the mechanics of natural selection and na-tural genetics.
In the present paper a new procedure for the calculation of r1 (rA) and r2 (rH) based on random techniques for parameter estimation[15] is presented
and applied to know the fitness of the reactivity ratios for the furfuryl acrylate(A)/2-hydroxyethyl
methacrylate(H) copolymerization system. The results are compared with the classical linear and non-linear squared methods, and the values of reactivity ratios obtained are used to calculate the mi-crostructural parameters of the copolymers.
Methods
Monomer preparation and purification of materials
Furfuryl acrylate was prepared by transes-terification of methyl acrylate with furfuryl alcohol in presence of sodium carbonate as catalyst and ionol as inhibitor. The product was distilled under reduced pressure at 5 mmHg, dissolved in chloroform and passed through a chromatographic column containing Silica Gel 60 (Macherey-Nagel, Germany). The eluent was analyzed by thin layer chromatography using Kieselgel 60 F 254 (Merck, Germany) as the stationary phase. The selected fraction was rotoevaporated in order to separate the solvent and distilled.
2-Hydroxyethyl methacrylate, supplied by Hydron Europe Ltd, containing less than 0.05 wt % of ethylene glycol dimethacrylate, was distilled under reduced pressure of nitrogen and the fraction of bp 87-89°C/5 mmHg was collected.
2,2'-Azobisisobutyronitrile (AIBN) was purified by fractional crystallization from methanol, mp = 104°C. N,N-Dimethylformamide (DMF) was dried over anhydrous magnesium sulfate for 2 days and later with phosphoric anhydride overnight. After drying, DMF was distilled under reduced pressure of nitrogen.
Other reagents were of extra-pure grade and used as purchased.
Polymer characterization
The copolymers obtained from different mixtures of A and H were analyzed by 1H-NMR spectroscopy
aromatic furfuryl ring and 3.65 and 3.95 δ assigned to the oxyethylene protons of the -CH2-CH2-OH side residue of 2 hydroxyethyl methacrylate units[16].
Copolymerization
Copolymerization reactions were performed in DMF solution at 50± 0.1°C, in Pyrex glass ampoules sealed off under high vacuum. Monomer and initiator concentrations were 1.0 mol/L and 1.5.10-2 mol/L,
respectively. The sealed ampoules were shaken vigorously and immersed in a water bath held at the required temperature of polymerization. After the proper reaction time, the ampoules were removed from the bath and at once the content was poured into a large excess of diethyl ether. The precipitated samples were washed with the precipitant mixture and dried under vacuum until constant weight was attained.
Monte Carlo method
The knowledge about the real value of the reactivity ratios was very scarce. For the identification of these constants a parameter estimation method of exploratory type (Monte Carlo method) was selected. Monte Carlo method carries out a random search in the whole domain D,
H A H
AI I xI
X D= θ =
= θ
where Iθ = [Lθ, Uθ] is the interval of variation corresponding to the reactivity ratio θ, and Lθ and Uθ are the inferior and superior limits of Iθ respectively The D domain is a cartesian product of intervals, definite as the widest region where the reactivity ratios vary. Therefore, a pair (rA , rH) belongs to D. Then, rA
∈ rA = [LA , UA] and rH∈ IH = [LH , UH].
For this purpose as many combinations as desired of probable values for the unknown reactivity ratios are generated, each one within their corresponding interval. The greater the number of value combinations (C), the better the covering of the interval for the solution searching. The generation of combinations of reactivity ratios or tuples
ω1 =
( )
, , ∈ , ∈ ,=1,CH t H A t A t H t
A r r I r I
r , is at random
with each constant rθt uniformly distributed in Iθ. Each
combination ω is evaluated using the general equation of copolymerization (I). The solutions t
i
Sθ i=1,N, are
obtained where N is the number of experimental values.
Among the generated tuples a selection is made based on the distance dω between the experimental values of the general equation of polymerization and the solution t
Sω calculated for each generated tuple:
(
)
<ε= ω
ω distance f St
d exp, (2)
where ƒexp are the experimental values of the monomer in copolymer with respect to time and ε is a fixed positive number. The selected tuples will be the ones giving the best fit to the expected kinetical behavior. Different norms (L1, L2 and L∞) in the calculus of the above distance were used. The L2 norm or well known Euclidean distance,
( )
(
t)
i N
i t
S f d
i ω
=
ω=
∑
exp −1
was selected for the results shown in this article. The selected tuples yield an optimal domain Dopt
⊂ D, opt
H
A opt X I
D θ
= θ
= where:
i) Iθopt=
[
minθ( )
ω,maxθ( )
ω]
ii) minθ
( )
ω defines the minimum value for θ under 2, iii) maxθ( )
ω defines the maximum value for θ under 2. which defines the region where the best reactivity ratios combinations are contained. Dopt gives a good region of starting points for some other optimization methods like Levenberg-Marquardt, Gauss-Newton and Sequential Quadratic Programming.With the purpose of determine the most reliable intervals for the parameters, Monte Carlo method was applied several times starting with different initial random seeds and maintaining the original intervals. From each run and optimal domain Dopt, the behavior
of the results in the different intervals Iθ were analyzed. Each of these intervals was divided into three disjoint subintervals: Iθ =Iθ1∪Iθ2∪Iθ3 where
2
θ
I is defined by the set of values of θ from the
selected tuples, Iθ1 and Iθ3 contains none
and Iθ =
[
Lθ ,Uθ]
,Lθ1 =Lθ,Uθ1 =Lθ2,Uθ2 =Lθ3k k
k and
θ θ =U
U
different runs (M, number of runs) and three new ge-neral intervals were defined:
∑
= θ
θ θ = θ = θ
M m Z Z m U M U and L L where Z 1 1 1 1 1 1
∑
=θ θ = θ θ = θ
M m Z Z Z m U M U and U L where Z 1 2 2 2 2 2 1 θ θ whereL θ =U θ andU θ =U
Z 3 Z3 Z2 Z3
At the same time statistical analyses of the behavior of the upper and lower limits of each interval were made. The analyses show that these limits remain almost without changes in the different runs. Afterwards, the general intervals were used successively as the original interval Iθ . For example, using Zθ3 as Iθ none of the tuples could be seleted
because all of them failed the ε condition (2). On the other hand using Zθ2 as Iθ and repeating several
ti-mes the whole process, (that is, obtaining a new interval, say Zθ2*, and using it again as Iθ, and so on)
a progressive refinement of the initial Iθ interval was obtained.
Results and Discussion
The copolymerization of furfuryl acrylate with 2-hydroxyethyl methacrylate in anhydrous DMF solutions were studied in a wide composition interval with molar fractions of A ranging from 0.15 to 0.85 in the monomer feed. The reaction time was initially regulated to reach conversions lower than 5 wt %, in order to satisfy the differential copolymerization equation[3,17,18]. The molar fraction of monomers units
incorporated in the copolymers were determined from the 1H-NMR spectra of copolymers samples prepared
with different monomer feeds.
The data of molar composition of the initial mixtures of comonomers used and the resulting copolymers are quoted in Table 1. The reactivity ratios of the monomers were determined according to the general copolymer composition equation by the application of the Tidwell and Mortimer non linear least squares analysis[9].
To this end, initial approximated values of rA and
rH were obtained by means of the Fineman-Röss[5]
(Equation 3) and Kelen-Tüdos[6] (Equation 4)
linearization methods:
(
)
(
)
(
(
)
)
H A A A A A A A A r f F F f r f F F f + − − = − − 2 2 1 1 1 2 1 (3)where F refers to monomer composition in copolymer and ƒ refers to monomer composition in feed both cases according to the principal monomer;
α − + α α + = +
α A H H
r E E r r E G (4)
where ( ) [ ][ ] [ ][ ]and Emax Emin
H d A d y , H A x , y x E , y y x
G= − = = = α= ⋅
2
1
The results are shown in Table 2. It must be pointed out that although the rA and rH values obtained
using the linearization methods are somewhat different, they give the same reactivity ratio values when feeded to the nonlinear least squares method.
We stress here that the reactivity ratios determined by the application of the analysis suggested by Tidwell and Mortimer[9] and our approach are the most
probable values for this system (with ε = 0.075 in the Equation 2). In this sense, the 95 % confidence limit gives an idea of experimental error and the correctness of the experimental conditions used to generate the
Table 1. Table 1. Table 1. Table 1.
Table 1. Composition and conditional probability data of the free radi-cal copolymerization of furfuryl acrylate (A) and 2-hydroxyethyl meth-acrylate (H) in DMF solution at 50°C (where fA and FA are the molar fraction of furfuryl acrylate in the monomer feed and in the copolymer samples, respectively).
Table 2. Table 2. Table 2. Table 2.
Table 2. Copolymerization parameters of the free radical copolymer-ization of furfuryl acrylate with 2- hydroxyethyl methacrylate (where FR refers to the Fineman-Röss linearization method, KT to the Kelen-Tüdos linearization method, TM to the Tidwell-Mortimer non linear squares method and MC refers to the Monte Carlo method).
d e e F
ƒ ( A)
r e m y l o p o C F ( A)
n o i s r e v n o C ) % t w
( PAH PHA
0 5 1 .
0 0.120 2.3 0.859 0.111 0
0 3 .
0 0.242 2.7 0.715 0.232 0
0 5 .
0 0.443 3.2 0.518 0.413 0
0 7 .
0 0.681 2.4 0.315 0.622 0
5 8 .
0 0.822 3.4 0.212 0.738
d o h t e
M rA rH rAxrH 1/rA 1/rH
R
F 0.82±0.4 1.25±0.15 1.025 1.22 0.80
T
K 0.88±0.19 1.35±0.08 1.188 1.14 0.74
M
T 0.93 1.42 1.321 1.07 0.71
C
composition data. When the experimental error is reasonably small and the data have been taken under the appropriate conditions, the approximation can be remarkably good. The application of this treatment to the copolymerization data is reported in Table 1 and the reactivity ratios quoted in Table 2 provides the 95 % confidence limits.
The average composition diagram shown in Fi-gure 1 has been drawn with the Monte Carlo rA and rH values using the Mayo-Lewis classical copol-ymerization equation[4] (see equation 5); the
experi-mental composition data fit almost adequately the theoretical diagram represented by the solid line,
(
)
(
)
(
A A)
A A A A AA A H
f F
F f r f F
F f r
− − + −
− =
1 1
1 1
2 2
(5)
The reactivity of growing radicals with A ends, as measured by the ratio 1/rA and the reactivity of the growing radical with H ends, as measured by the ratio 1/rH are rather similar towards both monomers and the product rA•rH is close to unity, indicating that the system behaves close to the ideal one.
From the values of the reactivity ratios rA and rH given in Table 2 and taking into account well known statistical relationships, we have determined the run number, R, defined by Hardwood and Ritchey[19] as
the average number of monomers alternations in a copolymer per 100 monomeric units. This parameter provides a useful picture of the sequence distribution
in a copolymer chain and can be used to estimate the variation of the physical properties of copolymers with the composition. Values of R have been determined in terms of reactivity ratios and probability statistics for different values of the molar fraction of A in the feed, covering a wide interval of compositions. The maximum value of R = 45.98 is reached for a A molar fraction in the feed of about 1.00 (see Figure 2).
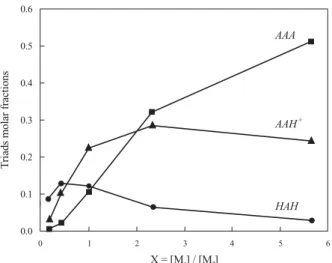
The statistical distribution of A centered triads were determined considering the equations for the first order Markovian transition probabilities PAH, PHA, PAA and PHH according to the following equation[20]:
X r P
P
A AA
AH = − = + ⋅
1 1 1
X / r P
P
A HH
HA
+ = − =
1 1 1
where X = [A]/[H], the ratio of the concentration of A and H in the monomer feed. Figure 3 shows the diagrams of the statistical distribution of A centered triads along the copolymer chains, as function of the ratio of molar concentration of both monomers in the feed. As expected the HAH triad molar fraction decreases smoothly whereas the molar fraction of homotriads AAA increases drastically, with increasing X. However, the molar fraction of heterotriads having one H unit, AAH+ = AAH + HAA, reaches a
maximum of 0.2828 for X = 2.33.
Figure 2. Figure 2. Figure 2. Figure 2.
Figure 2. Variation of Run Number, R, with the ratio of monomers con-centration, X, in the feed.
Figure 1. Figure 1.Figure 1. Figure 1.
Conclusions
The monomer reactivity ratios for the copolymerization of furfuryl acrylate with 2-hydroxyethyl methacrylate are rA = 0.93 and rH = l.42, respectively. This indicates the extremely higher reactivity of the growing radical with A ends towards furfuryl acrylate, which is reflected in the microstructure of the copolymer formed. The Monte Carlo method used for the evaluation of the reactivity ratios gives the same result as the non-linear least squares procedure of Tidwell and Mortimer and can therefore be used as an alternative.
Acknowledgments
The authors wish to acknowledge the financial support provided by the cooperation program between CSIC (Spain) and CECE (Cuba) as well as by the Grant Mat 88-0579-C02-01 from the CICYT.
References
1. Elias, H. G.- “Macromolecules”, Wiley Intersciences, New York (1977).
2. Alfrey, T.; Bohrer, J. J. and Mark, H.-“Copolymerization”, Wiley Intersciences, New York (1952).
3. San Román, J. and Madruga, E. L.- Revista de Plás-ticos Modernos, 344, 199 (1985).
4. Mayo, F. and Lewis, F.- J. Am. Chem. Soc., 66, 1594 (1944).
5. Fineman, M., and Röss, S. D.- J. Polym. Sci., 5, 259 (1950).
6. Kelen and Tüdos, F. - J. Macromol. Sci., Chem., A9, 1 (1975).
7. Yezrielev, A. J., Brokhina, E. L. and Roskin, Ye. S. J. Polym Sci., 1894 (1969).
8. Behnken, W., J. Polym. Sci., A2, 645 (1964).
9. Tidwell, P. W. and Mortimer, G. A., J Polym Sci., A3, 369 (1965).
10. Gallardo, A. and San Roman, J.- Polymer, 34, 567-73 (1993)
11. Zaldívar, D., PhD Thesis, Biomaterials Center, Ha-vana University (1997)
12. Monett, D. Luis, T.- 6th International Congress of New Informatic Technologies, INFORMATICA’98, Cuba (1998)
13. Monett, D.- I Artificial Intelligence Symposium, International Conference of Science and Technology for Development, CIMAF’97, Cuba (1997)
14. Monett, D. - Master in Computer Sciences Dissertation Faculty of Mathematics and Computer Sciences, Havana University, Cuba (1998)
15. Soto, A. and Monett, D. - QUIMINDUSTRIA’93, Cuba (1993).
16. Zaldívar, D.; Peniche, C.; Bulay, A. and San Roman, J.- J. Polym. Sci. Part A:31, 625-31 (1994)
17. Odian, G. - “Principles of polymerization”, 2nd edition Wiley Intersciences, New York (1981).
18. Galego, N.; Martínez, Peniche, R. C.; Prieto, S. and Rieumont, J.- “Quimica Fisica de los Polimeros”, Ed Cientifico-Técnica, Cuba (1987).
19. Hardwood, H. J. and Ritchey, W.M.- J. Polym Sci., 82, 601 (1964).
20. Monett, D.; Fuentes, G.; Arcis, W.; Zaldívar, D.; Lange, J. and Soto, A. - Revista de Plásticos Mo-dernos, 459, 231-7 (1994).
Recebido: 30/12/97 Aprovado:29/12/98
Figure 3. Figure 3. Figure 3. Figure 3.