ISSN 1553-345X
© 2008 Science Publications
Corresponding Author: Tanokkorn Banjonglaiad, Department of Chemical Engineering, King Mongkut’s University of Technology Thonburi, Bangkok, 10140, Thailand
Dynamic Measurement of Copper (II) Ion Adsorption in Activated
Carbon Fixed Bed Columns
1
Tanokkorn Banjonglaiad,
2Eric Croiset,
2Peter Silveston,
2Peter L. Douglas,
1
Supaporn Douglas,
1Wittaya Teppaitoon and
1Suwassa Pongamphai
1
Department of Chemical Engineering,
King Mongkut’s University of Technology Thonburi, Bangkok, 10140, Thailand
2
Department of Chemical Engineering,
University of Waterloo, Waterloo, Ontario, N2L 3G1, Canada
Abstract: Dynamic experiments were carried out on the adsorption of copper (II) ions in a laboratory packed bed of activated carbon. Both pulse and step change inputs were used. Measurements were reproducible and replicate measurements furnished nearly identical parameters for a heterogeneous model of the activated carbon bed assuming Langmuir adsorption isotherm. The initial concentration of copper (II) ion was 3 ppm and the average particle size of activated carbon was 1.5 mm. The adsorption experiments in the shallow beds of activated carbon, 3 and 5 cm bed height had little effect on the parameters. Hydraulic loading, 25 and 50 ml min−1, affected dispersion and the volumetric mass transfer coefficient, but unexpectedly also changed the effective diffusivity. This apparently comes from the incorporation of errors due to instrumental noise and model approximations in the parameters. A 5 min pulse input has a low residual sum of square (RSS) with all of set of starting point while a 10 min pulse has a low RSS using some set of starting point. A step up input has a high RSS that may arise from a large number of data. These affected the Langmuir adsorption isotherm constant and diffusivity as expected from their concentration dependency. Step change and pulse simulations using the model agreed well with the experiments.
Key words: Adsorption, Activated Carbon, Fixed Bed, breakthrough, modelling
INTRODUCTION
Activated carbon has been considered for the capture and eventual recovery of metal ions in aqueous industrial discharges for many years and indeed has enjoyed some commercial application. Metals plating and fabrication industries stand to benefit from a fast and robust method of sizing activated carbon adsorption columns for pollution mitigation and/or metals recovery. Adsorption of metal ions may be characterized by breakthrough behaviour. A metal ion concentration wave moves through the carbon bed in the direction of flow. Eventually this wave reaches the exit. When the metal ion concentration in the exit reaches 5% of the inlet concentration, breakthrough is deemed to have occurred in common practice, although other levels can be used in this definition. This is the breakthrough definition used for pollution mitigation. On the other hand, when the concentration attains 95% of inlet, the adsorption capacity is deemed to be
exhausted. The latter breakthrough definition is used when the purpose of adsorption is metal recovery.
design application. Models also serve to predict breakthrough when the bed height is known. This is the trouble shooting or process control problem.
Adsorption requires two phases mass transport to describe the phenomena. Significant adsorption capacity mandates high internal surface area and thus high porosity. Consequently, diffusion through the adsorbent pore space may have a large effect on breakthrough. For adsorption from an aqueous phase, liquid diffusivities are involved. These diffusivities are several orders of magnitude smaller than gas phase diffusivities. Although in the earlier works[1,4], it was found that diffusion contributed little to breakthrough in adsorption from the gas phase, this can no longer be assumed for adsorption from liquids. Indeed, a large literature discusses the importance of diffusion in the latter system[5,8]. Diffusion through a boundary layer on the outer surfaces of the activated carbon particles may also contribute to the mass transfer resistance.
The earlier work mentioned above found that the rate of adsorption in gas-solid systems was so fast that it could not be measured. Chen and co-workers[7,9] mention the difficulty of separating adsorption rate from diffusivity effects in liquid systems. They followed the common practice and assumed that the adsorption rate is fast and can be neglected relative to other transport steps. Equilibrium thus governs the distribution of the adsorbate between aqueous and solid phases. Equilibrium delays the appearance of adsorbate in the effluent from the carbon bed and influences breakthrough in this way.
Breakthrough is also dependent on mixing during passage of the fluid through the bed. Various processes contribute to mixing: viscous drag, preferential flow through channels in the bed, bypassing along the bed walls, slow exchange between flowing fluid and stagnant packets of fluid, fluid distribution at the entrance and wicking or drop formation at the bottom of the bed as the fluid phase disengages. These processes are lumped into a dispersion term. Heat effects of metal ion adsorption are small because of the small quantities involved. Thus, the process can be treated as isothermal.
In what follows, breakthrough data will be presented and the reliability of the experimental design and data extraction procedure discuss. Reliability is demonstrated by obtaining the same values of model parameters using different dynamic inputs or different bed heights. Parameters such as equilibrium constants and effective diffusivities should be independent of hydraulic loading so reliability is assured if the same values for these parameters at different feed rates to the
experimental column are obtained. Another aspect of reliability is insensitivity of model parameters to control in the parameter estimation, such as grid spacing in the difference approximation used in integration of the model partial differential equations and the value of convergence tolerances. Reproducibility is another concern. It can be tested by replicate experiments. These should deliver the same values for model parameters.
Procedures can also be validated by properly reproducing measurements of other investigators. For the system studied, adsorption of copper ions on activated carbon, activated carbons available now are not identical to those used by past investigators such as Chen et al[9], Chen and Wang[10] and Chen et al[11]. Nevertheless, equilibrium parameters can be expected to be of the same order of magnitude. Effective diffusivity of the ions within the porous carbon particles will also depend strongly on the carbon so that once again just order of magnitude agreement can be anticipated. Other parameters in breakthrough models, such as dispersion in a packed bed of particles or the volumetric mass transfer coefficient for ion transport from the flowing liquid phase to the stationary solid phase, show a much weaker dependence on the carbon material. Agreement with past measurements or with literature correlations can be expected for these parameters.
MATERIALS AND METHODS
414
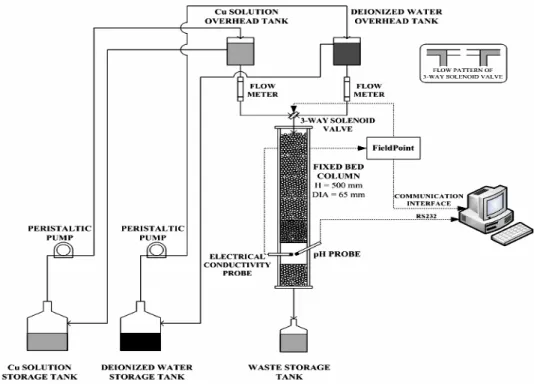
Fig. 1: Schematic of an experimental system used for breakthrough measurement in an activated carbon column
Copper (II) ion concentration in the effluent from the carbon bed is detected in a small sampling volume located below the bed as shown in the Fig. 1. Both conductivity and pH were detected. At low concentrations, conductivity is linearly related to the copper (II) ion concentration so that if just one metal is present its concentration is readily established through calibration. In the experiments, a Thorton 822 resistivity sensor was used to measure conductivity. The instrument compares the resistivity in its measuring cell to the resistivity of ultrapure water and is temperature compensated to 25ºC. It furnishes an analogue signal that was digitalized and converted into conductivity by the FieldPoint computer interface.
An Orion 2-Star pH meter (ThermoElectron Corp.) was used to measure pH. This is a high sensitivity, temperature compensated instrument with a range of pH 2 to 10. It provided a digital output through an RS232 interface. Temperature of the column effluent was monitored continuously by a thermocouple built into the pH meter. This was done to insure that there was no temperature excursion during a measurement since conductivity of metal ion solution is temperature sensitive. Experiments were carried out in an air conditioned laboratory in which temperature never varied by more than ±1ºC. At the concentration used,
heat effects during adsorption are negligible. Both detection instruments were connected to a computer through a FieldPoint interface via an Ethernet circuit. The analogue signal from the conductivity monitor went through a digital output module. The signal to the solenoid valve also went through this interface. It was connected to the valve through a relay with a DC output. The FieldPoint unit sent conductivity or pH readings to files in the computer at 5 Sec intervals.
detectors. Glass beads used in the distributor beds were spherical, uniform in size and non-porous with a diameter (dp)bead = 1.7 mm. This diameter is reasonably
close to the mean particle size of the carbon granules.
Materials: The granular activated carbon was used in this investigation was supplied by Carbokarn Co. Ltd, Thailand. Specific surface area was 1 413 m2 g−1. An average particle size, density and particle porosity were 0.15 cm, 0.6029 g/cm3 and 0.3278, respectively. The copper solution was prepared from anhydrous copper sulphate (CuSO4). It was diluted using deionized water
to 4.8×10⁻⁵ M prior to use. Because of the adsorption equilibrium is sensitive to pH, some experiments were performed using copper ion in a buffered solution. The buffer at pH 6 was prepared by mixing 0.1 M potassium dihydrogen phosphate (KH2PO4) and 0.1 M sodium
hydroxide (NaOH). All chemical were supplied by Merck (Germany). The experiments showed no difference in breakthrough between buffered and unbuffered solutions. Consequently, most runs were made with unbuffered solutions.
Breakthrough model: A reliable experimental and parameter extraction procedure should return the same results in terms of model parameters for different dynamic inputs and carbon bed heights. To investigate this, the conventional packed bed heterogeneous model was employed: 2 2 Q A (1 )
( ( ) = ) 0
∂ ∂ ∂
+ − +
∂ ∂ ∂
−
− =
b b b
z
t b z
b
ext g p b p r R
b
C C C
D z
k A C C
χε ε ρ ε (1) 0 ) 2 ( ) ( 2 2 = ∂ ∂ + ∂ ∂ − ∂ + ∂ r C r r C D t q
C p p
eff p p p ρ ε (2)
For a step up or pulse input assuming start up with water free of copper ion, the initial condition is Cp = Cb = 0 while for step down input from a bed saturated with copper ion, it is Cp = Cb = (Cb)0 where (Cb)0 is the copper ion concentration in the feed.
Boundary condition for the outer surface of a carbon particle is kext(Cb-(Cp)r = R) = Deff (∂Cp/∂r)r = R . The boundary condition at the centre of the particle is in all cases, (∂Cp/∂r)r = 0 = 0. Bed boundary condition at the
entrance at t > 0 is given by the experimentally measured output from the distributor bed at the same hydraulic loading. This is true for both the step and
pulse inputs. At the end of the bed, the condition is given by (∂Cb/∂t)z = L = 0 for all inputs. The Langmuir isotherm, q = qmaxbCb/(1+bCb) completes the model chosen to test the parameter extraction routine and the data collection procedure. In application, all concentrations were normalized by the inlet concentration ((Cb)0). Spatial parameters were
normalized by bed height (L) for the carbon bed and radius (R) for the activated carbon granules.
Extraction of model parameters: Use of this breakthrough model requires evaluation of five parameters. It is an estimate test of the proposed procedures. All the experimental data collected was analyzed. A curve fitting procedure was employed to extract the model parameters b, qmax, Deff, kextSg and Dz. Remaining model parameters were known: dp = 0.15 cm, dbed = 3.5 cm, L = 5 cm, εb= 0.30, εp = 0.3278 and
ρp = 0.604 g/cm
3
. The lsqcurvefit routine in MATLAB employs as a stopping criteria the number of function evaluations, the number of iterations, a tolerance for the sum of squares differences between prediction and experiment and a tolerance for the change of an estimated parameter after iteration. Calculation of the sum of squares uses normalized concentrations at the outlet of the carbon bed. The prediction comes from integration of the partial differential equation model in time and space. Iteration introduces a convergence criterion. The same criterion was used for the bed and a particle. On the one hand, a tight criterion insures that it will not affect the estimated parameters, but on the other hand, it greatly increases the computing load and thus the program running time.
416 tested by doubling its size. Run time decreased and the residual sum of squares was affected (because fewer differences were calculated), but again the affect on parameter estimates was small.
Dynamic measurements: The rapid experimental system is used in two steps. The first step is to use the glass bead column to obtain the time profile of the input to the shallow activated carbon bed. After flushing, flow is set at the desired loading and at a suitable time, the Copper (II) Ion solution is introduced by switching feed vessels as indicated in Fig. 1. This constitutes a step-up input. Effluent from the glass bead bed is monitored beginning at the injection time and the detected signal is recorded. With glass beads, there is little tailing and only about 20 min of monitoring is needed. For a step down input, solution passes through the bed until conductivity in the outlet is constant. This takes no longer than 20 min. Then flow is switched from solution to deionised water and data is recorded. Pulse experiments are a combination of step up and step down inputs. Preliminary experiments showed that for the solution concentrations, hydraulic loading and activated carbon bed heights used there was a large change in conductivity over an adequate time interval if pulse lengths between 3 and 15 min were used. In this range, the carbon bed is not saturated. Thus two pulse durations, 5 and 10 min, were selected for our experiments. These pulses are intended to represent a spike or Dirac delta disturbance.
In the Sec step, after flushing the bed, the Copper (II) Ion solution is introduced to the upper most bed at t = 0 as a pulse or step up input and data collection commences in the sample volume after the carbon bed. Because of the shallow bed, data collection can be as short as 40 to 60 min with 5 or 10 min pulses or step up and step down inputs. Step up, step down and pulse experiments were conducted for the carbon bed in the same way as those for the glass bead distributor beds. Computer control made the inputs identical in both steps.
RESULTS AND DISCUSSION
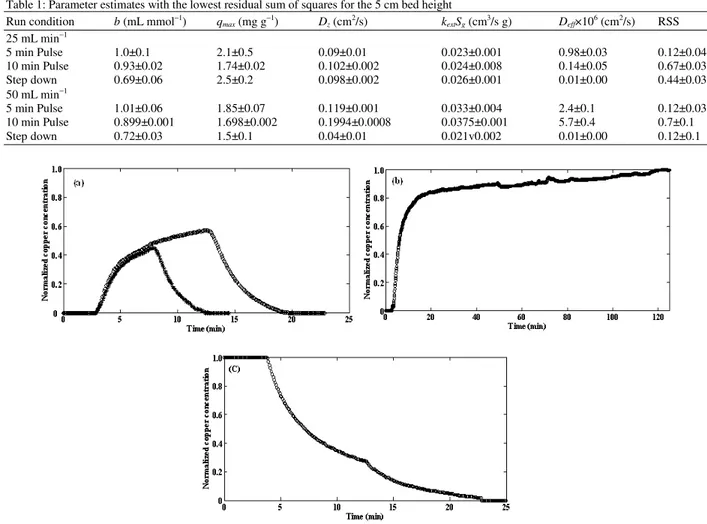
Breakthrough measurements in beds of activated carbon: The procedure described above produced quick and smooth breakthrough curves for the step inputs and smooth responses for the pulse inputs. The later were well below the inlet concentrations. Because diffusion in the porous activated carbon is rate-controlling, this means that the activated carbon was not saturated in the bed except, perhaps, in the initial layers of particle.
Fig. 2 plots typical experimental responses for the three inputs used. The rapid rise in Copper (II) concentration lasts for about 15 min for the step up input and is followed by an extended tail with slowly increasing concentration. The latter lasted for almost 100 min. The rapid drop in concentration over about 15 min is evident in Fig. 2c for the step down input, but the expected extended tailing is absent. This appears to be a consequence of the sensitivity of resistivity probe used and noise in the signal. Data collection was discontinued about one to two min after the conductivity appeared to reach that of the deionised water used for flushing.
Equilibrium, mixing and transport properties for adsorption of copper ions on activated carbon: Parameter estimates for starting values that gave the lowest residual sum of squares on convergence are given in Table 1 for experiments conducted with a 5 cm bed height of activated carbon. Approximations in the model and noise in the data prevent a search routine from forcing the residual sum of squares to zero. MATLAB’s lsqcurvefit routine applied to the data was able, at best, to achieve an RSS of about 0.1. For some runs and with certain sets of starting values the RSS reached 10 or 15. Because of the evidently irregular 6-dimensional search surface, it is unwise to assume parameter estimates from a single data set are optimal. Parameters such as Dz and kextSg depend on hydraulic
loading so parameter means were calculated at each of the two feed flow rates. Inspection of the estimates in the tables shows a consistent difference in the Langmuir equilibrium constant b and the effective diffusivity, Deff, between the step and pulse inputs. Thus, estimates
for these two inputs were separated also.
Several investigators[10,13,14] report Langmuir parameters for Calgon Filtrasorb carbon. This is a bituminous coal based activated carbon with a surface area of about 1 000 m2 g−1. Thus, it is similar to the material used in this study. Their values for the equilibrium constant, b, range from 0.059 to 3.06 mL mmol−1 and for the carbon capacity, qmax, from 0.89 to
12.8 mg g−1. The comparison of the parameter estimates with literature values for pulse inputs apply equally to the parameter estimates based on step inputs, except for Deff. These values are 3 to 4 times smaller than any
reported in the literature. They also show an effect of hydraulic loading. There is a large difference in effective diffusivity between these two different inputs for dynamic measurements. In addition to the large change in Deff, the Langmuir equilibrium constant, b
and the volumetric mass transfer coefficient, kextSg, are
Table 1: Parameter estimates with the lowest residual sum of squares for the 5 cm bed height Run condition b (mL mmol−1) q
max (mg g
−1) D
z(cm2/s) kextSg(cm3/s g) Deff×106 (cm2/s) RSS 25 mL min−1
5 min Pulse 1.0±0.1 2.1±0.5 0.09±0.01 0.023±0.001 0.98±0.03 0.12±0.04 10 min Pulse 0.93±0.02 1.74±0.02 0.102±0.002 0.024±0.008 0.14±0.05 0.67±0.03 Step down 0.69±0.06 2.5±0.2 0.098±0.002 0.026±0.001 0.01±0.00 0.44±0.03 50 mL min−1
5 min Pulse 1.01±0.06 1.85±0.07 0.119±0.001 0.033±0.004 2.4±0.1 0.12±0.03 10 min Pulse 0.899±0.001 1.698±0.002 0.1994±0.0008 0.0375±0.001 5.7±0.4 0.7±0.1 Step down 0.72±0.03 1.5±0.1 0.04±0.01 0.021v0.002 0.01±0.00 0.12±0.1
Fig. 2: Normalized effluent conductivity signals for a 5 cm bed height and a 25 mL min−1 flow rate for (a) 5 min (star) and 10 min (circle) pulses, (b) step up input and (c) step down input
One explanation for smaller values of these three parameters is a concentration effect on the equilibrium constant and on the molecular diffusivity. Ionic concentrations are much higher in the step up experiments, particularly in the tail region, than they are in the pulse experiments at most axial positions and for most time steps. Chen and Wang[7] report a decrease in b at higher cation concentrations. Molecular diffusivity depends on concentration and decreases as concentrations rise. Effective diffusivity is proportional to molecular diffusivity, while the volumetric mass transfer coefficient is a weaker function of this fluid property. Dynamic methods have been touted as quick, simple methods of amassing transport and equilibrium data. Reliable data, in principle, can be obtained by such techniques provided the various elementary steps in the process have similar intrinsic rates. This
condition is seldom met. In this study, diffusion in the porous carbon is the dominant transport step that determines response to changes of input to a bed of activated carbon. Adsorption, mixing during flow through the bed and mass transfer from the fluid to the solid phase has but a small effect on the response.
418
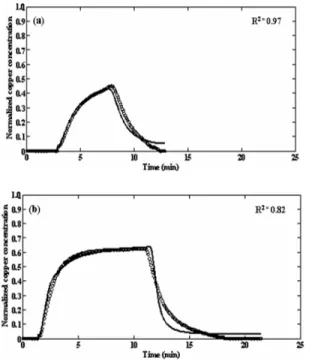
Fig. 3: Comparison of experimental (ο) and predicted (−−) response curves for (a) 5 min pulse input for a 5 cm bed at a flow rate of 25 mL−1 min and (b) for a 10 min pulse input using a 5 cm deep carbon bed and a liquid flow rate of 50 mL min−1. Model parameters for the prediction are averages step input parameters
effluent curves for both experiments is good as indicated by R2 of 0.97 for Fig. 3a and 0.82 for Fig. 3b. Fig. 4 compares experimental and predicted responses to a step up in cation concentration in Fig. 4a and to a step down in concentration in Fig. 4b. Predictions based on the average pulse parameters and average step input parameter. It is not surprising that the predictions based on the step change parameters (R2 = 0.80 in Fig. 4a and 0.98 in Fig. 4b) represent the measurements somewhat better than do parameters drawn from measurements using pulse inputs (R2 = 0.60 in Fig. 4a and 0.99 in Fig. 4b). Nevertheless, the predictions using the later parameters are acceptable. For predicting breakthrough at 5 % of the feed concentration or exhaustion at 95 % of feed concentration, Fig. 4a shows that either set of parameters is satisfactory. The simulations are unsatisfactory for prediction of the middle portion of the breakthrough curve. With respect to step down, Fig. 4b shows the step change parameters over predict the tailing of the response. For estimating breakthrough, either a pulse or step input can be used. The pulse input is probably preferable because it provides response
Fig. 4: Comparison of predicted and experimental (ο) response to (a) a step up input for the 5 cm bed height at a 50 Ml min−1) and (b) a step down input for the 3 cm bed height at a 25 Ml min−1. The dot curve (-) are predictions based on parameters from average step input parameter while the dashed curve ( ) uses average pulse parameters
predictions that are as good as those from step change inputs, but data collection is faster: about ½ h for a pulse input compared to 2 h for a step input.
CONCLUSIONS
determines the response in the bed effluent to an input. Consequently, error introduced through noise in the experimental measurements or through model approximations appears in this key parameter.
Response predicted using a conventional heterogeneous packed bed model and assuming the Langmuir adsorption isotherm adequately fitted individual pulse or step change experiments when parameter averaged over many measurements and different starting values in the search routine were used. This observation demonstrates the reliability of the experimental procedure and the data extraction method. Use of a pulse input appears to be preferable to a step change input for the response measurements. The latter input resulted in anomalous values of the effective diffusivity and generally higher residual sum of squares on termination of a search. Dynamic experiments as performed do not appear to give reliable estimates for the individual processes occurring in ion adsorption. Equilibrium constants changed only slightly from starting values and effective diffusivities depended on hydraulic loading.
ACKNOWLEDGEMENT
Financial support from the Thailand Research Fund through the Royal Golden Jubilee Ph.D. Program (Grant No.PHD/0099/2546) is gratefully acknowledged. The Chemical Reaction Engineering Group of the University of Waterloo provided research equipment support and valuable advice.
REFERENCES
1. Gangwal, S.K., R.R. Hudgins and P.L. Silveston, 1978. Conditions for the Measurements of Mass Transfer by Pulse Chromatography. Can. J. Chem. Eng., 56: 554-557.
2. Gangwal, S.K., R.R. Hudgins and P.L. Silveston, 1979. Reliability and Limitations of Pulse Chromatography in Evaluating Properties of Flow Systems 1.Modelling and Experimental Considerations. Can. J. Chem. Eng., 57: 609-620. 3. Kehinde, A.J., R.R. Hudgins and P.L. Silveston,
1983. Measurement of Chemisorption Rates and Equilibria by Pulse Chromatography. J. Chem. Eng. Japan., 16 (6): 476-482.
4. Kehinde, A.J., R.R. Hudgins and P.L. Silveston, 1988. Measurement of Mass Transfer in Packed Beds at Low Reynolds Numbers by Imperfect Pulse Chromatography. J. Chem. Eng. Japan., 21 (6): 468-476.
5. Costa, E., G. Calleja and F. Domingo, 1985. Adsorption of Gaseous Hydrocarbon on Activated Carbon: Characteristic Kinetic Curve. AIChEJ., 31 (6): 982-991.
6. Chen, J.P. and M.S. Lin, 2001. Equilibrium and Kinetics of Metal Ion Adsorption onto a Commercial H-type Granular Activated Carbon: Exp. and Mode. Stud. Water Res., 35: 2385-2394. 7. Chen, J.P. and L. Wang, 2004. Characterization of
Metal Adsorption Kinetic Properties in Batch and Fixed Bed Reactors. Chemosphere, 54: 397-404. 8. Choy, K.K.H., D.C.K. Ko, C.W. Cheung,
J.F. Porter and G. McKay, 2004. Film and Intraparticle Mass Transfer during the Adsorption of Metal Ions onto Bone Char. J. Colloidal Interface Sci., 271: 284-295.
9. Chen, J.P., S. Yiacoumi and T.G. Blaydes, 1996. Equilibrium and Kinetic Studies of Copper Adsorption by Activated Carbon. Sep. Technol., 6 (2): 133-146.
10. Chen, J.P. and L. Wang, 2000. Removing Copper, Zinc and Lead Ions by Granular Activated Carbon in Pretreated Fixed Bed Columns. Sep. Purif. Technol., 19: 157-167.
11. Chen, J.P., J.-T. Yoon and S. Yiacoumi, 2003. Effects of Chemical and Physical Properties of Influent on Copper Sorption onto Activated Carbon Fixed Bed Columns. Carbon, 41: 1635-1644. 12. Raghavan, N.S. and D.M. Rutheven, 1983.
Numerical Simulation of a Fixed Bed Sorption Column by the Method of Orthogonal Collocation. AIChE, 29: 922-925.
13. Chen, J.P., J.-T. Yoon and S. Yiacoumi, 1983. Effects of Chemical and Physical Properties of Influent the Method of Orthogonal Collocation. AIChEJ, 29: 922-925.