GMM-UBM Based Speaker Verification in Multilingual
Environments
Utpal Bhattacharjee and Kshirod Sarmah
Department of Computer Science and Engineering, Rajiv Gandhi University Rono Hills, Doimukh, Arunachal Pradesh, PIN-791 112, India
Abstract
Speaker verification system shows poor performance when speaker model training is done in one language and the testing in another language. This is a major problem in multilingual speaker verification system. In this paper, we report the experiment carried out on a recently collected multilingual and multichannel speaker recognition database to study the impact of language variability on speaker verification system. The speech database consists of speech data recorded from 200 speakers with Arunachali languages of North-East India as mother tongue. The speech samples are collected in three different languages English, Hindi and a local language of Arunachal Pradesh. The collected database is evaluated with Gaussian Mixture Model based speaker verification system using universal background model (UBM) for alternative speaker representation and Mel-Frequency Cepstral Coefficients (MFCC) as a front end feature vectors. The impact of the mismatch in training and testing languages have been evaluated.
Keywords
:
Speaker Verification, Multilingual, GMM-UBM, MFCC.1.
Introduction
Automatic Speaker Recognition (ASR) refers to recognizing persons from their voice. The sound of each speaker is unique because of the difference in vocal tract shapes, larynx sizes and other parts of their voice production organs. ASR System can be divided into either Automatic Speaker Verification (ASV) or Automatic Speaker Identification (ASI) systems [1,2,3]. Speaker verification aims to verify whether an input speech corresponds to the claimed identity. Speaker identification aims to identify an input speech by selecting one model from a set of enrolled speaker models. In some cases, speaker verification will follow speaker identification in order to validate the identification result [4]. Speaker Verification is the task of determining whether a person is who he or she claims to be, a yes/ no decision. Since it is generally assumed that imposter, the falsely claimed speaker, are not known to the system, so it is also referred to as an Open-Set task [5].
The speaker verification system aims to verify whether an input speech corresponds to the claimed identity or not. A security system based on this ability has great potential in
several application domains. Speaker verification systems are typically distinguished into two categories – text-dependent and text-intext-dependent [6]. In text-text-dependent system, a predetermined group of words or sentences is used to enroll the speaker to the system and those words or sentences are used to verify the speaker. Text-dependent system use an explicit verification protocol, usually combined with pass phrases or Personal Identification Number (PIN) as an additional level of security. In text-independent system, no constraints are placed on what can be said by the speaker. It is an implicit verification process where the verification is done while the user is performing some other tasks like talking with the customer care executive or registering a complain.
The state-of-art speaker verification system use either adaptive Gaussian mixture model (GMM) [7] with Universal Background Model (UBM) or Support Vector Machine (SVM) over GMM super-vector [8]. SVM has also been successfully combined with GMM to increase accuracy [9,10]. Mel-frequency Cepstral coefficients are most commonly used feature vector for speaker verification system. Supra-segmental features like – prosody, speaking style are also combined with the cepstral feature to improve the performance [11].
Till date, most of the speaker verification system operates only in a single-language environment. Multilingual speaker recognition and language identification are key to the development of spoken dialogue systems that can function in multilingual environments [8].
To evaluate the speaker verification system in multi-lingual environment, a multi-multi-lingual speaker recognition database has been developed and initial experiments were carried out to evaluate the impact of language variability on the performance of the baseline speaker verification system.
The rest of the paper is organized as follows: Section–2 describes the details of the speaker recognition database. Section–3 details the speaker verification system. The experimental setup, data used in the experiments and result obtained are described in Section– 4. The paper is concluded in Section–5.
2.
Speaker Recognition Database
In this section we describe a recently collected speaker recognition database in Arunachali Language of North East India. The database is named as Arunachali Language Speech Database (ALS-DB). Arunachal Pradesh of North East India is one of the linguistically richest and most diverse regions in all of Asia, being the home to at least thirty and possibly as many as fifty distinct languages in addition to innumerable dialects and subdialects thereof [12]. The vast majority of languages indigenous to modern-day Arunachal Pradesh belong to the Tibeto-Burman language family. The majority of these in turn belong to a single branch of Tibeto-Burman, namely Tani. Almost all Tani languages are indigenous to central Arunachal Pradesh while a handful of Tani languages are also spoken in Tibet. Tani languages are noticeably characterized by an overall relative uniformity, suggesting relatively recent origin and dispersal within their present-day area of concentration. Most Tani languages are mutually intelligible with at least one other Tani language, meaning that the area constitutes a dialect chain. In addition to these non-European languages, the Indo-European languages Assamese, Bengali, English, Nepali and especially Hindi are making strong inroads into Arunachal Pradesh, primarily as a result of the primary education system in which classes are generally taught by immigrant teachers from Hindi-speaking parts of northern India. Because of the linguistic diversity of the region, English is the only official language recognized in the state.
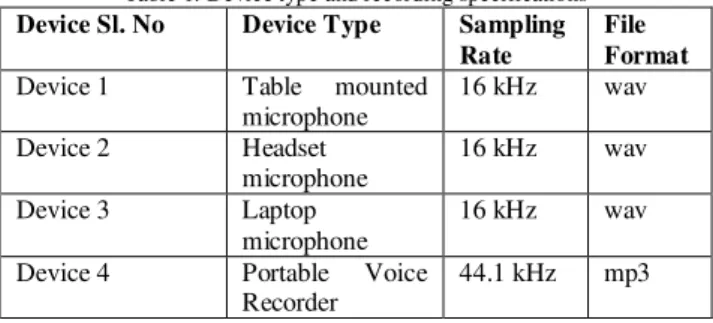
To study the impact of language variability on speaker recognition task, ALS-DB is collected in multilingual environment. Each speaker is recorded for three different languages – English, Hindi and a local language, which belongs to any one of the four major Arunachali languages - Adi, Nyishi, Galo and Apatani. Each recording is of 4-5 minutes duration. Speech data were recorded in parallel across four recording devices, which are listed in table -1.
Table 1: Device type and recording specifications Device Sl. No Device Type Sampling
Rate
File Format
Device 1 Table mounted
microphone
16 kHz wav
Device 2 Headset
microphone
16 kHz wav
Device 3 Laptop
microphone
16 kHz wav
Device 4 Portable Voice
Recorder
44.1 kHz mp3
The speakers are recorded for reading style of conversation. The speech data collection was done in laboratory environment with air conditioner, server and other equipments switched on. The speech data was contributed by 52 male and 48 female informants chosen from the age group 20-50 years. During recording, the subject was asked to read a story from the school book of duration 4-5 minutes in each language for twice and the second reading was considered for recording. Each informant participates in four recording sessions and there is a gap of at least one week between two sessions.
3.
Speaker Verification System (SVM)
All speaker verification system contains two main parts: Feature Extraction and Pattern Matching. Feature extraction is the process of extracting the speaker and language related feature vectors from the voice signal which can later be used to represent the speaker and the language that the speaker had spoken. Pattern matching technique involves the real procedure to verify the known or unknown speaker (open set) by comparing the extracted features from his or her input voice signal with the ones from the set of known speaker that stored in the speech database.
3.1 Feature Extraction
Feature extraction is also known as speech parameterization. Speech parameterization consists in transforming the speech signal to a set of feature vectors. The purpose of feature extraction phase is to extract the speaker-specific information in the form of feature vectors at reduced data rate which is more compact and more suitable for statistical modeling and the calculation of a distance or any other kind of score. The feature vector represents the speaker–specific information due to vocal tract, excitation source and behavioral traits. A good feature vector set should have representation all of the components of speaker information.
aim to extract the speaker vocal tract and languages related features. A study by D. Reynolds in 1994 [13] reveals that among different features like Linear Predictive Cepstral Coefficients (LPCCs), Mel Frequency Cepstral Coefficients (MFCCs), Linear Frequency Cepstral Coefficients(LFCCs) and Perceptual Linear Prediction Cepstral coefficients (PLPCCs), MFCC gives the best performance for speaker recognition.
3.1.1 Mel-Frequency Cepstral Coefficients (MFCC)
Mel-frequency cepstral coefficients (MFCCs) are mostly related to the human peripheral auditory system. The main purpose of the MFCC processor is to mimic the behavior of the human ears [14]. According to studies, human hearing does not follow the linear scale but rather the Mel-spectrum scale which is a linear spacing below 1 KHz and logarithmic scaling above 1 KHz.
At first step, the pre-emphasized and windowed speech signal frame is converted into spectral domain by the Fast Fourier Transformation (FFT). In the second step, the magnitude spectrum is smoothed by a bank of triangular bandpass filters which emulates the critical band of processing of the human ear. In the next step, each of the bandpass filters computes a weighted average of that sub-band, which is then compressed by logarithm. Finally, the log-compressed filter outputs are decorrelated using the Discrete Cosine Transform (DCT).
If the output of an M-channel filterbank as Y(m), m=1,2………..,M, Then MFCCs are obtained as follows:
C = ∑ [logY(m)] cos ( m− ) (1) Here n is the index of the cepstral coefficient. The final MFCC vector is obtained by retaining about 12-15 lowest DCT coefficients.
The 0th cepstral coefficient is discarded because it depends on the intensity of the frame. The mel-spectrum plot is converted back to the time domain by using the following formula:
Mel(f) = 2595∗log ( 1 + ) (2)
Where f is linear frequency.
The resultant matrices are known as the Mel-Frequency Cepstrum Coefficients. The spectrum provides a simple and unique representation of the spectral characteristics of the speech signal which is the main factor for representing and recognizing the voice characteristics of the speaker.
3.2 Models and Classifiers
Speaker models and classifiers are tied not only to the features used, but also to the task being address [16]. The speaker verification is a binary task whether the unknown speaker is the same as the claimed speaker. The open-set verification system usually dealt with by using some general impostor model. For both the Speaker Identification and Speaker Verification systems, there are lots of models and classifiers that have been used. Although, early classifiers for speaker recognition include non-parametric technique like VQ, DTW etc. now a days classification methods for speaker recognition have centered on statistical approaches like HMM, GMM etc.
The structure and choice of a classifier depends on the application and the features used as well as the level of user cooperation, expected channels and recording devices, amount of speech data available for enrollment and detection and finally the requirement of recognition accuracy.
Fig.1. General Classifier structure for speaker verification system
Si gnal
Feat ure ext r action
Speaker Model
∑
Backgr ound Model
3.2.1 Gaussian Mixture Model (GMM) as a
Classifier
Over the last decade, the Gaussian Mixture model GMM [12] has become established as the standard classifier for text-independent speaker recognition. Gaussian Mixture model (GMM) often to be used to the speaker verification because this mode has good ability of recognition [10]. One of the powerful attributes of the GMM is its ability to form smooth approximations to arbitrarily shaped distributions [13]. GMMs have unique advantages compared to other modeling approaches because their training is relatively fast and the models can be scaled and updated to add new speakers with relative ease [17].
A Gaussian Mixture Model (GMM) is a parametric probability density function represented as a sum of Gaussian components densities. GMMs are commonly used as a parametric model of the probability distribution of a continuous measurement of features in a biometric system [13].
A GMM is a weighted sum of M component densities is given in the form
P(x|λ)= ∑ w b(x) (3)
Where x is a D-dimensional random vector, b(x), i=1,2……M, is the component densities and i=1,2,….,M, is the mixture weights.
The Gaussian Function can be defined in the form
b(x)=
( ) |∑| /
exp − ( x− μ) ∑ ( x− μ) (4)
with mean vector μ and covariance matrix ∑. The mixture weight satisfy the constraint that ∑ = 1.
The complete Gaussian mixture model is parameterized by
the mean vectors, covariance matrices and mixture weight from all component densities. These parameters can collectively represented by the notation:
λ= { ,μ, ∑ }, for i= 1,2 ……, M (5)
In speaker verification system, each speaker can be represented by such a GMM and is referred to by the
above model λ.
For a sequence of T test vectors X= {x1, x2, x3,… …, xT} the
required standard way to calculate the GMM likelihood in the log domain as follows:
L(X| λ) = log(X| λ) = ∑ log( x |λ) (6)
Once a model is trained then (3) can be used to compute the log-likelihood of model λ for an input test set of feature vector, X, i.e.,
log ( | ) =∑ logp( x | λ) (7) It is also important to note that because the component Gaussians are acting together to model the overall feature densities, full covariance matrices are not necessary even if the features are not statistically independent. The linear combination of diagonal covariance basis Gaussians is capable of modeling the correlations between feature vector elements. The effect of using a set of M full covariance matrix Gaussians can be equally obtained by using a larger set of diagonal covariance Gaussians.
3.2.1.1 Maximum Likelihood Parameter Estimation
For a given training vectors and a GMM configuration, we
have to estimate the parameters of the GMM, λ, for the
best matches for the distribution of the training feature vectors. The most popular and well-known method is maximum likelihood (ML) estimation.
The main purpose of ML estimation is to find the model parameters which maximize the likelihood of the GMM given the training data. For a sequence of T training vectors X= x1, x2, x3,……… xT , the GMM likelihood can
be defined as
( | ) = ∏ p(x |λ) (8)
The speaker-specific GMM parameters are estimated by the Expectation-Maximization (EM) algorithm using training data spoken by the corresponding speaker. The basic idea of the EM algorithm is, beginning with an initial
model λ, to estimate a new model such that ( | )≥ ( | ). The new model then becomes the initial model for the next iteration and the process is repeated until some convergence threshold is reached [13].
On each EM iteration, the following re-estimation formulas are used which guarantee a monotonic increase in the model’s likelihood value,
Mixture Weights:
= ∑ pr( i|x ,λ) (9) Means:
= ∑ ( | , )
∑ ( | , ) (10)
σ = ∑ ( | , )
∑ ( | , ) − μ (11)
The a posteriori probability for component i is given by
pr (i|x ,λ) = ( )
∑ ( ) (12)
3.2.1.2 Maximum A Posteriori (MAP) Parameter
Estimation
GMM parameters can also be estimated using Maximum A Posteriori (MAP) estimation. MAP estimation is used to derive speaker model from a Universal Background Model (UBM) by adaptation. Like the EM algorithm, the MAP estimation is a two-step process. The first step is similar to the “Expectation” step of the EM algorithm that sufficient statistics of training data are computed for each mixture in the prior model. In the second step, the new sufficient statistics from training data are used to update the prior sufficient statistics for mixture i to create the adapted parameters for mixture i.
The specifics of the adapting are defined as for given a prior model and training vectors from the desired class X= {x1, x2, x3,…, xT }. Here we first compute the probabilistic
alignment of the training vectors into the prior mixture components. For mixture i in the prior model, we compute P , as in Equation (10). Then we compute the sufficient statistics for the weight, mean and variance parameters as follows.
Weight
= ∑ Pr i x ,λ (13)
Mean
( ) =
∑ Pr i x ,λ x (14) Variance
( ) =
∑ Pr i x ,λ x (15)
Next, the new sufficient statistics from training data are used to update the prior sufficient statistics for mixture i to create the adapted parameters for mixture i. with the following equations:
Adapted mixture weight,
w = [ a n / T+ (1-a ) wi ] š (16)
Adapted mixture mean,
μ = a E (x) + (1-a ) μ (17)
Adapted mixture variance,
σ = a E(x ) + (1-a ) (σ +μ ) - μ (18)
The adaptation coefficients controlling the balance between old and new estimates are {a , a , a } for the weight, means and variances, respectively. The scale factor š, is computed over all adapted mixture weights to ensure they sum to unity.
For each mixture and each parameters, a data-dependent adaptation coefficient añ, ñ € {w,m,v}, is used in the above
equation defined as añ =
ñ (17)
where ñis a fixed “relevance” factor for parameter ñ .
It is common in speaker recognition application to use one adaptation coefficient for all parameters ( = = = / ( + )) and adapt only certain GMM parameters such as the mean vectors.
There are lots of reasons to consider in contrasting one of the standard MAP approaches to its iterative form. The standard MAP technique is simply a single iteration while EM based result is iterative. A single iteration assumes that the mixture mean components vary in a completely independent manner, and consequently, only a single iteration would be required to solve the MAP solution.
Because the environment and even the speaker’s voice characteristics may change over time, one can adapt the model for P, when one is sure that the current speaker is P. Maximum a posteriori probability (MAP) adaptation combined with confidence weighting improved authentication performance under channel mismatch conditions by 61%, despite impostor attacks [18].
3.2.2 Universal Background Models (UBM)
A UBM or World Model is a model in a speaker verification system to represent general, person-independent, channel independent feature characteristics to be compared against a model of speaker-specific feature characteristics when making an accept or reject decision. Here, the UBM is a speaker-independent GMM trained with speech samples from a large set of speakers to represent general speech characteristics. The UBM also use when training the speaker-specific model by acting as a prior model in MAP parameter estimation.
hypothesis H1 is likewise represented by a model λp’. The likelihood ratio statistic is then defined as
LR(X) = ( | )
( | ) (19)
For given a set of N background speaker models { λ1, λ2,
λ3,……… λN } then the alternative hypothesis is represented by
p( X| λp′) = F(p( X|λ )p(X| λ ) ……. p( X|λ )) (20) Where F() is some function, such as average or maximum, of the likelihood values from the background speaker set. Typically, GMMs are used for distribution models and a speaker specific model are derived by using MAP estimation with the UBM acting as the prior model. In GMM-UBM system we use a single, speaker-independent background model to representp( X| λp′).
The theory explains for determining the statistic from a single feature vector observation sample from the target or non-target speaker classes. This test statistic deals with two speaker classes identified as the target speaker and non-target (UBM) speaker set specified by models, λ and λ . For a given T independent and identically distributed observations, X= {x1, x2, x3,……… xT }. The joint likelihood ratio may be determined. A more robust measure for speaker verification is the expected frame-based log-likelihood ratio measure can be defined as follows:
E [LLR(x)] = E [log p (x|λ ) - log p (x|λ )] = ∑ (log p(x |λ ) - log p( x |λ )) (21)
The UBM is a large GMM (1024 mixtures) trained to represent the speaker-independent distribution of features. To train a UBM, the simplest approach is to merely pool all the data and use it to train the UBM via the EM algorithm.
MAP adaptation integrates coupled target and background speaker model components is an effective way of performing speaker recognition. A significant advantage of a fully coupled system is that the coupling enables discrimination between regions of space that the GMM has learned from training speech. The mixture component will remain unadapted, if there is no adaptation observation in the region nearby a mixture component. But due to applying adaptation, mixture components near training observation will be adjusted towards the speech data. As a result adapted regions will be more discriminative [18].
3.3 Performance Evaluation
A popular method to find performance of the speaker verification system is the equal error rate (EER) which
corresponds to the operating point where probability of False Acceptance Rate (FAR %) or P(fa) is equal to False Rejection Rate(FRR%) or P(fr). Graphically, it corresponds to the intersection of the DET curve with the first bisector curve. The EER performance measure rarely corresponds to a realistic operating point. However, it is a quite popular measure of the ability of a system to separate impostors from true speakers. Another popular measure is the half total error rate (HTER) which is the average of the two error rates FAR and FRR [15]. Here we used the first method (EER) to show the performance in our experimental results.
Furthermore, the two errors rates are functions of the decision threshold [15]. So, it is possible to represent the performance of a system by plotting FAR as a function of FRR. This curve is known as the system operating characteristics which is monotonous and decreasing. Again, it has become a standard to plot the error curve on a normal deviate scale in which case the curve is known as the detection error trade-offs (DETs) curve. The DET curve representation is therefore more easily readable and allows for a comparison of the system’s performance on a large range of operating conditions [15]. Here we also showed the DET curves of our experiments.
4.
EXPERIMENTS AND RESULTS
The Gaussian mixture model with 1024 Gaussian components has been used for both the UBM and speaker model. The UBM was created by training the speaker model with speaker’s data with Expectation Maximization (EM) algorithm and finding the average of all these models [7]. The speaker models were created by adapting only the mean parameters of the UBM using maximum a posteriori (MAP) approach with the speaker specific data. The detection error trade-off (DTE) curve has been plotted using log likelihood ratio between the claimed model and the UBM and the equal error rate (EER) obtained from the DTE curve has been used as a measure for the performance of the speaker verification system.
All the experiments reported in this paper are carried out using the database ASL-DB described in section 2. An energy based silence detector is used to identify and discard the silence frames prior to feature extraction. Only data from the headset microphone has been considered in the present study. All the four available sessions were considered for the experiments. Each speaker model was trained using one complete session. The test sequences were extracted from the next three sessions. The training set consists of speech data of length 120 seconds per speaker. The test set consists of speech data of length 15 seconds, 30 seconds and 45 seconds. The test set contains more than 3500 test segments of varying length and each test segment will be evaluated against 11 hypothesized speakers of the same sex as segment speaker [8].
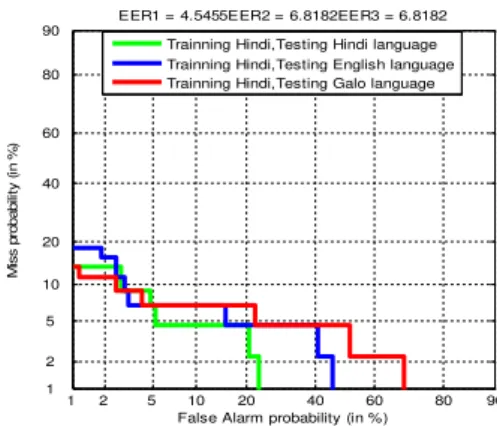
In this experiment single language (English, Hindi, and a local language) has been considered for training the system and each language has been considered separately for testing the system. Sample of length 120 seconds from a single session has been considered for training the system and the other three sessions have been considered for testing the system. UBM model has been created with a set of gender balance imposters (50% male and 50% female) speech samples of the same environment. Testing sample of length 15 seconds, 30 seconds and 45 seconds have been extracted from the speech sample of length 120 seconds. Fig. 2(a),(b) and(c) shows the DET curves obtained for the three languages in the speech database. The result of the experiments has been summarized in table–2.
Fig. 2 (a) DET curves for the SV system of training by English Language and testing by all three languages English, Hindi and Local.
Fig. 2(b) DET curves for the SV system of training by Hindi Language and testing by all three languages English, Hindi and Local.
Fig. 2 (c) DET curves for the SV system of training by Local Language and testing by all three languages English, Hindi and Local.
1 2 5 10 20 40 60 80 90 1
2 5 10 20 40 60 80 90
False Alarm probability (in %)
M
is
s
p
ro
b
a
b
ili
ty
(
in
%
)
EER1 = 4.5455EER2 = 6.8182EER3 = 9.0909 Trainning English,Testing English language Trainning English,Testing Hindi language Trainning English,Testing Galo language
1 2 5 10 20 40 60 80 90 1
2 5 10 20 40 60 80 90
False Alarm probability (in %)
M
is
s
p
ro
b
a
b
ili
ty
(
in
%
)
EER1 = 4.5455EER2 = 6.8182EER3 = 6.8182 Trainning Hindi,Testing Hindi language Trainning Hindi,Testing English language Trainning Hindi,Testing Galo language
1 2 5 10 20 40 60 80 90 1
2 5 10 20 40 60 80 90
False Alarm probability (in %)
M
is
s
p
ro
b
a
b
il
it
y
(
in
%
)
Table-2: EER for speaker verification system for training with one language and testing with each language
Training Language
s
Testing Language
s
ERR% Recognitio
n Rate%
Minimu m DCF Value
English English 4.55 95.45 0.0823
Hindi 6.82 93.18 0.0991
Local 9.09 90.81 0.1195
Hindi Hindi 4.55 95.45 0.0925
English 6.82 93.18 0.0968
Local 6.82 93.18 0.1050
Local Local 4.55 95.45 0.0823
Hindi 6.82 93.18 0.1050
English 11.36 88.64 0.1525
5.
CONCLUSIONS
The initial experiments on the Arunachali Language Speech Database explore the fact that the performance of a GMM-UBM based speaker verification system degrades considerably with change in training and testing language. The phonetic contents of the Local languages are completely different from those of English as well as Hindi as they belong to different linguistic group. However, an interesting observation made during the present work is that the performance variation is not only affected by the phonetic contents of the language but also by the manner in which the language is uttered by the speaker. It has been observed that there is no significant difference in performance when the system is trained with Hindi and tested with Local langue as vice versa. This is because of the fact that in Arunachal Pradesh of North East India, Hindi language is uttered in a manner where tone is very much closed to their local languages.
REFERENCES
[1] Rosenberg, J. Delong, C. Lee, B. Juang, and F. Soong,"The use of cohort normalized scores for speaker recognition," In Proc. ICSLP, pp. 599–602, 1992.
[2] A. Reynolds, "Robust text-independent speaker identification using Gaussian mixture speaker models," Speech Communications, vol. 17, pp. 91-108, 1995. [3] D. A. Reynolds, T. F. Quatieri, and R. B. Dunn, "Speaker
Verification Using Adapted Gaussian Mixture Models," Digital Signal Processing, vol. 10(1–3), pp. 19-41, 2000. [4] B.C. Haris, G. Pradhan, A. Misra, S. Shukla, R. Sinha and
S.R.M Prasanna, “Multi-variability Speech Database for Robust Speaker Recognition”, In Proc. NCC, pp. 1-5, 2011. [5] Arunachal Pradesh, http://en.wikipedia.org/wiki/
Arunachal_Pradesh.
[6] Z. Xiaojia, S. Yang and W. DeLiang, “Robust speaker identification using a CASA front-end”, In Proc. ICASSP-2011, pp.5468-5471, 2011.
[7] N.T. Kleynhans and E. Barnard, “Language dependence in multilingual speaker verification”, in Proc. of the 16th
Annual Symposium of the Pattern Recognition Association of South Africa, Langebaan, South Africa, pp. 117-122, 2005.
[8] NIST 2003 Evaluation plan, http://
www.itl.nist.gov/iad/mig/tests/sre/2003/2003-spkrec-evalplan-v2.2.
[9] D.A Reynolds. “Experimental evaluation of features for robust speaker identification,” IEEE Trans. Speech Audio Process., vol 2(4), pp. 639-43, Oct. 1994.
[10]N. Malayath, H. Hermansky, S. Kajarekar, B. Yegananarayan, “Data–driven temporal filters and alternatives to GMM in speaker verification”, Digital Signal Processing, 55-74,2000.
[11]S.B. Davis and P. Mermelstein, “Comparison of parametric representations for monosyllabic word recognition in continuously spoken sentences”, IEEE Transaction on Acoustics, Speech and Signal Processing, 28(4):357-366,1980.
[12]D. Reynolds, R.Rose, “Robust text-independent speaker identification using Gaussian Mixture Models”, IEEE Trans. Speech Audio Process, vol 3, no.1,pp 72-83, Jan.1995. [13]D. Reynolds, “Gaussian Mixture Models*”, MIT Lincoln
Laboratory,244 wood St. Lexinton, MA 02140,USA. [14]D. A. Reynolds, “An overview of Automatic Speaker
Recognition Technology”, MIT Lincoln Laboratory,244 wood St. Lexinton, MA 02140,USA,IEEE 2002.
[15]B. Frédéric et al, “A Tutorial on Text-Independent Speaker Verification”, EURASIP Journal on Applied Signal Processing 2004:4, PP. 430–451 , Hindawi Publishing Corporation,2004.
[16]A. Shukla and R. Tiwari, “A novel approach of speaker authentication by fusion of speech and image features using Artificial Neural Networks”, Int. J. of Information and Communication Technology 2008-Vol.1,No.2 pp . 159 – 170.
[17]A. Fazel and S. Chakrabartty, “An overview of Statistical Pattern Recognition Techniques for Speaker Verification”, IEEE Circuits and System Magazine, 62-81, 2011.
[18]L. Heck and N. Mirghafori, “On-Line Unsupervised Adaptation in Speaker Verification”, In Proc. ICSLP-2000, vol. 2, pp. 454-457, Beijing, China, 2000.
Utpal Bhattacharjee received his Master of Computer Application (MCA) from Dibrugarh University, India and Ph.D. from Gauhati University, India in the year 1999 and 2008 respectively. Currently he is working as an Associate Professor in the department of Computer Science and Engineering of Rajiv Gandhi University, India. His research interest is in the field of Speech Processing and Robust Speech/Speaker Recognition.