Brazilian Sovereign Markets
Caio Ibsen Rodrigues de Almeida Professor Adjunto, Ibmec Business School,
Rio de Janeiro
Antonio Marcos Duarte Júnior Professor, Ibmec Business School, Rio de Janeiro Cristiano Augusto Coelho Fernandes Professor Assistente, Pontifícia Universidade
Católica do Rio de Janeiro
RESUMO
Os mercados emergentes de renda fixa são alternativas interessantes para investimentos. Devido ao elevado nível de incerteza existente em tais mercados, a mensuração dos riscos de mercado de uma carteira de investimentos é fundamental para que se evite um nível ele-vado de perdas. Uma das medidas de risco de mercado mais utilizadas é o Value at Risk, ba-seado na distribuição de probabilidades de perdas-ganhos da carteira sob análise. A estimação desta distribuição requer, no entanto, a estimação prévia da distribuição de pro-babilidades das variações da estrutura a termo da taxa de juros. Uma possibilidade interes-sante para a estimação de tal distribuição é efetuar uma decomposição da função de spread da estrutura a termo em uma combinação linear de Polinômios de Legendre. Exemplos numéricos do mercado internacional de títulos soberanos brasileiros são apresentados para ilustrar o uso prático desta nova metodologia.
PALAVRAS-CHAVE
mercados emergentes, taxas de juros, gerenciamento de riscos
ABSTRACT
Fixed income emerging markets are an interesting investment alternative. Measuring market risks is mandatory in order to avoid unexpected huge losses. The most used market risk measure is the Value at Risk, based on the profit-loss probability distribution of the portfolio under consideration. Estimating this probability distribution requires the prior estimation of the probability distribution of term structures of interest rates. An interesting possibility is to estimate term structures using a decomposition of the spread function into a linear combi-nation of Legendre polynomials. Numerical examples from the Brazilian sovereign fixed in-come international market illustrate the practical use of the methodology.
KEY WORDS
emerging markets, interest rate, risk management
JEL Classification
INTRODUCTION
Fixed income emerging markets developed quickly during the last decade. Higher international liquidity, the interest of portfolio managers in diversi-fying internationally, and the continuous improvement of risk control by in-ternational rating agencies are three reasons for such a development.
Some of the most liquid instruments traded in fixed income emerging mar-kets are the so-called Brady bonds. (FABOZZI & FRANCO, 1997). They are dollar denominated sovereign instruments, originated from the restruc-turing of defaulted bank loans of countries located in Latin America, Cen-tral and Eastern Europe, Middle East, Africa and Asia.
Pricing and hedging these instruments is not easy due to their usually com-plex cash flows. They may present floating (for instance, depending on the LIBOR rates) or step up interest payments, amortize or capitalize principal before maturity, contain embedded options, as well as offer collateralized principal and/or interest payments.
Other fixed income instruments in the emerging debt market include bank loans, local issues, and eurobonds. Eurobonds are bonds issued in a foreign currency, in a foreign country. Interest on them has been growing steadily due to the improving credit rating of certain emerging markets, with special attention directed, more recently, to Global bonds, which are eurobonds is-sued simultaneously in several countries.
Vasicek and Fong (1982) suggest estimating the U.S term structure of in-terest rates applying a regression model based on exponential splines. Litter-man and ScheinkLitter-man (1991) verifies, using Principal Component Analysis (PCA; MARDIA et al., 1992), that more than 90% of the U.S term struc-ture of interest rates movements were explained by just three orthogonal factors. Several applications were proposed in the finance literature follow-ing that. For instance, Sfollow-ingh (1997) uses PCA to estimate the market risk of fixed income instruments in the US market. Barber and Copper (1996) propose an immunization strategy also based in PCA to generate optimal hedges.
Almeida et al. (1998) suggests a modeling approach for term structures of interest rates in emerging markets. The model is based on a decomposition of the term structure in a risk free benchmark curve plus a spread function representing the sovereign credit risk spread. This spread function, on its turn, is decomposed into a linear combination of Legendre polynomials. (LEBEDEV, 1972). An extension to this model, which considers the rela-tive credit risk among the assets included in the estimation process, is possi-ble. (ALMEIDA et al., 2000). In this extension, the relative credit risk is captured by considering the rating of each asset in the evaluation of the credit spread function. This enhanced methodology provides more accurate estimates of term structures, at the expense of more computational com-plexity. Since our interest in this article is to consider market risk measure-ment, instead of credit risk measuremeasure-ment, it is not crucial to adopt the approach suggested in Almeida et. al. (2000). If the reader is considering es-timating the credit risk exposure of portfolios (alone or together with the market risk exposure), adopting the approach suggested in Almeida et. al. (2000) becomes necessary.
fixed income market are presented. These examples illustrate the VaR esti-mation of a portfolio composed by Brazilian Brady and Global bonds. The article is organized as follows. Section 1 presents the model for the esti-mation of term structures of interest rates in emerging markets, and the methodology used in our examples. Section 2 presents the numerical exam-ples. Last section concludes the article.
1. TERM STRUCTURE OF INTEREST RATES IN EMERGING MAR-KETS
1.1 Definition
The term structure of interest rates in a fixed income emerging market can be modeled as:
(1) where t denotes time, B(t) is a benchmark curve (for instance, the U.S. term
structure of interest rates), Pn is the Legendre polynomial of degree n
(LEB-EDEV, 1972), cn is a parameter, and λ is the longest maturity of a bond in
the emerging market under consideration.
The price of a bond (p) relates to the term structure by:
(2) where Ct denotes the cash flow paid by the bond on time ti, and nA denotes
the total number of cash flows paid by the bond.
The Legendre polynomial of degree n is defined (in the compact set [-1, 1])
according to the following expression:
. (3)
The first four Legendre polynomials are:
]. , 0 [ , ) 1 2 ( ) ( ) ( 0 ℓ
ℓ − ∀ ∈
+ =
∑
≥ t t P c t B t R n n n λ λ∑
= − = A n i i i i tR tC p 1 )) ( exp( P x n d
dx x n
n n n n n ( ) ! (( ) ) , , , ...
= 1 − ∀ =
2 1 0 1 2
(4)
Their graphs are depicted in Figure 1. The first Legendre polynomial will be related to parallel shifts in the term structure, the second Legendre polyno-mial will be related to changes in slope of the term structure, the third Leg-endre polynomial will be related to changes in curvature of the term structure, and the fourth Legendre polynomial will be related to double changes in curvature of the term structure.
FIGURE 1 - FOUR LEGENDRE POLYNOMIALS
P x
P x x
P x x
P x x x
0
1
2
2
3
3
1
1
2 3 1
1
2 3
( )
( )
( ) ( )
( ) (5 ).
= =
= −
= −
-1 -0.8 -0.6 -0.4 -0.2 0 0.2 0.4 0.6 0.8 1 0
0.2 0.4 0.6 0.8 1 1.2 1.4 1.6 1.8 2
x
P(
x
)
-1 -0.8 -0.6 -0.4 -0.2 0 0.2 0.4 0.6 0.8 1 -1
-0.8 -0.6 -0.4 -0.2 0 0.2 0.4 0.6 0.8 1
Legendre Polynomial of Degree One
P(
x
)
x
-1 -0.8 -0.6 -0.4 -0.2 0 0.2 0.4 0.6 0.8 1 -0.5
0 0.5 1
x
P(
x
)
Legendre Polynomial of Degree Two
-1 -0.8 -0.6 -0.4 -0.2 0 0.2 0.4 0.6 0.8 1 -1
-0.8 -0.6 -0.4 -0.2 0 0.2 0.4 0.6 0.8 1
Legendre Polynomial of Degree Three
P(
x
)
1.2 Estimation
The first step required is to estimate the coefficients in Equa-tion .
We define the discount function as:
(5) We assume that mbonds are available in a particular instant of time for the
estimation process. The estimation of the coefficients is ac-complished by the use of a non-linear regression equation given by:
(6)
where denotes the price of the jth bond, aj denotes the accrued interest of
the jth bond, and are dummy variables indicating the existence of
embedded put and call options in the bond, op and oc are unknown
parame-ters related to the prices of the embedded put and call options, fj denotes
the number of remaining cash flows of the jth bond, and tjlthe time
remain-ing for payment of the lth cash flow ujl of the jth bond; ej is the random
dis-turbance, with , , .
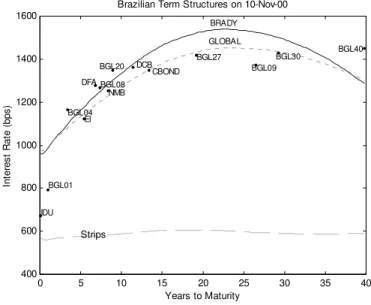
Table 1 presents the characteristics of fourteen Brazilian bonds (Brady and Global) used in the numerical examples. Figure 2 depicts two term struc-tures of interest rates estimated using the model just described: one term structure for Brady bonds, and the other term structure for Global bonds.
..., , , , 1 2
0 c c
c ]. , 0 [ , )
( = − () ∀ ∈ ℓ
t e
t
D Rt t λ
..., , , , 1 2
0 c c
c , ,..., 2 , 1 , ) ( 1 1 1 m j e t D u o o a p j f l jl jl c call j p put j j j j = ∀ + = − + +
∑
= pj1putj 1callj
( )
j 0E e =
( )
2 2j j
TABLE 1 - BRAZILIAN BONDS USED IN THE ESTIMATION PROCESS
FIGURE 2 - A JOINT ESTIMATION OF TERM STRUCTURES OF BRADY AND GLOBAL MARKETS
Bond Type Coupon (%) Duration (Years) Maturity
CBOND Brady 8.000 5.42 15-Apr-2014
DCB Brady 7.440 5.13 15-Apr-2012
DFA Brady 7.760 2.95 15-Sep-2007
EI Brady 7.380 2.49 15-Apr-2006
IDU Brady 7.840 0.13 01-Jan-2001
NMB Brady 7.440 3.39 15-Apr-2009
GLB01 Global 8.875 0.95 05-Nov-2001
GLB04 Global 11.63 2.89 15-Apr-2004
GLB08 Global 9.380 5.25 07-Apr-2008
GLB09 Global 14.50 5.29 15-Oct-2009
GLB20 Global 12.75 6.59 15-Jan-2020
GLB27 Global 10.13 7.03 15-May-2027
GLB30 Global 12.25 7.01 06-Mar-2030
GLB40 Global 11.000 6.91 17-Aug-2040
0 5 10 15 20 25 30 35 40
400 600 800 1000 1200 1400 1600
Strips
Years to Maturity
In
te
re
st R
a
te
(
b
p
s
)
Brazilian Term Structures on 10-Nov-00
CBOND DCB DFA
EI
IDU
NMB
BGL01 BGL04
BGL08
BGL09 BGL20
BGL27 BGL30 BGL40 BRADY
1.3 Joint Estimation of Term Structures of Interest Rates of the Brady and Global Bonds Market
As an example of the methodology just described, let us suppose that we are interested in estimating the Brazilian Brady and Global bonds term struc-tures of interest rates. These two types of assets may present, during certain periods of time, substantially different levels of credit risk. Thus, estimating a unique term structure of interest rates to represent both markets may “dis-tort” results. On the other hand, estimating separately one curve for each market may present statistical difficulties in the cases where the number of liquid assets belonging to one of these markets is small. In order to avoid these drawbacks, we apply the methodology presented in Almeida et al.
(2000), which captures the difference in risk between different levels of credit risk using different credit spread functions. The result is a joint esti-mation procedure that estimates simultaneously the two term structures. Consider the existence of two levels of credit risk represented by , where the first is related to the Global bonds market, and the second to the Brady bonds market. The methodology proposes an extension to Equation (1) to capture different levels of credit risk considering the spread function depending explicitly on these levels:
(8) The spread function is still modeled as a linear combination of Legendre polynomials. The model is completely specified when the dependence on different levels of credit risk is defined. For instance, it is possible to capture the difference in credit risk using just the translation factor (Legendre poly-nomial of degree zero). A consequence from such a specification is:
a) The term structures of interest rates estimated simultaneously using the model differ only by parallel shifts.
Or, equivalently:
B G r
r ,
]. , 0 [ ), , , ( ) ( ) , ,
(t r r = B t +C t r r ∀t∈ ℓ
b) When comparing all maturities of these term structures, the volatilities of the interest rates spreads differ only by a constant value.
For the first numerical example presented in this article we used a more gen-eral model. It allows the interest rates spreads of one term structure with re-spect to the other to present volatility differing not only by a constant value along the maturities. This flexibility can be achieved by allowing the term structures to possess also different curvatures. Thus, the model captures the difference in credit risk using the Legendre polynomials of degree zero and two (which are responsible, respectively, for parallel shifts and changes in curvature of the term structure of interest rates).
The equations for the term structures of interest rates for the Global and
Brady markets are respectively (letting ):
(9) (10) The coefficients allow the Brady term structure to present a dis-tinct decomposition when compared to the Global term structure, with re-spect to parallel shifts and changes in curvature. In this particular case, the two curves present the same rotation factor with respect to the benchmark curve. Later in this article we shall investigate the use of different rotation factors.
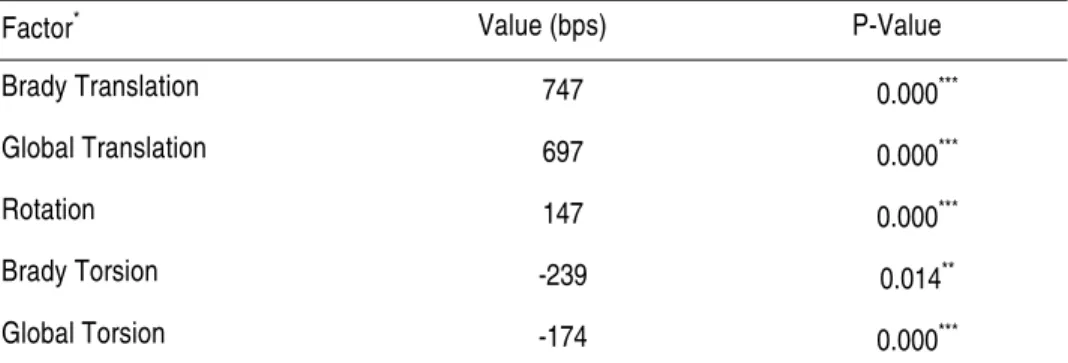
Figure 2 depicts the Brazilian Brady and Global bonds term structures of in-terest rates estimated on November 10, 2000, based on the model just de-scribed, with the U.S strips playing the role of the benchmark curve. Values for the first three orthogonal factors for each curve, with their p-values, are given in Table 2.
] , 0 [ , 1 2 ~ ℓ
ℓ − ∀ ∈
= t t
t λ λ . ) ~ ( ) ( ) ( 0 t P c t B t R n n G n G
∑
≥ + = ( ) (~) (~) ( ) (~) (~). ) ( ) ( 3 2 2 2 1 1 0 00 c P t c P t c c P t c P t
c t B t R n n G n B G G B G B ∑ ≥ + + + + + + = B B c
TABLE 2 - ORTHOGONAL FACTORS FOR TWO BRAZILIAN TERM STRUCTURES
*The first three Legendre polynomials correspond respectively to the translation, rotation
and torsion factors.
**Statistically significant at a 5% confidence level.
***Statistically significant at a 1% confidence level.
2. ESTIMATING THE VALUE AT RISK OF TWO BRAZILIAN FIXED INCOME PORTFOLIOS
Suppose we wanted to estimate the Value at Risk of two portfolios on No-vember 10, 2000, using the model just described.
Portfolio 1 presents the following composition (see also Table 1): a) Long US$ 20 million in CBOND.
b) Long US$ 20 million in DCB. c) Long US$ 10 million in GLB30. d) Short US$ 20 million in EI. e) Short US$ 15 million in IDU. f) Short US$ 15 million in GLB01.
Portfolio 2 is composed by the same bonds and the same amounts as Port-folio 1, but it presents only long positions:
Factor* Value (bps) P-Value
Brady Translation 747 0.000***
Global Translation 697 0.000***
Rotation 147 0.000***
Brady Torsion -239 0.014**
a) Long US$ 20 million in CBOND. b) Long US$ 20 million in DCB. c) Long US$ 10 million in GLB30. d) Long US$ 20 million in EI. e) Long US$ 15 million in IDU. f) Long US$ 15 million in GLB01.
As mentioned before, we need first to estimate the probability distribution of the variations of the term structures. We apply the Historical Simulation approach (JORION, 2001) for estimating the interest risk in these two portfolios.
Obtaining the historical joint probability densities of the variations of the U.S strips term structure, and of all orthogonal factors in Table 2, is a com-puter intensive step. It requires running an optimization procedure for each day in the database to estimate the values of the orthogonal factors and, then, to estimate the historical term structures for Brady Bonds and Global Bonds. After obtaining the distributions for the orthogonal factors and for the U.S Strips, we can obtain the Brady and Global bonds term structures scenarios required by the Historical Simulation approach. In the numerical examples two hundred and fifty historical scenarios were generated. For each scenario, the associated term structures were used to price all bonds in the portfolios. At the end, we obtained the historical probability density of bond prices.
Let denote the random variables which represent the returns of the bonds, denote the amounts (in US$) of each bond in the proposed portfolio, and denotes the random variable which mea-sures the profits and losses (in US$) of the portfolio, for . We constructed the probability density of the profits and losses of the port-folio by multiplying the returns of the bonds listed in this portport-folio by the amounts held on them:
m i i} 1,...,
{θ =
m i j i
w( ) 1,...,
}
{ =
th
j Vj
th
j j=1,2.
th
(11)
Finally, based on the probability densities of the random variables
and (obtained by historical simulation) we estimate the VaR of both the proposed portfolios and of each bond used in the estimation pro-cess.
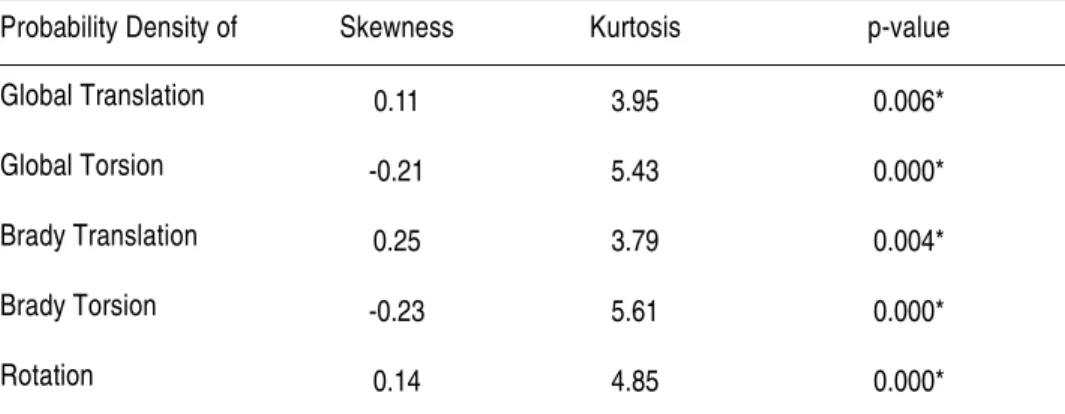
For instance, Figure 3 depicts the marginal probability densities of the re-turns of the translation, rotation and torsion orthogonal factors related to the Brady and Global term structures of interest rates. Note from Table 3 that the five historical distributions in Figure 3 violate the hypothesis of normality. They all present kurtosis greater than three, as well as non-zero skewness.
TABLE 3 - JARQUE BERA NORMALITY TEST FOR THE FACTORS RETURNS
*Reject the hypothesis of normality at a 1% significance level.
Probability Density of Skewness Kurtosis p-value
Global Translation 0.11 3.95 0.006*
Global Torsion -0.21 5.43 0.000*
Brady Translation 0.25 3.79 0.004*
Brady Torsion -0.23 5.61 0.000*
Rotation 0.14 4.85 0.000*
∑
=
=
m i
i j i
j w
V
1 ) ( θ
m i i} 1,...,
{θ =
FIGURE 3 - MARGINAL PROBABILITY DENSITY FUNCTIONS OF THE ORTHOGONAL FACTORS
-6 -4 -2 0 2 4 6 8 0
0.01 0.02 0.03 0.04 0.05 0.06 0.07 0.08
Factor Return (%)
P
roba
bi
lit
y
D
ens
it
y
Estimated Probability Density of Globals Translation Factor Returns
-60 -40 -20 0 20 40 60 0
0.005 0.01 0.015 0.02 0.025 0.03
Factor Return (%)
P
robabi
lit
y
D
e
ns
it
y
-8 -6 -4 -2 0 2 4 6 8 10 12 0 0.01 0.02 0.03 0.04 0.05 0.06 0.07 0.08
Factor Return (%)
P ro b abi lit y D e ns it y
Estimated Probability Density of Bradies Translation Factor Returns
-1500 -100 -50 0 50 100 0.002 0.004 0.006 0.008 0.01 0.012
Factor Return (%)
P rob abi lit y D ens it y
Estimated Probability Density of Bradies Torsion Factor Returns
-1500 -100 -50 0 50 100 150 0.002 0.004 0.006 0.008 0.01 0.012 0.014 0.016 0.018 0.02 P ro bab il it y D e ns it y
Figure 4 and Figure 5 present, respectively, the probability densities of the returns of Portfolio 1 and Portfolio 2. Note that both are skewed to the left and present fat left-tail, meaning that there is a greater probability of loos-ing extreme values than earnloos-ing extreme values. For the reasons detailed in Duarte (1997), the Analytical Approach (JORION, 2001) is not recom-mended to compute the VaR of these two portfolios.
FIGURE 4 - ESTIMATED PROBABILITY DENSITY FUNCTION OF THE RETURNS OF PORTFOLIO 1
FIGURE 5 - ESTIMATED PROBABILITY DENSITY FUNCTION OF THE RETURNS OF PORTFOLIO 2
-5 -4 -3 -2 -1 0 1 2 0
0.05 0.1 0.15 0.2 0.25 0.3
Return (%)
P
ro
b
a
b
ili
ty
D
e
n
s
it
y
Estimated Probability Density of The Portfolio Returns
-8 -6 -4 -2 0 2 4 6 0
0.05 0.1 0.15 0.2 0.25 0.3 0.35 0.4
Return (%)
P
ro
bab
ili
ty
D
e
ns
it
y
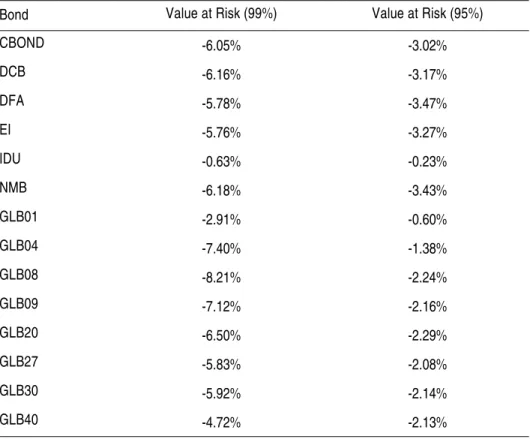
Table 4 presents the Value at Risk for each bond used in the estimation pro-cess, for two distinct confidence levels: 99% and 95%. Similarly, Table 5 presents the Value at Risk for the proposed portfolios for 99% and 95% confidence levels. Table 6 shows the price correlation matrix for the bonds used in the estimation process.
TABLE 4 - ESTIMATED VALUE AT RISK FOR GLOBAL AND BRADY BONDS
TABLE 5 - PORTFOLIOS ESTIMATED VALUE AT RISK BASED ON HISTORICAL SIMULATION
Bond Value at Risk (99%) Value at Risk (95%)
CBOND -6.05% -3.02%
DCB -6.16% -3.17%
DFA -5.78% -3.47%
EI -5.76% -3.27%
IDU -0.63% -0.23%
NMB -6.18% -3.43%
GLB01 -2.91% -0.60%
GLB04 -7.40% -1.38%
GLB08 -8.21% -2.24%
GLB09 -7.12% -2.16%
GLB20 -6.50% -2.29%
GLB27 -5.83% -2.08%
GLB30 -5.92% -2.14%
GLB40 -4.72% -2.13%
Portfolio Value at Risk (99%) Value at Risk (95%)
1 US$ -1,880,000 US$ -770,000
Interes
t Ra
te Risk
M
eas
uremen
t in Brazilia
n Soverei
gn Markets
con.,
Sã
o P
au
lo, 34(2):
321-34
4, abr-ju
n 2004
CBOND DCB DFA EI IDU NMB GLB01 GLB04 GLB08 GLB09 GLB20 GLB27 GLB30 GLB40
For the sake of illustration, we present two other models to decompose the spread of the Brady over the Global term structure. Table 7 presents the combinations of factors for each analyzed model. Model 1 corresponds to the model where the difference in risk is captured using only the translation factor. Model 2 captures the difference in credit risk using the translation and rotation factors. Finally, Model 3 represents the model used so far in this article (which is included here only for comparative purposes).
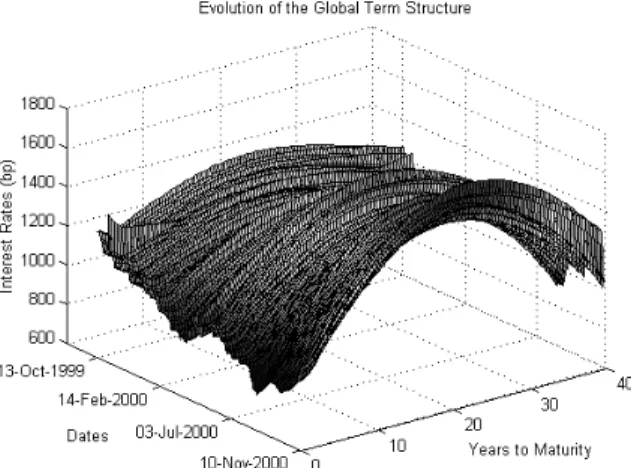
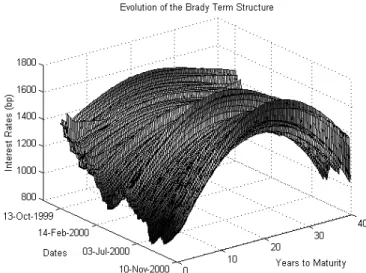
We provide in Figure 6 and Figure 7 the historical evolution of Brazilian Brady and Global term structures during one year of analysis, for Model 1 and Model 2, respectively.
TABLE 7 - ESTIMATING VAR USING DIFFERENT COMBINATIONS OF FACTORS
FIGURE 6 - HISTORICAL BRAZILIAN TERM STRUCTURES FOR MODEL 1
Model Translation Rotation Torsion
1 X
2 X X
Observing these graphs, we are capable of capturing which are the most im-portant factors responsible for interest rate risk. For instance, Figure 6 and Figure 7 reveals that the Brady rotation factor is more volatile in Model 2 than in the others. This fact is in accordance with the specification of the model, which uses an extra free variable related to the rotation factor to de-scribe the spread of the Brady over the Global term structure. Observing now the Global term structures, Figure 6 reveals that the rotation and tor-sion factors become more important as risk factors for more recent observa-tions of the time series for Model 1. On the other hand, Figure 7 indicates that the Global term structure suffers significant changes in its curvature since the beginning of the time series for Model 2. These pictures represent an interesting tool for identification of the regions where the scenarios for the evolution of the term structures might produce the most extreme move-ments.
Table 8 presents the estimated VaR for Portfolios 1 and 2 for the three mod-els. It generalizes what was observed in Table 5 for Model 3: Portfolio 2 presents higher risk than Portfolio 1, for all models, for both the 99% and 95% confidence levels.
model generates the higher risk, among all models, for a fixed confidence level, it does not mean that this model generates the highest risk for another fixed confidence level. Observe also that the difference in estimated risk exis-tent comparing the models can be very large. For instance, if we compare the VaR for Portfolio 2, at a 99% confidence level, estimated by Models 1 and 3, we identify a difference of 30% (US$ -5,230,000 and US$ – 3,680,000).
These remarks indicate the importance of observing the risk for different confidence levels, and also using models presenting different sources of risk to better capture the magnitude of possible losses, avoiding mathematical modeling risk when measuring market risk. The effective control of mathe-matical modeling risk can be quite a difficult task, as illustrated in Duarte (1997) when estimating the VaR of portfolios in the Brazilian options mar-kets. We must say that managing mathematical modeling risk requires not only technical skills from the user, but also experience with the market risk management of fixed income portfolios of sovereign bonds issued in emerg-ing markets.
TABLE 8 - ESTIMATED VALUE AT RISK BASED ON HISTORICAL SIMULATION
PORTFOLIO 1
PORTFOLIO 2
Model Value at Risk (99%) Value at Risk (95%)
1 US$ -1,800,000 US$ -880,000
2 US$ -2,680,000 US$ -1,870,000
3 US$ -1,880,000 US$ -770,000
Model Value at Risk (99%) Value at Risk (95%)
1 US$ -5,230,000 US$ -1,760,000
2 US$ -4,960,000 US$ -2,600,000
CONCLUSION
We propose a methodology for estimating the Value at Risk of portfolios in fixed income emerging markets. It exploits the dynamics of the orthogonal factors, obtained by the decomposition of the credit spread function into a linear combination of Legendre polynomials.
This methodology produces a probability density function for the term structures of interest rates. It is possible to show that the use of the model described in Section 1.3 (to estimate the historical evolution of the whole term structures of emerging markets) generates a dynamic equivalent to the one obtained by using Principal Component Analysis in a market presenting an observable term structure. In other words, the methodology proposes the application of Principal Component Analysis in markets presenting non-observable term structures, which is the case of fixed income emerging mar-kets. This fact allows us to use this methodology for, at least, all fixed in-come applications that may apply Principal Component Analysis, which is the case of risk analysis, portfolio allocation, immunization techniques etc. Although the portfolios presented in the numerical examples were com-posed by only Brazilian fixed income instruments, the methodology can be easily extended to other financial markets (such as the U.S. corporate bond market).
REFERENCES
ALMEIDA, C. I. R.; DUARTE JÚNIOR; A. M.; FERNANDES; C. A. C. Decomposing and simulating the movements of term structures
of interest rates in emerging eurobonds markets. Journal of Fixed
In-come, 8, p. 21-31, 1998.
_______. Credit spread arbitrage in emerging eurobond markets. Journal of
Fixed Income, 10, p. 100-111, 2000.
BARBER, J. R.; COPPER, M. L. Immunization using principal
compo-nent analysis. Journal of Portfolio Management, 22, p. 99-105, 1996.
DUARTE JÚNIOR, A. M. Model risk and risk management. Derivatives
FABOZZI, F. J.; FRANCO, A. Handbook of emerging fixed income & cur-rency markets. New Hope: FJF Associates, 1997.
JORION, P. Value at risk: the new benchmark for managing financial risk.
New York: McGraw-Hill, 2001.
LEBEDEV, N. N. Special functions and their applications. New York:
Do-ver Publications, 1972.
LITTERMAN, R.; SCHEINKMAN, J. A. Common factors affecting
bond returns. Journal of Fixed Income, 1, p. 54-61, 1991.
MARDIA,K. V.; KENT, J. T.; BIBBY, J. M. Multivariate analysis. New
York: Academic Press, 1992.
SINGH, M. K. Value-at-risk using principal components analysis. Journal
of Portfolio Management, 24, p. 101-112, 1997.
VASICEK, O. A.; FONG, H. G. Term structure modeling using exponen-tial splines. Journal of Finance, 37, p. 339-348, 1982.
E-mail: [email protected].
Enviar toda correspondência para: Ibmec Business School; Rua Rio Branco, 108 / 5 andar; 20040-001, Rio de Janeiro, RJ, Brasil. Email: [email protected].
E-mail: [email protected]