Article
J. Braz. Chem. Soc., Vol. 24, No. 12, 2008-2014, 2013. Printed in Brazil - ©2013 Sociedade Brasileira de Química 0103 - 5053 $6.00+0.00
A
*e-mail: [email protected]
Simulation of the Equilibrium Constant Effect on the Kinetics and Average
Properties of Polystyrene Obtained by ATRP
Roniérik P. Vieira,a Andréia Ossig,b Janaína M. Perez,b ViníciusG. Grassi,b
Cesar L. Petzhold,b Augusto Peres,c João M. Costac and Liliane M. F. Lona*,a
aSchool of Chemical Engineering, University of Campinas, 13083-852 Campinas-SP, Brazil
bChemistry Institute, Federal University of Rio Grande do Sul, 91501-970 Porto Alegre-RS, Brazil
cCenter for Research and Development, PETROBRAS, 21941-915 Rio de Janeiro-RJ, Brazil
Este artigo utiliza simulações para estudar o processo de polimerização radicalar via transferência de átomo por meio da análise do comportamento das espécies químicas (polímeros “vivos”, “dormentes” e “mortos”). Para isso, um modelo matemático foi desenvolvido usando o método dos momentos, e os dados experimentais da polimerização de estireno, obtidos da literatura, foram utilizados para validá-lo. A partir disto, foram obtidos perfis de concentração destas espécies, que foram posteriormente usados para obter as propriedades médias dos polímeros (Mn e IPD). As
propriedades foram avaliadas em diferentes valores da costante deequilíbrio (Keq) e verificou-se
que os valores na ordem de 10-7 e 10-9 proporcionam o melhor controle na estrutura dos polímeros.
Esta pesquisa é, por isto, um ponto de partida para a escolha ideal do sistema catalítico, ligantes e iniciadores. Além disso, a técnica de modelagem apresentou-se como uma ferramenta de fácil implementação e bastante eficiente na análise do processo ATRP.
This article uses simulations to study the atom transfer radical polymerization by analyzing the behavior of the chemical species (“living”, “dormant” and “dead” polymers). For this, a mathematical model has been developed using the method of moments, and experimental data from styrene polymerization, obtained from literature, were used to validate the model. From this point, the concentration profiles of all species were obtained, and later on, they were used to obtain the average properties of polymers (Mn and PDI). The properties were evaluated at different
values of equilibrium constant (Keq) and it was found that values around 10
-7 and 10-9 provide a
better control in the structure of polymers. Therefore, this study is a starting point for selecting the optimal catalytic system, binders and initiators. In addition, the modeling technique presented as a useful tool, being very effective on the analysis of ATRP processes.
Keywords: ATRP, equilibrium constant, controlled polymerization, kinetic simulation
Introduction
In recent years the interest on synthesize macromolecules with precisely controlled sizes and functionality has increased significantly, due to the applicability of these materials as microelectronics (all computers and mobile phones), textiles, food packaging, paints, health and beauty products, controlled drugs delivery and other biomedical materials.
A variety of these materials occurs due to structural characteristics, such as blocks copolymers, stars, telechelics, and (hyper) branched polymers. They can
be synthesized using methods such as atom transfer
radical polymerization (ATRP),1 nitroxide-mediated
polymerization (NMP),2 and reversible
addition-fragmentation chain transfer (RAFT) polymerization.3
The most powerful controlled polymerization technique is the atom transfer radical polymerization (ATRP), developed by Wang and Matyjaszewski, because it can be conducted efficiently at low temperatures and for various
monomers.1
the results from the simulations, engineers and scientists achieve the understanding and intuition required for further innovation. Once a process is well understood, modeling and simulations are used to optimize and control the process variables and parameters. These “virtual experiments” are run to adapt the process to different operating conditions.
Since the emergence of the ATRP process, few
researches on process modeling were developed.4-14 For
example, Zhu developed a mathematical model for the
ATRP kinetics using the method of moments.8 Butte et al.
compared the kinetic models of MNP and ATRP for styrene
polymerization.11 Zhang and Ray proposed a mathematical
model for controlled radical polymerization in stirred tank reactors, which provides a tool for process development in
design issues.13
All these works reported above give us a set of tools that provide a preliminary analysis of the process with respect to the average properties of polymers, such as the average molecular weights and polydispersity indexes. However, only an analysis considering the concentration profiles of each chemical species provides a detailed understanding of the manner in which the polymerization occurs. Once the kinetics and also the concentrations of the species involved play an important role in the control of polymerization, a perfect understanding of these topics becomes indispensable.
The objective of this paper is to examine the effect of
the equilibrium constant (Keq) on the concentration profiles
of all species involved (monomer, “living”, “dead” and “dormant” polymers) through simulations of ATRP and to observe how it affects the polymerization kinetics and the control of the system.
Unlike other studies in the literature, the key contribution of this research is to give detailed information of all species of polymer chains under three equilibrium constants to help readers understand the mechanism of ATRP and choose the best catalytic system (if they already know equilibrium constants of catalytic system).
Methodology
The mathematical model has been developed considering the reaction mechanism with the steps: initiation, propagation, chain transfer and termination. The
mechanism is expressed by Equation 1 to 7.15
Initiation:
(1)
(2)
Propagation:
(3)
(4)
Chain transfer:
(5)
Termination by combination:
(6)
Termination by disproportionation:
(7)
In the above equations, RX represents the initiator, C is
the catalyst, XC is the catalyst in the oxidized state, M is
the monomer, PnX is the dormant polymer, Pn• is the living
polymer, Pn is the dead polymer.
A population balance was developed for each species involved in the process (monomer, “living”, “dormant” and “dead” polymers), considering an isothermal batch reactor as system. After that, the method of moments (Equation 8 to 10) was used to obtain the profiles of
populations.16 This method was chosen because it can be
used to predict the average properties of polymers with branched and linear chains, being more versatile than instantaneous method, that can be used only for polymers
with linear chains.13 Usually the method of moments
generates a system of equations with high stiffness, and in this work the Adams-Moulton method was used to solve the system of equations. Table 1 provides the physical meanings of population moments of order “zero”.
(8)
(9)
(10)
In these equations, µr represents the moment of order
“r” for the living polymer, λ
r is the moment of order “r”
for the dead polymer, δ
r is the moment of order “r” for
dormant polymer, r is the order (in this case 0, 1 and 2), n is
the length of the polymer chain, [Pn•
] is the living polymer
concentration, [Pn] is the concentration of dead polymer
The material balance for the monomer and the equations of population moments generate a system of ordinary differential equations that was solved numerically through a computer program developed in Fortran and
using the LSODE subroutine.17 This subroutine uses the
Adams-Moulton method to solve initial value problems. This method was chosen because it is very effective to deal with high stiffness in the differential equations system, which is quite common in polymerization engineering problems.
The polymers’ average properties were also calculated (Equation 11 to 14). Experimental data from Fu’s research
and co-workers were used,6 in order to obtain a model
validation.
Number average molecular weight:
(11)
Weight average molecular weight:
(12)
Polydispersity index:
(13)
Monomer conversion:
(14)
In order to validate the model, a styrene bulk polymerization at 110 °C was considered, using
[M]0 = 15 mol L
-1, methyl-2-bromopropionate as
initiator and bromide copper (I) with N,N,N’,N’’,N’’-pentamethyldiethylenetriamine (PMDETA) as catalyst
system, in a ratio of 50:1:1:1 among them.6 The set
of kinetic rate constants considered in this work are summarized in Table 2.
Results and Discussion
Validation of the model with experimental data from literature
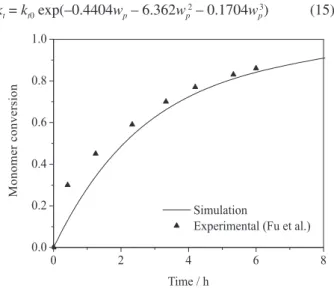
As viscosity of the system increase during polymerization, a gel effect correlation (Equation 15), proposed by Zhang and Ray, was considered in this work.
In Equation (15), kt0 is the kinetic rate constant at zero
conversion, and it is assumed that the termination rate
constant, kt, varies with the weight fraction polymer (wp).13
kt = kt0 exp(–0.4404wp – 6.362wp
2 – 0.1704w
p
3) (15)
Figure 1 shows a good agreement between experimental data and simulation results for the monomer conversion versus time. It can be observed that the model fits better the experimental data for higher conversions value and presents a slight deviation at low conversions, when the rate of polymerization is faster.
Fu et al. studied ATRP system characterized by very low solubility limits and experimental data on these limits
are provided with solvent.6 However, the model presented
Table 1. Physical meanings of population moments of order “zero”16
Moment Physical meaning
µ0 Total concentration of living polymers ( ).
λ0 Total concentration of dead polymers ( ).
δ0 Total concentration of dormant polymers ( ).
Table 2. Kinetic rate constant for simulation of styrene ATRP at 110 ºC obtained from Fu et al.6
Kinetic rate constant Value / (L mol-1 s-1)
kp 1571
ka 1.1
kda 1.1 × 10⁷
kt0 3.132 × 10⁸
ktc 0.99kt
ktd 0.01kt
ktr 0.22
in this work neglects these solubility limits for the ATRP catalyst in both its activated and deactivated forms. Due to these solubility limits, the polymerization rate and the effect of reaction conditions on the ATRP process will change for sure.
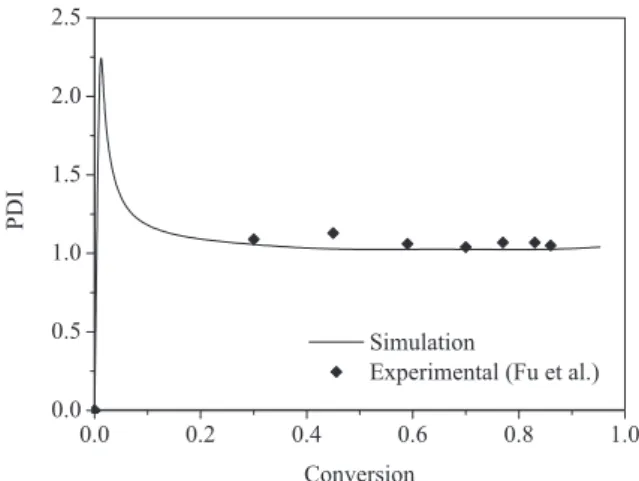
Neglecting these limits was a simplification made intentionally, once this study aims to investigate the behavior of chemical species in a bulk polymerization and not in a solution polymerization, as in the research of Fu and co-workers. Nevertheless, experimental data show a very good agreement with the simulation for the evolution of molecular weight and PDI, as shown in Figure 2 and Figure 3, respectively.
Figure 2 shows that the number average molecular weight evolves linearly as the monomer conversion is increased. This is in agreement with a typical living
polymerization.18,19 In ATRP polymerization nearly all
propagating chains have the same lifetime, starting at essentially the same time and growing with negligible occurrence of chain-breaking reactions until high
conversion of monomer is reached.20 Nevertheless, at high
conversion, the polymerization rate decreases significantly, such that normal termination is not sufficiently suppressed, showing characteristics of a conventional free radical polymerization, i.e., the chain-breaking reactions become high enough to promote a slight deviation from linearity in the evolution of molecular weight, especially in higher
order kinetics.19
Once the mathematical model takes into account the termination and chain transfer in its mechanism, the slight deviation from linearity at high conversions (above 50%) can be attributed to that. Nevertheless, it is important to note that this deviation is very small, confirming the expected for a typical controlled polymerization.
Figure 3 shows that the ATRP process can maintain a good control of the polydispersity index (PDI lower than 1.5). The model fits the experimental data, so that it may be a good approximation to represent the system. The mathematical model considers a generic mechanism to represent any ATRP process and the computational program was developed in a generic way, being possible to use it for different kinds of monomer, initiators, binders and catalysts. Thus, this model can be used to represent any ATRP process since all parameters are known. Moreover, one can use the model to estimate parameters (kinetic constants, for example) for a specific system and promote the optimization and process scale up.
Influence of Keq in the concentration profiles of reaction
components
For a detailed understanding of the ATRP process, an analysis of concentration profiles of all components involved is necessary. The equilibrium constant of the ATRP process refers to the ratio between the kinetic constant of activation and deactivation of the catalytic species. Figure 4 discusses the equilibrium constant’s influence on the profile of “living” polymers.
Figure 2. Comparison of experimental data from Fu et al.6 and the simulation of this work for the average molecular weight development versus conversion.
Figure 4. Influence of Keq on the living polymer concentration.
From Figure 4, it is clear that the living polymers concentration had a sharp increase in the first minutes of reaction. This happens in other controlled polymerization,
like nitroxide mediated radical polymerization.2 In the first
minutes of reaction, the generation of free radicals, due to the dissociation of initiator, is faster than the step in which the controller traps the chain, making the concentration of radicals increase rapidly. After a while, more chains become dormant, reducing the radical concentration. After two hours, there was a significant reduction in radical concentration. This is in agreement with a typical living polymerization in which all living polymer chains are maintained in a reduced
concentration due to the addition of dormant species.20
It is noteworthy that, in a typical ATRP process, the
equilibrium constant is around 10-7. One can obtain other
results by varying this experimental conditions,21 however,
if the equilibrium constant is higher than 10-7 (like 10-5, in
Figure 4) the polidispersity become bigger than 1.5 (see
Figure 9); and if the equilibrium constant is lower than 10-7
(like 10-9, in Figure 4), the rate of polymerization become
very slow (see Figure 7). Figure 5 expresses the influence
of Keq in the dormant polymer.
From Figure 5, we can see a drastic change in the concentration of dormant polymer during the process when the equilibrium constants are changed. Firstly, in
a typical ATRP (Keq = 10-7 and 10-9), the concentration of
dormant polymer shows a slight decrease. This fact suggests that the control provided by the addition of dormant species is occurring effectively. Moreover, by increasing the equilibrium constant, the concentration of dormant
species reduces drastically (see larger ratio Keq = 10
-5). In
addition, from Figure 5, one can get a sense of the polymer functionality at any moment of the reaction, what means that the concentration of functional polymers can be obtained. Several works address the terminal functionality
using the ATRP process.22,23
Figure 6 expresses the influence of Keq in the dead
polymer concentration. The literature discuss that in a successful ATRP, the dead polymer concentration during
the process is negligible.24 It is quite evident for the
Keq = 10-7 and 10-9 (see Figure 6). In this case, the dead
polymer concentration does not reach 2 × 10⁻³ mol L-1,
confirming what is expected in theory. Unlike this, when equilibrium constant increases, the dead chains concentration tends to increase significantly, approaching a conventional radical polymerization process.
It is interesting to noted that, in Figure 4, for Keq = 10
-7
and Keq = 10-5, the radical concentration profiles are almost
the same for both cases, however a lot of radicals become
dead polymers when Keq = 10-5 (see Figure 6), differently
from the case when Keq = 10
-9, in which a reduction of
radical concentration due to termination is very slow (tending to zero).
This results in only a small percentage of chains undergoing irreversible radical-radical termination that removes the functionality from the chain ends. However, this small amount of termination leads to a buildup of excess deactivator. Thus, favoring deactivation further over radical-radical termination and thereby enhancing control. This scenario is termed the persistent radical effect and has
been shown by Fischer25,26 and ourselves,19 to be operating
in both ATRP and NMP.
Figure 7 deals with the influence of Keq on the monomer
conversion. An initial examination of Figure 7 shows that as the equilibrium constant increases there is also an increase in the monomer conversion versus time. Thus, it is confirmed that the polymerization rate tends to be lower in controlled radical polymerization. For a low equilibrium constant (Keq = 10
-9), it is apparent a drastic reduction in the rate of
polymerization, causing the total monomer conversion lasts hours. Figure 8 compares the average molecular weights
obtained in different numerical values of Keq.
Figure 5. Influence of Keq on the dormant polymer concentration.
Analyzing Figure 8, we see that as equilibrium constant is increased, there is a slight increase in the number average
molecular weight (Keq = 10
-5; Mn = 9500 in 2 hours of
reaction). Unlike to this, in low equilibrium constant, the polymers obtained will have low molecular weight
(Keq = 10-9; Mn = 3700 in 2 hours of reaction). Figure 9
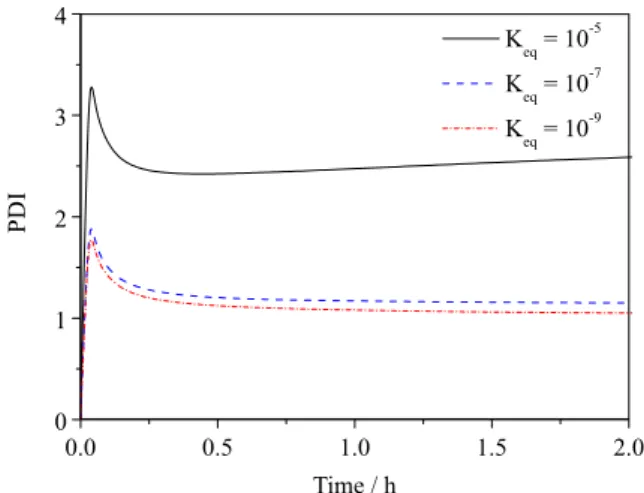
expresses the influence of Keq on the polydispersity index.
According to Figure 9, it can be seen that the polydispersity indexes tend to unity for the values of
Keq = 10-9 and Keq= 10-7. Comparing these two values, it
can be seen that the lower equilibrium rate constant gives
lower values of PDI, being the control more effective as
described by Fischer.25 In contrast, for high equilibrium
constant values (Keq = 10-5) the PDI values deviate from
the unit in a progressive manner.
The difference on the PDI when considering Keq = 10-7
and Keq = 10
-9 is very small, however the polymerization rate
is very fast when Keq =10-7 is considered (see Figure 7). All
simulation profiles have to be analyzed together in order to
choice the ideal Keq. This analysis is summarized in Table 3.
From the analysis of Table 3, it is evident that the
equilibrium constant around 10-7 is more suitable for ATRP
process, since it provides higher values of molecular weight and low polydispersity index. Also, the total conversion of monomer is achieved in less curing time (65 % in two hours of polymerization, according to Figure 7). This account for the majority of the researches available in the literature
that adopt for catalytic systems values of Keq in this order
of magnitude. Nevertheless, many studies in the literature address the applicability of other values of equilibrium constant to obtain a specific material characteristic.
For example, Schroender et al. estimated Keq for
different catalyst systems.21 The values for this constant
ranged from 10-9 to 10-5. Thus, this work can be a good
reference for selecting the catalyst system to obtain a Figure 8. Influence of Keq on the molecular weight development as a
function of time.
Figure 7. Influence of Keq on the monomer conversion.
Figure 9. Influence of Keq on the polydispersity index as a function of time.
Table 3. Summary of result analysis
Variable Keq = 10-9 K
eq = 10-7 Keq = 10-5
[Pliving] Very low Low Low
[PnX] Keep constant Decreases a little Decreases very much
[Pdead] Very low Low Increases very much
Conversion Slow Fast Too fast
Mn Very low Increases Increases
material with specific characteristics. The materials of low molecular weight and PDI close to unity, for example, are
widely used in biomedical and pharmaceutical field.27,28
Thus, a catalyst system with Keq about 10
-9 would be
appropriate for this synthesis.
On the other hand, several other applications require materials with higher molecular weights and low PDI, for example, specific applications in the automotive industry
and aerospace.29 In this case, a higher value of K
eq is
more appropriate because, in addition to providing these macromolecular characteristics, also influence the velocity and yield of reaction, once a greater amount of material must be produced to meet the high demand. Therefore,
an initial analysis of Keq for the ideal choice of initiator
and catalyst system becomes an indispensable tool for the effective control of the polymerization and the future application of the material.
Conclusion
An analysis of the simulation data of styrene ATRP was carried out in this work using a kinetic mathematical model considering the method of moments. We evaluated the influence of equilibrium constant on the concentration profiles of all species (“living”, “dormant” and “dead” polymer) involved in the process and also the influence on the average properties (Mn and PDI) in the formed polymers. The results suggest that an equilibrium constant
around 10-7and 10-9 would be ideal for a controlled synthesis
using ATRP. Therefore, the analysis proposed in this work becomes a starting point for an optimal choice of catalyst, binder and initiator. Plus provide the readers details of the behavior of chemical species involved in the process, which differentiates it from most of the works that discuss only the average properties. Furthermore, the modeling and simulation technique used in this work can be an easy and comprehensive tool for the analysis and design of chemical reactors, once it is robust and represent different ATRP systems (different monomers, catalyst and initiators), if the parameters are known.
Acknowledgement
The authors thank PETROBRAS for financial support to this research.
References
1. Wang, J. S.; Matyjaszewski, K.; Macromolecules 1995, 28, 7901.
2. Hawker, C. J.; Trends Polym. Sci. 1996, 4, 183.
3. Chiefari, J.; Chong, Y. K. B.; Ercole, F.; Krstina, J.; Jeffery, J.; Le, T. P. T.; Mayadunne, R. T. A.; Meijs, G. F.; Moad, C. L.; Moad, G.; Rizzardo, E.; Thang, S. H.; Macromolecules 1998,
31, 5559.
4. Zhu, S.; Macromol. Theory Simul. 1999, 8, 29.
5. Al-Harthi, M.; Soares, J. B. P.; Simon, L. C.; Macromol. React. Eng. 2007, 1, 468.
6. Fu, Y.; Mirzaei, A.; Cunningham, M. F.; Hutchinson, R. A.;
Macromol. React. Eng. 2007, 1, 425.
7. D’hooge, D. R.; Reyniers, M. F.; Marin, G. B.; Macromol. React. Eng. 2009, 3, 185.
8. Zhu, H. S.; Brash, J. L.; Macromol. React. Eng. 2010, 4, 235. 9. Tobita, H.; Macromol. React. Eng. 2010, 4, 643.
10. Li, B. G.; Zhu, S.; Macromol. React. Eng. 2011, 5, 467. 11. Butté, A.; Storti, G.; Morbidelli, M.; Macromolecules 2000, 33,
3485.
12. Al-Harthi, M.; Soares, J. P. B.; Simon, L. C.; Macromol. Theory Simul. 2006, 15, 198.
13. Zhang, M.; Ray, W. H.; J. Appl. Polym. Sci. 2002, 86, 1630. 14. Tang, W.; Matyjaszewski, K.; Macromol. Theory Simul. 2008,
17, 359.
15. Patten, T. E.; Matyjaszewski, K.; Adv. Mater. 1998, 10, 901. 16. Ray, H.; Macromol. Sci. 1972, 8, 1.
17. Hindmarsh, A. C.; Sci. Computing 1983, 1, 55.
18. Al-Harthi, M.; Cheng, L. S.; Soares, J. B. P.; Simon, L. C.;
J. Polym. Sci. 2007, 45, 2212.
19. Shipp, D. A.; Matyjaszewski, K.; Macromolecules 1999, 32, 2948.
20. Matyjaszewski, K.; Braunecker, W. A.; Prog. Polym. Sci. 2007,
32, 93.
21. Schroeder, H.; Yalalov, D.; Buback, M.; Matyjaszewski, K.;
Macromol. Chem. Phys. 2012, 213, 2019.
22. Lutz, J. F.; Matyjaszewski, K.; Macromol. Chem. Phys. 2002,
203, 1385.
23. Porras, C. T.; D’hooge, D. R.; Reyniers, M. F.; Marin, G. B.;
Macromol. Theory Simul. 2013, 22, 136.
24. Jakubowski, W.; Denizli, B. K.; Gil, R. R.; Matyjaszewski, K.;
Macromol. Chem. Phys. 2008, 209, 32.
25. Fischer, H.; Macromolecules 1997, 30, 5666.
26. Fischer, H.; J. Polym. Sci., Part A: Polym. Chem. 2000, 37, 1885. 27. Destarac, M.; Macromol. React. Eng. 2010, 4, 165.
28. Hartmann, L.; Macromol. Chem. Phys. 2011, 212, 8. 29. Matyjaszewski, K.; Isr. J. Chem. 2012, 52, 206.
Submitted: September 16, 2013
Published online: October 11, 2013