Article
Printed in Brazil - ©2016 Sociedade Brasileira de Química0103 - 5053 $6.00+0.00*e-mail: [email protected]
An Evaluation of the Use of Formic Acid for Extraction of Trace Elements
from Brazil Nut and Babassu Coconut and Its Suitability for Multi-Element
Determination by ICP-MS
Gisele S. Lopes,*,a Francisco L. F. Silva,a Patricia Grinbergb and Ralph E. Sturgeonb
aLaboratório de Estudos em Química Aplicada (LEQA), Departamento de Química Analítica e
Físico-Química, Universidade Federal do Ceará (UFC), 60455-760 Fortaleza-CE, Brazil
bChemical Metrology, Measurement Science and Standards, National Research Council of Canada,
Ottawa, Canada
Formic acid extractions of Brazil nut and babassu coconut samples were undertaken prior to determination of Al, As, Ba, Co, Cr, Cu, Mn, Mo, Ni, Pb, Se, Sr, V and Zn in their meat and oil portions by inductively coupled plasma mass spectrometry (ICP-MS) in an effort to accomplish a first order fractionation of the trace elements between these two components. An optimized full factorial design was applied to establish the best conditions for extraction. Microwave-assisted nitric acid digestions of samples and fractions along with analysis of certified reference material TORT-2 established the efficiency of recovery of the trace elements as well as provided a verification of accuracy. The multiple responses were analyzed using a desirability function wherein the recovery of the trace elements by extraction was compared with the determination of the total content as determined by nitric acid digestion. Although most trace elements presented a recovery higher than 85% using a formic acid extraction, Al suffered consistently low results for all samples (40-50%). Except for Al and Cr, the majority of the trace elements were present in the defatted fraction of both samples, i.e., Al (50 and 10%), Cr (86 and 60%), Ni (30 and 10%) and Sr (8 and 20%) in Brazil nut and babassu coconut oil fractions, respectively.
Keywords: formic acid extraction, trace elements, nuts, fractionation, ICP-MS
Introduction
Most spectroanalytical techniques rely on the introduction of solutions;1 consequently, development of
methods for digestion and solubilization of solid samples has been extensively pursued. The majority of published procedures rely on use of concentrated acids under conditions of elevated temperature and pressure to enhance the oxidation potential of the acids to ensure rapid and complete decomposition and solubilization, simultaneously converting analytes into simple inorganic species. Ultra-trace analysis imposes stringent requirements on the purity and amount of reagents consumed as well as selection of procedures that minimize contamination arising from manipulation or loss of analytes by volatilization.
When considering quantitation by inductively coupled plasma mass spectrometry (ICP-MS), complex matrices frequently require additional post dissolution treatment
such as dilution of the digest to minimize dissolved solids content or mitigate severe spectral interferences or their evaporation to remove acids.1
Alternatives to acid digestion of samples have been explored,2 in particular, for botanical and biological
matrices. One such approach is treatment of samples with formic acid.3-6 Formic acid has also been explored
as a reagent to promote photochemical vapor generation (PVG),7-11 thereby permitting more efficient introduction of
gaseous analytes into spectrochemical sources to improve detection limits.
Brazil nuts (Bertholletia excelsa) and babassu coconut (Orbignya phalerata) belong to the family of oil and edible seeds. They are high-energy almonds native to the Amazon region where they are consumed as food products (oil and meat) or used in the manufacture of cosmetics such as soaps (from babassu oil).12-14 In addition, Brazil nuts are
Several studies describing the fractionation of Brazil nut to separate the defatted flour from the oil fraction can be found in the literature.12,14,15 The principal interest of such
investigations was identification of the specific proteins found in the defatted fraction that contained elements of interest, particularly Se compounds.
Within the context of the above, the objective of this work was to explore the use of formic acid for the efficient solubilization of Brazil nut samples and babassu coconut for the determination of Al, As, Ba, Co, Cr, Cu, Mn, Mo, Ni, Pb, Se, Sr, V and Zn content by ICP-MS as well as employ a first order fractionation scheme to evaluate the partitioning of select elements between their oil and meat phases.
Experimental
Apparatus
All measurements were performed using an ELAN DRC II ICP-MS (PerkinElmer Sciex, Shelton, CT, USA) operating in standard mode (the dynamic reaction cell (DRC) system was functioning unreliably during the period of this study), equipped with a cyclonic glass spray chamber and a Meinhard concentric nebulizer. The ICP-MS was operated in accordance with the manufacturer’s recommended conditions. Instrumental parameters comprised the following: RF power: 1100 W; plasma gas flow rate: 15 L min -1; auxiliary gas flow rate:
1.20 L min-1; nebulizer gas flow rate: 0.96 L min-1 and a
sample introduction flow rate of 1.4 mL min-1.
Wet digestions were conducted using a Multiwave 3000 closed-vessel microwave digestion system (Anton Paar, Graz, Austria) equipped with 16 fluoropolymer vessels and ceramic vessel jackets. A DigiPrep digestion block (SCP Science, Quebec, Canada) was used to evaporate sample-digests.
Shelled raw nut samples were cold pressed using a MA 098/50A/1 hydraulic press (Marconi, Piracicaba, SP, Brazil) to remove the oil fraction. The resulting solid cake was subsequently subjected to a Soxhlet extraction with hexane to ensure complete removal of the lipid fraction.
The defatted samples were freeze-dried over a period of several days in an L 108 freeze-drier (Liobras, São Carlos, SP, Brazil).
Reagents and solutions
Sub-boiling distilled nitric acid was prepared from reagent grade feedstock under class 100 clean room conditions. Concentrated formic acid (88% m m-1) was
obtained from Anachemia (Montreal, QC, Canada). High
purity de-ionized water (DIW) was produced by reverse osmosis followed by a deionization (Barnsted/Thermolyne, Dubuque, IA, USA) to yield 18 MΩ cm resistivity reagent.
Calibration solutions of Al, As, Ba, Co, Cr, Cu, Mn, Mo, Ni, Pb, Se, Sr, V and Zn were prepared by serial dilution of high purity 1000 mg kg-1 commercial standards
(SCP Science, Montreal, Canada) with DIW containing 1% HNO3.
Hexane was purchased in high purity from Sigma-Aldrich (São Paulo, SP, Brazil).
Certified reference material (CRM) TORT-2 lobster hepatopancreas (NRC, Ottawa, Canada) was used for method validation.
Procedures
Shelled Brazil nut and babassu coconut samples were purchased from a local market in the city of Fortaleza, Ceará State, in the northeast region of Brazil. Samples were washed with DIW and dried at room temperature. Both matrices were rendered into a fine paste using a coffee grinder as a processing mill. The mill was pre-cleaned by grinding a sacrificial subsample of each nut and discarding it before processing the final material used for analysis.
A portion of each of the ground samples was freeze-dried and stored under vacuum. A separate portion of 20 g of each sample was placed between pre-cleaned and dried pieces of thin, muslin fabric and cold pressed at 150 kg cm-2 for
15 s to extract the oil. The oil was subsequently filtered by passing it through a pre-cleaned Whatman grade 1 filter paper (11 µm) and then stored in 15 mL amber glass vials
at ambient temperature. The solid residue (cake) was further treated to ensure removal of any residual oil by subjecting it to a Soxhlet extraction using hexane as solvent. The total oil fraction was determined by summing the weight of the initial pressed fraction with that recovered from the Soxhlet procedure (following evaporation of the hexane). The defatted fraction of the sample was freeze-dried and vacuum packed.
The formic acid solubilization procedure was optimized using a full factorial with center point experimental design. For this purpose, 250 mg sub-samples of CRM TORT-2 were weighed directly into polypropylene tubes and 8 mL HCOOH were added. The mixtures were placed in a thermostated (50 °C) ultrasound bath (frequency of 20 kHz, 80 W power) for periods of 1-3 h and then transferred to a 60 °C heating bath for varying times up to 15 h. Samples were then diluted to 30 mL with DIW to provide a medium containing 3.5% (v v-1) HCOOH. All experiments were
Microwave-assisted nitric acid digestion of CRM TORT-2 as well as the samples was performed. Sub-samples ranging from 150-250 mg were accurately weighed and transferred to the fluoropolymer digestion vials, 6.0 mL HNO3 were added and the vials were sealed. The microwave
heating program comprised the following steps: (i) a linear ramp of applied power to 1300 W over 10 min; (ii) a hold for 25 min at 1300 W; and (iii) cooling utilizing maximum air flow in the microwave cavity until the vessels reached room temperature. After digestion, solutions were transferred to polypropylene vials, evaporated to about 1 mL (90 °C) using the digestion block and then diluted to 30 mL with 0.5% (v v-1) HNO
3.
A four-point method of additions was used for the determination of all analytes in both microwave-assisted digested as well as formic acid extracted solutions to obviate any potential matrix interferences. The following isotopes were selected for measurement: 27Al, 75As, 138Ba, 59Co, 53Cr, 63Cu, 55Mn, 98Mo, 58Ni, 208Pb, 82Se, 88Sr, 51V and
64Zn.
Results and Discussion
A survey of the literature on trace elements in Brazil nuts12-16 reveals a significant interest in selenium in this
sample (likely due to its purported health benefits). CRM TORT-2 was selected for method development in this study because of an expected close match in selenium concentration to that of the real samples.
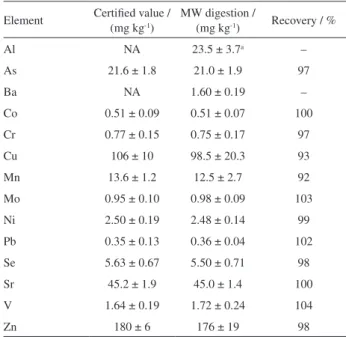
Table 1 summarizes results for analysis of the CRM TORT-2 validation sample following microwave-assisted nitric acid digestion. It is evident from a t-test that all results are in good agreement with the certified values at the 95% confidence level. Potential matrix interferences were compensated for using the method of additions for calibration. The formation of 12C40Ar+ precluded use
of 52Cr for quantitation while 82Se was selected to avoid
interferences from 80Ar
2+ and 40Ar38Ar+.
As the DRC was not functioning reliably during the course of this study, this precluded the ability to quantitate both trace Fe and Cr in the samples since the common isobaric interferences arising from ArO+ and ArC+ could
no longer be eliminated when the formic acid medium was analyzed. Note that when the samples were digested using a microwave-assisted acid dissolution, the background from ArC+ was sufficiently low to allow for determination of Cr
in such solutions.
Attempts to solubilize CRM TORT-2 using formic acid were optimized using a full factorial with center point experimental design. The earlier published procedure3
was modified by the addition of a heating step using
a thermostated bath, otherwise recovery of As and Se was below 80%. Although quantitative recovery of these elements was earlier reported when the digests were analyzed by graphite furnace atomic absorption spectrometry (GF AAS),3 it was evident that complete
solubilization of the matrix is not achieved without the additional heating step. Since the digests were filtered prior to analysis in this study, whereas they were directly sampled for determination by GF AAS by Scriver et al.,3 a significant
fraction is lost from the filtrate that would otherwise have been pyrolyzed and contributed to response by GF AAS.
Selenium, mainly present as selenocysteine and selenomethionine amino acids in tissue samples,16 may be
difficult to recover with use of formic acid unless elevated temperatures are used17,18 and thus recovery of Se is not
satisfactory if undigested proteins are removed by filtration prior to analysis of unheated mixtures. The presence of a residue requiring filtration leads to the conclusion that even with the addition of the heating step, extraction, rather than solubilization, is achieved.
The desirability function is a popular and established methodology for system optimization based on multiple input responses; the approach modified by Deringer and Suich19 described the relationship between response
and dependent variables utilizing a desirability function which identifies the optimal (compromise) conditions. The response Y in a desired individual function d can range from 0 (representing a completely undesirable value) to 1 (representing an ideal response value). Figure 1 presents
Table 1. Results for CRM TORT-2
Element Certified value / (mg kg-1)
MW digestion /
(mg kg-1) Recovery / %
Al NA 23.5 ± 3.7a –
As 21.6 ± 1.8 21.0 ± 1.9 97
Ba NA 1.60 ± 0.19 –
Co 0.51 ± 0.09 0.51 ± 0.07 100
Cr 0.77 ± 0.15 0.75 ± 0.17 97
Cu 106 ± 10 98.5 ± 20.3 93
Mn 13.6 ± 1.2 12.5 ± 2.7 92
Mo 0.95 ± 0.10 0.98 ± 0.09 103
Ni 2.50 ± 0.19 2.48 ± 0.14 99
Pb 0.35 ± 0.13 0.36 ± 0.04 102
Se 5.63 ± 0.67 5.50 ± 0.71 98
Sr 45.2 ± 1.9 45.0 ± 1.4 100
V 1.64 ± 0.19 1.72 ± 0.24 104
Zn 180 ± 6 176 ± 19 98
aConfidence interval (t value: 4.3, 95%). MW: microwave; NA: not
such a desirability function for the formic acid extraction approach based on multiple responses reflecting the recovery of trace elements from CRM TORT-2 and the impact of both the “bath time” at 60 oC and the time the
samples were subjected to the ultrasonication at 50 oC, i.e.,
the “US time”. It is evident that there is a large increase in the desirability (0.6) when subjecting the samples to 3 h of sonication combined with 7 h of heating.
Experimentally, the impact of the 60 °C heating step had a positive influence on recovery of As, Cu, Se and Zn, increasing it from 75 to 95%. Greater than 95% recoveries were obtained for Ba, Co and Mo when the sample was exposed to the ultrasonic bath for 3 h at 50 °C. On the other hand, recovery of Mn, Ni, Pb and V was readily achieved by following the simplified digestion procedure.3
The optimized (compromised) response for all elements was obtained using the following formic acid extraction procedure: 0.25 g sub-samples mixed with 8 mL HCOOH (88%) and subjected to a 3 h ultrasonic bath at 50 °C followed by 7 h at 60 °C in a thermostated bath.
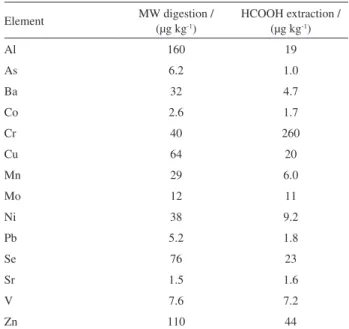
Table 2 summarizes estimated limits of quantification (LOQ) calculated as 10-fold the standard deviation of 10 replicate measurements of the blank divided by the slope of the analytical calibration curve and multiplied by the sample dilution factor. The LOQs for Al, As and Ba improved from 6- to 8-fold with formic acid extraction; Mn and Ni improved 5-fold and even Se presented a 3-fold better LOQ using this approach compared to analysis following microwave-assisted digestion with nitric acid.
Measurement sensitivity increased for all elements in the formic acid medium. This may arise because of an increase in ionization efficiency for a number of elements, possibly due to charge transfer by an elevated level of
C+ species in the plasma,20 and also as a consequence
of differing aerosol properties (i.e., surface tension and density) that increase the nebulization efficiency compared to solutions containing nitric acid.1,21 LOQs are improved
in the formic acid medium due to enhanced sensitivity, lower blank values and improved measurement precision.
Brazil nut samples
Whole and defatted Brazil nut samples were processed with HCOOH using the optimized procedure identified by the experimental design. Results obtained for the determination of the trace elements by ICP-MS are summarized in Tables 3 and 4. Similarly to analysis of wet and dry fractions of materials, removal of the oil (64% by mass) has increased the relative concentration of all elements present in the defatted fraction.
The presence of carbon in the plasma may affect response as a consequence of both spectral and matrix interferences.20 No results are presented for Cr in a formic
acid medium as significant interference on even 53Cr remains
due to the presence of large concentrations of carbon arising from both the formic acid and constituents of the sample matrix.22 As such, determination of Cr was only possible for
samples subjected to the more complete oxidation achieved with microwave-assisted acid decomposition.
Reports of concentrations of Se and Ba in Brazil nuts reveal substantial variability;12-15,23 there is consensus that
levels of Se in the nut kernels may vary with geographic location and soil characteristics in which they have been
Figure 1. Desirability function response surface for “bath time” vs.
US time.
Table 2. Estimated limits of quantification
Element MW digestion /
(µg kg-1)
HCOOH extraction / (µg kg-1)
Al 160 19
As 6.2 1.0
Ba 32 4.7
Co 2.6 1.7
Cr 40 260
Cu 64 20
Mn 29 6.0
Mo 12 11
Ni 38 9.2
Pb 5.2 1.8
Se 76 23
Sr 1.5 1.6
V 7.6 7.2
Zn 110 44
grown. Naozuka et al.13 reported concentrations of Ba of
470 mg kg-1 in Brazil nuts collected in Pará State (north
region of Brazil). Selenium content was not measured, probably due to an insufficient LOQ available with the inductively coupled plasma optical emission spectrometry (ICP-OES) detection method used. Parekh et al.24 attributed
the high concentration of Ba found in Brazil nuts grown in the Amazon Basin of South America as due to the presence
of a Ba-rich mineral (hollandite, Ba2Mn8O16) present in
the soils. These authors encountered a range of 0.17 to 2000 mg kg-1 in samples collected in Northern South
America, Brazil, Bolivia and Peru. In the present work, concentrations of Ba averaging 850 mg kg-1 were obtained
in the whole Brazil nuts.
In the same manner, the concentrations summarized in Table 3 for other micronutrients in the Brazil nuts studied here, such as Mn and Zn, are comparable to those reported by Naozuka et al.,13 i.e., Mn (8.8 mg kg-1)
and Zn (39 mg kg-1), and also by Santos et al.,14 i.e.,
Mn (16.5 mg kg-1) and Zn (35.1 mg kg-1).
Results for the analysis of solutions prepared by microwave-assisted nitric acid digestion of these samples were compared to those obtained by formic acid extraction so as to calculate recoveries using the latter procedure. Recoveries of trace elements from the whole Brazil nut samples are summarized in Table 3 and ranged from 85 to 104% while those from the defatted samples, shown in Table 4, vary from 88 to 104%. However, low recoveries are evident for Al in both the whole and defatted samples of the nut. This aspect needs further study.
Babassu coconut samples
Freeze-dried whole and defatted fractions of babassu coconut samples were also extracted with HCOOH using the earlier established optimized procedure. Results obtained for the determination of the trace elements are summarized in Tables 5 and 6. As the microwave-assisted acid digestion methodology was previously validated
Table 3. Results for whole Brazil nuts extracted with formic acid and by microwave-assisted nitric acid digestion (n = 3)
Element MW digestion / (mg kg-1) HCOOH extraction / (mg kg-1) Recovery / %
Al 2.61 ± 0.06 1.18 ± 0.02 45
As 0.058 ± 0.003 0.055 ± 0.003 95
Ba 849 ± 35 867 ± 42 102
Co 0.95 ± 0.03 0.94 ± 0.06 99
Cr 0.22 ± 0.01 ND –
Cu 17.4 ± 0.8 18.1 ± 0.9 104
Mn 14.8 ± 0.6 15.1 ± 0.4 102
Mo 0.012 ± 0.005 0.010 ± 0.006 85
Ni 2.03 ± 0.11 1.82 ± 0.06 89
Pb 0.009 ± 0.001 0.008 ± 0.002 88
Se 3.87 ± 0.13 3.76 ± 0.25 97
Sr 166 ± 12 158 ± 10 95
V 0.018 ± 0.001 0.016 ± 0.002 89
Zn 45.0 ± 1.5 44.8 ± 0.9 100
MW: microwave; ND: no interference-free isotope available for quantitation.
Table 4. Results for defatted Brazil nuts extracted with formic acid and by microwave-assisted nitric acid digestion (n = 3)
Element MW digestion / (mg kg-1)
HCOOH extraction /
(mg kg-1)
Recovery / %
Al 3.80 ± 0.15 1.97 ± 0.15 51
As 0.16 ± 0.01 0.14 ± 0.02 88
Ba 2200 ± 130 2112 ± 98 96
Co 2.60 ± 0.12 2.54 ± 0.15 98
Cr 0.12 ± 0.01 ND –
Cu 47.2 ± 2.1 48.1 ± 2.2 102
Mn 40.3 ± 2.0 39.8 ± 1.9 99
Mo 0.034 ± 0.001 0.035 ± 0.001 103
Ni 4.22 ± 0.13 4.17 ± 0.10 99
Pb 0.024 ± 0.001 0.022 ± 0.002 92
Se 10.5 ± 0.5 10.9 ± 0.4 104
Sr 426 ± 13 418 ± 8 98
V 0.050 ± 0.003 0.048 ± 0.001 96
Zn 120 ± 6 123 ± 5 101
(Table 1), such results were used as reference values for calculation of recoveries of elements subjected to the formic acid extraction procedure.
It is important to emphasize that the concentration levels of the elements found in such almonds can be different and are dependent on the plant physiology as well as characteristics of the soil in which they are grown. Each
species has its own capacity to uptake and accumulate various elements,1,22 despite their being harvested from
the same geographic region of Brazil, i.e., from a soil rich in Se and Ba. In contrast to the Brazil nuts, concentrations of Se and Ba present in babassu coconut are much lower, 0.54 and 0.20 mg kg-1, respectively.
Babassu coconut presents concentrations of Al and Zn comparable to those reported by Naozuka et al.13
Oil fractions
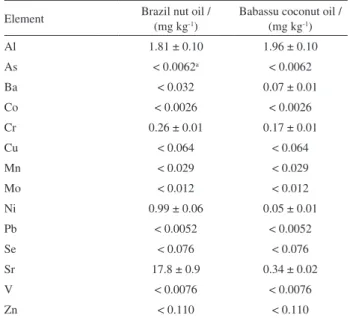
Formic acid extraction of the elements from the oil fractions derived from the samples was not efficient. However, microwave-assisted digestions of this fraction allowed quantitation of the trace elements by ICP-MS.
Table 7 summarizes the trace element content in the oil fraction derived from both materials. Taking into account the mass fraction of oil comprising the samples (64 and 66% for Brazil nut and babassu coconut, respectively), it can be inferred that 50% Al, 86% Cr, 30% Ni and 8% of Sr content is present in the Brazil nut oil fraction. These trends compliment results reported by Welna et al.,12 who
utilized various reagents (solvents) for extraction of the lipid fraction of Brazil nuts, finding Cr (85-100%) and Ni (50-70%) in the oil fraction.
For babassu coconut, the oil fraction contained 10, 20, 60, 10 and 20% of the total element content of Al, Ba, Cr, Ni and Sr, respectively, in this sample. Although babassu oil is widely used in the manufacture of cosmetics and is used in foods, there are unfortunately no published studies
Table 6. Results for defatted babassu coconut extracted with formic acid and microwave-assisted nitric acid digestion (n = 3)
Element MW digestion / (mg kg-1)
HCOOH extraction /
(mg kg-1)
Recovery / %
Al 32.3 ± 0.1 15.1 ± 0.55 47
As 0.016 ± 0.001 0.015 ± 0.002 94
Ba 0.46 ± 0.02 0.44 ± 0.01 96
Co 0.11 ± 0.01 0.11 ± 0.01 100
Cr 0.21 ± 0.01 ND –
Cu 38.9 ± 1.8 38.1 ± 1.3 98
Mn 92.8 ± 2.6 91.9 ± 2.5 99
Mo 0.78 ± 0.03 0.76 ± 0.01 98
Ni 0.86 ± 0.03 0.85 ± 0.06 99
Pb 0.051 ± 0.001 0.048 ± 0.002 95
Se 1.58 ± 0.02 1.61 ± 0.07 102
Sr 2.60 ± 0.15 2.54 ± 0.12 98
V 0.14 ± 0.01 0.13 ± 0.01 96
Zn 56.4 ± 1.8 57.5 ± 2.5 102
MW:microwave; ND: no interference-free isotope available for quantitation.
Table 5. Results for whole babassu coconut extracted with formic acid and microwave-assisted nitric acid digestion (n = 3)
Element MW digestion / (mg kg-1)
HCOOH extraction /
(mg kg-1)
Recovery / %
Al 12.4 ± 0.04 5.21 ± 0.22 42
As 0.005 ± 0.001 0.004 ± 0.001 80
Ba 0.20 ± 0.01 0.17 ± 0.01 85
Co 0.034 ± 0.002 0.030 ± 0.002 88
Cr 0.18 ± 0.01 ND –
Cu 14.1 ± 0.6 13.8 ± 0.3 98
Mn 32.2 ± 1.2 30.6 ± 1.4 95
Mo 0.27 ± 0.01 0.23 ± 0.02 85
Ni 0.33 ± 0.01 0.26 ± 0.02 80
Pb 0.017 ± 0.001 0.016 ± 0.002 94
Se 0.54 ± 0.02 0.53 ± 0.01 98
Sr 1.13 ± 0.05 0.98 ± 0.07 86
V 0.044 ± 0.001 0.046 ± 0.002 104
Zn 20.1 ± 1.1 20.8 ± 0.9 103
MW: microwave; ND: no interference-free isotope available for quantitation.
Table 7. Results for microwave-assisted digested oil samples (n = 3)
Element Brazil nut oil /
(mg kg-1)
Babassu coconut oil / (mg kg-1)
Al 1.81 ± 0.10 1.96 ± 0.10
As < 0.0062a < 0.0062
Ba < 0.032 0.07 ± 0.01
Co < 0.0026 < 0.0026
Cr 0.26 ± 0.01 0.17 ± 0.01
Cu < 0.064 < 0.064
Mn < 0.029 < 0.029
Mo < 0.012 < 0.012
Ni 0.99 ± 0.06 0.05 ± 0.01
Pb < 0.0052 < 0.0052
Se < 0.076 < 0.076
Sr 17.8 ± 0.9 0.34 ± 0.02
V < 0.0076 < 0.0076
Zn < 0.110 < 0.110
concerning the composition of trace elements in this nut sample.
Conclusions
As solutions obtained following the described ultrasound and heating steps using formic acid required filtering prior to analysis, it is clear that this process is equivalent to an “extraction”, rather than a complete solubilization or digestion. Filtration precluded any problems with particles clogging the nebulizer; obviously, this does not impact the analysis of such preparations when determinations are performed by GF AAS, in which case the process may be considered to be a solubilization. Nevertheless, a formic acid extraction approach provides a greener, simpler and less expensive alternative to acid digestions for sample preparation for the subsequent determination of trace elements in such samples. Moreover, the resultant digests may be suitable for direct use of photochemical vapor generation for a number of these elements25 to enhance
sample introduction efficiency and improve LOQs. Optimization of the extraction procedure using chemometric tools allows mapping the entire experimental domain studied. Thus it may be inferred that some elements (Mn, Ni, Pb, Sr and V) are readily extracted following the simplified procedure as described in the literature. However, the extraction of Ba, Co and Mo require 3 h in an ultrasonic bath (50 °C) and only for quantitative extraction of As, Cu, Se and Zn is it necessary to include a heating step in a thermostated bath for 7 h.
Treatment of the oil fractions with formic acid in an attempt to extract them was unsuccessful. More studies are needed to thoroughly investigate this approach. The relatively high fractions of elements such as Cr and Ni remaining in the lipid phase may be of interest from the perspective of speciation of these elements. To date, only speciation of Se has been studied.15,26
Acknowledgments
The authors are grateful to Coordenação de Aperfeiçoamento de Pessoal de Nível Superior (CAPES, Brazil) for financial support to G. S. L. (BEX 9263/13-6).
References
1. Todoli, J. S. In Liquid Sample Introduction in ICP Spectrometry – A Practical Guide; Todoli, J. S.; Mermet, J. M., eds.; Elsevier: New York, 2008, pp. 147-190.
2. Nóbrega, J. A.; Santos, M. C.; Sousa, R. A.; Cadore, S.; Barnes, R. M.; Tatro, M.; Spectrochim. Acta, Part B2006, 61,465.
3. Scriver, C.; Kan, M.; Willie, S.; Soo, C.; Birnboim, H.; Anal. Bioanal. Chem.2005, 381, 1460.
4. Schrijver, I.; Aramendia, M.; Resano, M.; Dumoulin, A.; Vanhaecke, F.; J. Anal. At. Spectrom. 2008, 23, 500.
5. Tormen, L.; Gil, R. A.; Frescura, V. L. A.; Martinez, L. D.; Curtius, A. J.; Spectrochim. Acta, Part B2010, 65, 959. 6. Narukawa, T.; Willie, S.; J. Anal. At. Spectrom.2010, 25, 1145. 7. Vieira, M. A.; Ribeiro, A. S.; Curtius, A. J.; Sturgeon, R. E.;
Anal. Bioanal. Chem.2007, 388, 837.
8. Nobrega, J. A.; Sturgeon, R. E.; Grinberg, P.; Gardner, G. J.; Brophy, C. S.; Garcia, E. E.; J. Anal. At. Spectrom.2011, 26, 2519.
9. Sturgeon, R. E.; Grinberg, P.; J. Anal. At. Spectrom.2012, 27, 222.
10. Suzuki, T.; Sturgeon, R. E.; Zheng, C.; Hioki, A.; Nakazato, T.; Tao, H.; Anal. Sci.2012, 28, 807.
11. Grinberg, P.; Sturgeon, R. E.; Gardner, G. J.; Microchem. J.
2012, 105, 44.
12. Welna, M.; Klimpel, M.; Zyrnicki, W.; Food Chem.2008, 111, 1012.
13. Naozuka, J.; Vieira, E. C.; Nascimento, A. N.; Oliveira, P. V.;
Food Chem.2011, 124, 1667.
14. Santos, O. V.; Correa, N. C. F.; Carvalho Jr., R. N.; Costa, C. E. F.; França, L. F. F.; Lannes, S. C. S.; Food Res. Int.2013,
51, 841.
15. Dumont, E.; Pauw, L.; Vanhaecke, F.; Cornelis, R.; Food Chem.
2006, 95, 684.
16. Brown, K. M.; Arthur, J. R.; Public Health Nutr.2001, 4(2B), 593.
17. Wurfels, M.; Jackwerth, E.; Stoeppler, M.; Anal. Chim. Acta
1989, 226, 1.
18. Wurfels, M.; Jackwerth, E.; Stoeppler, M.; Anal. Chim. Acta
1989, 226, 17.
19. Deringer, G.; Suich, R.; J. Qual. Technol. 1980, 12, 214. 20. Rodushkin, I.; Nordlund, P.; Engstrom, E.; Baxter, D.; J. Anal.
At. Spectrom.2005, 20, 1250.
21. Todoli, J. S.; Mermet, J. M.; Canals, A.; Hernandis, V.; J. Anal. At. Spectrom. 1998, 13, 55.
22. Pettine, M.; Casentini, B.; Mastroianni, D.; Capri, S.; Anal. Chim. Acta2007, 599, 191.
23. Chang, J. C.; Gutenmann, W. H.; Reid, C. M.; Lisk, D. J.;
Chemosphere1995, 30, 801.
24. Parekh, P. P.; Khan, A. R.; Torres, M. A.; Kitto, M. E.; J. Food Compos. Anal. 2008, 21, 332.
25. Wu, P.; He, L.; Hou, X.; Zheng, C.; Sturgeon, R. E.; J. Anal. At. Spectrom.2010, 25, 1217.
26. Jayasinghe, S. B.; Caruso, J. A.; Int. J. Mass Spectrom.2011,
307, 16.