Article
Printed in Brazil - ©2017 Sociedade Brasileira de Química0103 - 5053 $6.00+0.00*e-mail: [email protected]
Determination of Selenium in Bovine Semen by ICP-MS Using Formic Acid for
Sample Preparation
Silmara R. Bianchi,a,b Clarice D. B. Amaral,c Caroline S. Silvab,d and
Ana Rita A. Nogueira*,b
aEmbrapa Solos, Rua Jardim Botânico, 1024, Jardim Botânico, 22460-000 Rio de Janeiro-RJ, Brazil
bEmbrapa Pecuária Sudeste, P.O. Box 339, 13560-970 São Carlos-SP, Brazil
cDepartamento de Química, Universidade Federal do Paraná, P.O. Box 19032, 81531-980 Curitiba-PR, Brazil
dGrupo de Análise Instrumental Aplicada, Departamento de Química,
Universidade Federal de São Carlos, P.O. Box 676, 13560-970 São Carlos-SP, Brazil
Determination of Se by inductively coupled plasma mass spectrometry (ICP-MS) can be difficult due to spectral interferences; however, these interferences can be eliminated by using collision-reaction interface (CRI) technology. A simple and fast procedure for determination of total Se concentration in bovine semen by ICP-MS after sample solubilization with diluted formic acid is here proposed. Formic acid caused an increase of up to 50% in selenium net signals and the maximum gain was obtained at 10% v v-1 formic acid solution. The optimized nebulizer gas
flow rates were 1.05 and 0.95 L min-1, and radio frequency applied power were 1.3 and 1.4 kW
without and with CRI, respectively. Microwave-assisted acid digestion was also implemented in the preparation of semen sample for comparison of results. No statistical differences between these sample preparation strategies at 95% confidence level (t-test) were observed for 76Se+, 77Se+, 78Se+
and 82Se+ without using CRI and 82Se+ with CRI.
Keywords: selenium, ICP-MS, bovine semen, diluted formic acid, cattle fertility
Introduction
Selenium is considered an essential trace element in human nutrition and its deficiency may cause reproductive disorders and in some cases leads to infertility. The low concentration of this element in semen is characterized by decreasing sperm mobility, flagella defects and reduced supply of the ATP enzyme (adenosine-5’-triphosphate) which is responsible for testicular development and spermatogenesis. As well as in humans, Se deficiency can negatively affect fertility in bovine.1-5
Selenium-dependent enzymes play an important role in bull spermatozoa protection from damage caused by oxidation.6 Selenium deficiency resulted in abnormal
spermatozoa mitochondria, and supplementation with nano-Se enhanced the tests Se content, testicular and semen GSH-Px activity, protected the membrane
system integrity and the tight arrangement of the middle piece of the mitochondria.7 The activity of
selenium-containing glutathione peroxidase PHGPx (phospholipid hydroperoxide glutathione peroxidase) can be used as a predictive marker of semen quality in human and bovine semen, that measurement is a suitable tool to evaluate fertilization capability of spermatozoa.8
Beef has an important role in human nutrition and represents one of the biggest slices of Brazilian agribusiness. Selenium levels in the soil of livestock areas are considered low, in other words, insufficient to supply the nutritional demand of this element to bovines at all stage of growth. Therefore, to ensure cattle fertility and overcome this deficiency, Se based supplements are added to cattle diet.9,10
large amounts of corrosive and toxic reagents which lead to an increase in the cost of analysis and may also cause contamination or losses by volatilization. Formic acid has been used as an alternative reagent in biological tissues solubilization mainly due to its availability, simplicity and safety.11,12
Some previous papers described the development of procedures using formic acid for sample preparation, such as Tormen et al.,12 which developed a simple and fast
procedure for trace elements determination in biological materials by inductively coupled plasma mass spectrometry (ICP-MS) using a microconcentric nebulizer after sample solubilization with formic acid. Scriver et al.13 described
a procedure for solubilization of biological samples from the marine origin and subsequent determination by electrothermal atomic absorption spectrometry (ET AAS) and inductively coupled plasma optical emission spectrometry (ICP OES). In another study, Tormen et al.14
developed a quick procedure for the determination of As, Co, Cu, Fe, Mn, Ni, Se and V in biological samples by electrothermal vaporization inductively coupled plasma mass spectrometry (ETV-ICP-MS) after a single treatment of samples with formic acid.
Among the methods used for the determination of selenium, the most appropriate according to the AOAC are those that employ fluorimetry and hydride generation atomic absorption spectrometry (HG-AAS).15 Although
several alternative procedures for sample preparation have been developed, many of them cannot be applied when using determinations by ICP-MS due to the high levels of dissolved solids and the presence of organic compounds that may cause interferences. The introduction of high contents of organic solvents in the plasma decreases the excitation temperature and electron density. These effects are attributed to the increased energy required to dissociate carbon-containing molecular species. It may also be noticed that the presence of carbon in the argon plasma significantly improves the sensitivity of elements with high ionization energy, such as As and Se, due to charge transfer reactions.16-20
Considering the formation of polyatomic ions, from the sample or plasma itself, Se determination is affected by interfering polyatomic ions, such as 40Ar
2+ or 12C35Cl2+,
and the effects of these ions may be overcome by using strategies, such as selection of another isotope, use of mathematical correction, cool plasma or tailored devices for promoting reactions and/or collisions by gases introduction, for instance, H2, He, O2, and NH3.21-23 In this
study, diluted formic acid solution was used to solubilize samples of bovine semen aiming Se determination by ICP-MS.
Experimental
Chemicals
All glassware was immersed in 10% v v-1 HNO 3 for at
least 24 h and rinsed with ultra-pure water prior use. All aqueous solutions were prepared with analytical grade reagents, and ultra-pure water (18.2 MΩ cm) was obtained from a Milli-Q water purification system (Millipore, Bedford, MA, USA). Ultrapure HNO3 and HCl were
produced using a sub-boiling distillation system (Milestone, Sorisole, Italy). Formic acid (88% v v-1) was purchased
from J. T. Baker (Xalostoc, Mexico City, Mexico) and hydrogen peroxide from Synth (Diadema, SP, Brazil). The single stock solutions of 1000 mg L-1 Se, Ce and Ba
were purchased from Qhemis High Purity (São Paulo, SP, Brazil) and they were used to prepare analytical calibration solutions. Liquid argon and H2 gases, both with 99.999% of
purity, were provided by White Martins (Sertãozinho, SP, Brazil). Argon was used for plasma generation and H2 was
introduced through skimmer cone of the collision-reaction interface (CRI).
Instrumentation
Experiments were carried out using a quadrupole inductively coupled plasma mass spectrometer (ICP-QMS, 820-MS, Varian, Mulgrave, Australia), equipped with a CRI, which is composed of modified skimmer and sampler cones through which gases (H2 or He) can be introduced to
correct for spectral interferences. The sample introduction system employed was a concentric nebulizer, connected to a standard quartz spray chamber (Scott type) kept at 2 °C and an automatic sampler (Varian SPS3, Mulgrave, Australia).
In this work three different conditions were evaluated for total Se determinations: (i) with CRI (H2 at 60 mL min-1);
(ii) with CRI (H2 at 80 mL min-1); and (iii) without using
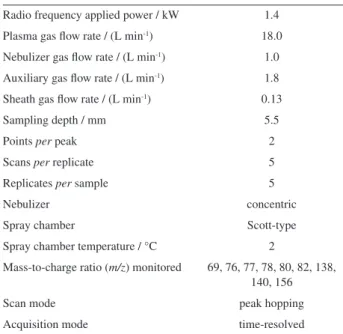
CRI. The typical instrument configuration and operating parameters adopted are summarized in Table 1.
For sample preparation, a cryogenic mill (CryoMill, Retsch, Hann, Germany), a freeze-drier (E-C, MicroModulyo, New York, NY, USA), a water bath with heating and stirring (Novatecnica, Piracicaba, SP, Brazil) and a closed vessel microwave digestion system (Ethos 1, Milestone-MLS, Sorisole, Italy) were used.
Effect of formic acid on Se isotopes net signals
All these solutions also contained 10 µg L-1 Se in
1% v v-1 HNO
3. Solutions prepared in these same media
without Se were used as analytical blanks. This study was carried out using a nebulizer gas flow rate of 1.0 L min-1
and a radio frequency (RF) applied the power of 1.4 kW. Monitored selenium isotopes were 76Se+, 77Se+, 78Se+, 80Se+
and 82Se+ and for optimization of formic acid concentration,
ICP-MS instrumental conditions were evaluated without using CRI, and using CRI with the introduction of 60 or 80 mL min-1 of H
2 flowing through the skimmer cone.
Effect of formic acid on interferences by double charged ions, oxides and polyatomic ions
The formic acid effect on double charged ions and oxides formation were investigated by measurements of different formic acid solutions (from 0 to 20% v v-1)
containing 10 µg L-1 of Ba and Ce ions and HNO
3 1% v v-1.
The polyatomic interferences caused by the presence of argon, carbon and chloride ions (40Ar37Cl+ and 12C35Cl
2+)
were evaluated by adding 2% v v-1 HCl and 1% v v-1 HNO 3
to solutions containing gradually increasing concentrations of formic acid (same as above).
Optimization of the nebulizer gas flow rate and the RF applied power
After choosing the best concentration of formic acid, the optimization of the nebulizer gas flow rate (0.80, 0.85, 0.90, 0.95, 1.00, 1.05, 1.10, 1.15 and 1.20 L min-1) and RF applied
power (0.6, 0.7, 0.8, 0.9, 1.0, 1.1, 1.2, 1.3 and 1.4 kW) was
performed using a 10% v v-1 formic acid solution containing
10 µg L-1 of Se and HNO
3 1% v v-1. Before optimization,
solutions were introduced into the plasma at 1.0 L min-1
flow rate and applying 1.4 kW RF power.
Analytical application
Semen samples from 80 Nellore bulls provided from reproduction experiments developed at Embrapa Pecuária Sudeste, São Carlos, SP, were collected employing electroejaculation technique using the apparatus Eletrovet (model Torjet 95 A, Eletrovet, São Paulo, SP, Brazil). The bulls received inorganic Se supplementation mixed with other minerals in their diet. Semen samples collected were homogeneously mixed to compose a single semen sample (pool) to increase sample representativeness to perform the proposed experiments. Immediately after collection, the mixed samples (pool) were freeze-dried for 48 h and then ground in a freezer mill containing liquid N2 to avoid
possible analyte losses. Samples were kept in a desiccator until analysis. The solubilization in the formic acid medium was performed by transferring approximately 200 mg of the ground and homogenized sample to a 50 mL polypropylene flask, to which 20 mL of 50% v v-1 formic acid was added.
Then, the tube was capped and placed in a water bath at 90 °C for 60 min, and 1.0 mL of 30% m m-1 H
2O2 was
added after 30 min of heating. The volume was made up to 100 mL with ultrapure water leading to a 10% v v-1 formic
acid final concentration.
Microwave-assisted acid digestion of semen samples was also employed for comparison. Approximately 200 mg of bovine semen was digested by using 6.0 mL of 7.0 mol L-1 HNO
3 solution and 2.0 mL of 30% m m-1
H2O2 in perfluoroalkoxycopolymer resin (PFA) closed
vessels. The heating program was performed in four steps: (i) 15 min ramp to reach 120 °C (at 1.3 kW); (ii) 20 min to reach 200 °C (at 1.3 kW); (iii) 20 min final step at 200 °C (1.3 kW); (iv) 10 min under ventilation. Temperature and pressure sensors were used in all digestions. After digestion samples and blank solutions were transferred to 15.0 mL polypropylene flasks and the volume was made up to 14.0 mL with ultrapure water. Further dilution was performed to ensure a maximum of 0.1% m v-1 dissolved solids to avoid
solid deposition on sampling and skimmer cones.
Selenium determination in samples treated with formic acid was performed using the optimized conditions and solutions were prepared in 10% v v-1 formic acid, and
1% v v-1 HNO
3 for external calibration in organic medium
and matrix effects was evaluated by the standard additions method. The Se concentrations for analytical calibration curve were as following: 0, 2, 5, 15, 20 and 30 µg L-1.
Table 1. Instrument configuration and operating conditions for ICP-QMS
Radio frequency applied power / kW 1.4
Plasma gas flow rate / (L min-1) 18.0
Nebulizer gas flow rate / (L min-1) 1.0
Auxiliary gas flow rate / (L min-1) 1.8
Sheath gas flow rate / (L min-1) 0.13
Sampling depth / mm 5.5
Points per peak 2
Scans per replicate 5
Replicates per sample 5
Nebulizer concentric
Spray chamber Scott-type
Spray chamber temperature / °C 2
Mass-to-charge ratio (m/z) monitored 69, 76, 77, 78, 80, 82, 138, 140, 156
Scan mode peak hopping
Results and Discussion
Effects of formic acid concentration on net signal intensities of Se isotopes and on spectral interferences caused by double charged ions, oxides, and polyatomic ions
The formic acid concentration effect on Se isotopes net signals is shown in Figure 1. The net signals illustrated in Figure 1 are blank-corrected for each concentration of formic acid. For most Se isotopes, the maximum signal enhancement was obtained at 10% v v-1 formic acid
concentration, resulting in 3 to 7-fold increments in net signals compared to the signal of a solution without this reagent. The net signal gain caused by the introduction of a carbon source into the plasma is caused by the increased ionization of elements of high ionization potential, such as Se (9.75 eV), and this enhancement signal is promoted by charge transfer reactions that occur between positively charged carbon species and Se atoms in the central channel of the plasma.24-26 The Se signal gains varied according to
the use or not of CRI with an H2 introduction through the
skimmer cone (Figures 1a, 1b and 1c). The increase in net signals without using the CRI was not observed for 76Se+
(Figure 1a), probably due to strong interferences caused by
36Ar40Ar+. It is important to remember that except for 40Ar+
(99.60% natural abundance), the isotope 36Ar+ (0.3375%
natural abundance) is the most abundant isotope of argon. Thus the polyatomic species 36Ar40Ar+ is quite pronounced,
justifying the discrepant behavior of the m/z 76 in standard mode. The isotope 80Se+ was not shown in Figure 1a due
to high signal intensities caused by 40Ar40Ar+. Due to the
noticeable decrease of the net signals when introducing 80 mL min-1 H
2 through the skimmer cone, this flow rate
was not used in further experiments. The signal losses probably caused by collision processes among Se isotopes and H2 gas at this flow rate were higher than 99%. This
signal reduction was also observed in previous studies using CRI to remove polyatomic interferences, and this effect was related to ion beam defocalization.16,27
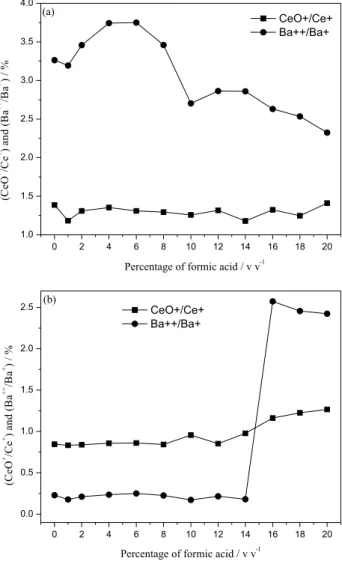
The formation of divalent ions was monitored by measuring the Ba2+/Ba+ ratio for the isotope 138 since Ba is
an ion that easily forms double charge. The determination of some analytes can be impaired by the formation of oxides. Thus their eventual formation was inferred by monitoring the CeO+/Ce+ ratio. According to the manufacturer’s
recommendations, in the standard sensitivity operation mode, the percentage of oxide must be lower than 1%, and the double charge formation must be lower than 3%. The double charge and oxides formation were evaluated for all formic acid solutions. Without using the CRI, the double charge formation was higher than 3% for formic
acid concentrations below 10% v v-1. This probably occurs
due to charge transfer reactions between carbon charged
Figure 1. Effect of formic acid concentration on Se isotopes net signals: (a) without CRI; (b) with CRI at 60 mL min-1 H
2; (c) with CRI at
80 mL min-1 H
2. Se concentration: 10 µg L-1 for evaluation of analyte signal
species and Ba+.12 On the other hand, oxides formation
was higher than 1% for all concentrations of formic acid tested, as it can be seen in Figure 2a. When using CRI (Figure 2b), oxide formation was higher than 1% only for formic acid concentrations greater than 14% v v-1
and the double charge formation was lower than 3% for all studied formic acid solutions. Using optimized RF applied power and nebulizer gas flow rate, it was found that Ba2+/Ba+ and CeO+/Ce+ ratios were lower than 1%.
It is well known that the determination of Se by ICP-MS is hampered by the formation of polyatomic ions. In this study (Figure 3), some typical argon, carbon, and chloride polyatomic ions were investigated by introducing solutions with different formic acid concentrations and 2% v v-1 HCl. Signal intensities for 40Ar36Ar+ and 40Ar37Cl+ increased for formic acid solutions containing
up to 6% v v-1 without using CRI (Figure 3a). Signals
for 40Ar40Ar+ were too high, confirming the difficulty
to determine 80Se+ (the most abundant isotope) without
using CRI. Again, except for 40Ar+, the 36Ar+ is the most
abundant isotope of argon. Without CRI, in Figure 3a, the
40Ar+ cannot be measured, it would saturate the detector,
and thus, the signal from 36Ar40Ar+ will be naturally the
biggest analytical signal, as expected. Although 12C+ and 35Cl+ have been present in plasma, they are present in
contents much less than 36Ar+. At Figure 3b, with CRI, the m/z 76 present behavior similar to the other mass, and the
m/z 80 corresponding to 40Ar40Ar+ have the major signal,
which is completely predictable. Figure 3b shows that signal intensities for 40Ar40Ar+ decreased for formic acid
concentrations higher than 2% v v-1. The interference of
carbon in 82Se+ was negligible when using or not the CRI.
Based on this behavior, the formic acid concentration was kept in 10% v v-1 for further experiments.
Figure 2. Effect of formic acid concentration on Ba++/Ba+ and CeO+/Ce+
ratios. (a) Without CRI and (b) with CRI at 60 mL min-1 H
2. The solution
contained 10 µg L-1 of Ba and of Ce (RF power: 1.4 kW, nebulizer gas
flow rate: 1.0 mL min-1).
Figure 3. Effect of formic acid concentration on chloride polyatomic ions formation. (a) Without CRI and (b) with CRI at 60 mL min-1 H
2, for
a solution containing different concentrations of formic acid, 2% (v v-1)
HCl and 1% (v v-1) HNO
3 (RF power: 1.4 kW, nebulizer gas flow rate:
Nebulizer gas flow rate and RF applied power optimization
After choosing the optimum formic acid concentration, the optimization of the nebulizer gas flow rate and RF applied power was performed. The optimization of these plasma parameters is important because they can promote the formation of interfering polyatomic species depending on the set conditions.28 Nebulizer gas flow rate
optimization showed that signal intensities increased up to 1.05 L min-1 without using CRI, then decreased for higher
flow rates. When CRI was used, the signal intensities increased up to 0.95 L min-1, and then decreased, due to
the defocusing of the ion beam which results in decreased signal counts. Concerning RF applied power, better Se net signal intensities were obtained at 1.3 kW applied power without using the CRI. When using the CRI, an exponential increase in Se signal intensities was observed after 1.0 kW. Thus 1.4 kW was adopted for further measurements. The optimized nebulizer gas flow rate (1.05 L min-1 without CRI
and 0.95 L min-1 with CRI) and RF applied power (1.3 kW
without CRI and 1.4 kW with CRI) were employed for Se determination in bovine semen samples.
Analytical application
Preliminary sample solubilization tests were performed with concentrated formic acid. However, when using 50% v v-1 formic acid, it was observed complete samples
solubilization, and the addition of peroxide contributed to obtaining a clear solution. When concentrations lower than 50% v v-1 formic acid were employed, incomplete
solubilization was observed.
The optimized conditions for nebulizer gas flow rate and RF applied power were adopted for Se determination in semen samples. After freeze-drying and grinding, samples were solubilized in 50% v v-1 formic acid and diluted to
10% v v-1 formic acid (optimized conditions). This medium
was chosen to obtain the highest Se net signals and the lowest signals caused by polyatomic interferences.
Selenium concentrations determined using the developed procedure were compared with those obtained using microwave-assisted acid digestion of bovine semen due to the lack of certified reference material for this type of sample.
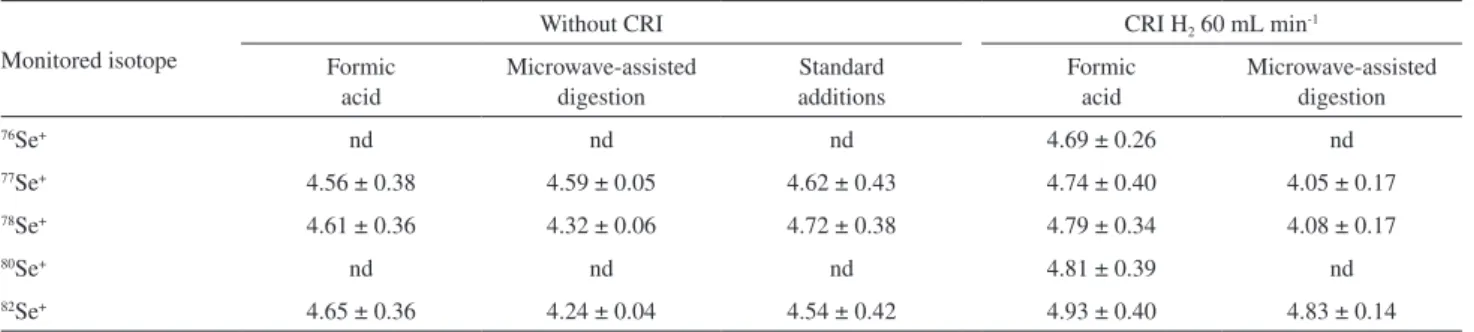
According to the Student’s t-test, all Se concentrations determined using solubilization in formic acid are in agreement with those obtained using microwave-assisted acid digestion at 95% confidence level, with or without using CRI. As it can be seen in Table 2, Se contents determined using different isotopes are also in agreement. Selenium isotopes 76 and 80 could not be determined without using CRI since they were strongly affected by interferences caused by 40Ar36Ar+ and 40Ar40Ar+,
respectively. The relative standard deviation (RSD) values for the formic acid procedure are higher than those observed for microwave-assisted acid digestion; however, this may be explained by temperature control in conductive water bath and enclosed vessel microwave oven. The complexity of the sample matrix inserted in the argon plasma may also explain these differences in repeatability.
Additionally, 40Ar37Cl+ was not a problem, since
according to Pereira et al.16 only samples with chloride
contents higher than 6.0 g L-1 interfered in Se determination.
Chloride concentration in cattle seminal plasma usually should not exceed 1.7 g L-1.29
Selenium concentrations in bovine semen samples from animals of different classes and breeds that are used in reproduction and artificial insemination programs varied from 0.5 to 0.8 µg m-1.2 Selenium concentrations in samples
of semen obtained from each of 12 young bulls (8 Angus and 4 Simmental) were determined by instrumental neutron activation analysis and the mean concentration was 0.461 ± 0.223 µg mL-1.30 Selenium contents found
in the literature are expressed in µg mL-1, which makes
comparison difficult, since here Se concentrations are expressed in mg Se kg-1. However, considering that semen
contains around 90% of water,29 concentrations obtained
in the present study are comparable to literature contents.
Table 2. Determination of Se (mg kg-1) in one bovine semen pool sample (mean values and standard deviations, n = 3)
Monitored isotope
Without CRI CRI H2 60 mL min-1
Formic acid
Microwave-assisted digestion
Standard additions
Formic acid
Microwave-assisted digestion
76Se+ nd nd nd 4.69 ± 0.26 nd
77Se+ 4.56 ± 0.38 4.59 ± 0.05 4.62 ± 0.43 4.74 ± 0.40 4.05 ± 0.17
78Se+ 4.61 ± 0.36 4.32 ± 0.06 4.72 ± 0.38 4.79 ± 0.34 4.08 ± 0.17
80Se+ nd nd nd 4.81 ± 0.39 nd
82Se+ 4.65 ± 0.36 4.24 ± 0.04 4.54 ± 0.42 4.93 ± 0.40 4.83 ± 0.14
Also, it should be noted that the contents of selenium found in bovine semen are related to bovine breed and feeding (with or without Se supplementation).
Matrix effects were evaluated by comparing the slope of the external calibration curve in organic medium with the standard additions curve for Se isotopes, both without using CRI. No significant difference at 95% confidence level was observed from the slopes (Table 3) for all isotopes studied. Indeed, Se concentrations in bovine semen determined using external calibration are not different (at 95% confidence level) from those obtained by the standard additions method (Table 2). It may be inferred that there is no matrix effect.
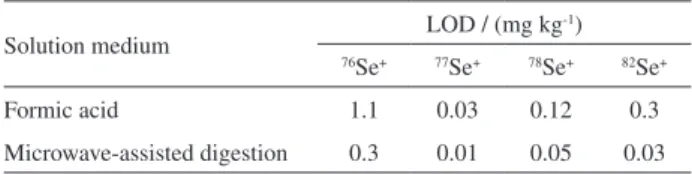
Limits of detection (LOD) were calculated considering background equivalent concentration (BEC), the signal-to-background ratio (SBR) and RSD for 10 measurements of a blank solution.31 The limits of
detection without CRI are shown in Table 4. LOD values with CRI strategy are not shown, once Se in bovine semen can be determined without CRI. It is noticed that the limits of detection obtained using 10% v v-1 formic acid
were slightly higher or similar to those obtained using microwave-assisted acid digestion. A possible explanation concerns the fact that formic acid solution used was not ultrapure or sub-boiled as nitric acid reagent used in microwave-assisted acid digestion. Moreover, the digestion in the microwave oven takes place in a closed system, which reduces the risks of further contaminations. Also, the use of a high carbon matrix in the plasma also improves de background equivalent concentration which increases the limit of detection for the formic acid procedure. However, LODs obtained using the formic acid developed procedure is compatible with Se determination in semen samples.
Conclusions
Diluted formic acid solution (50% v v-1) was effective
for sample preparation of bovine semen, and it acted as a carbon source that increased Se net signals due to charge transfer reactions. The use of diluted formic acid (10% v v-1) solution as carbon source may be recommended
when improvement in sensitivity is needed, and this strategy becomes more attractive due to its simplicity and effectiveness for sample preparation. It was demonstrated that Se could be accurately determined in semen samples by ICP-MS without using the CRI.
Acknowledgments
The authors are grateful to grants and fellowships provided by São Paulo Research Foundation (FAPESP, grant 2006/59083-9), Conselho Nacional de Desenvolvimento Científico e Tecnológico (CNPq, Instituto Nacional de Ciências e Tecnologias Analíticas Avançadas, grants 573894/2008-6 and 401047/2014-8) and Coordenação de Aperfeiçoamento de Pessoal de Nível Superior (CAPES).
References
1. Shi, L.; Zhang, C.; Yue, W.; Shi, L.; Zhu, X.; Lei, F.; Anim. Feed Sci. Technol. 2010, 157, 104.
2. Aguiar, G. F. M.; Batista, B. L.; Rodrigues, J. L.; Luccas, P. O.; Barbosa Jr., F.; J. Braz. Chem. Soc. 2012, 23, 573.
3. Shalini, S.; Bansal, M. P.; Int. J. Androl. 2007, 31, 438. 4. Sánchez-Gutiérrez, M.; García-Montalyo, E. A.; Izquierdo-Veja,
J. A.; Del Razo, L. M.; Cell Biol. Toxicol. 2008, 24, 321. 5. Azevedo, F. A.; Chasin, A. A. M. In Metais: Gerenciamento da
Toxicidade; Azevedo, F. A.; Chasin, A. A. M., eds.; Atheneu: São Paulo, 2003, p. 255.
6. Balic, M.; Milinkovic-Tur, S.; Samardžija, M.; Vince, S.; Theriogenology 2012, 78, 423.
7. Li-Guang, S.; Ru-Jie, Y.; Wen-Bin, Y.; Wen-Juan, X.; Chun-Xiang, Z.; You-She, R.; Lei, S.; Fu-Lin, L.; Anim. Reprod. Sci. 2010, 118, 248.
8. Stradaioli, G.; Sylla, L.; Monaci, M.; Maiorino, M.; Theriogenology 2009, 72, 91.
9. Silva, C.; Monteiro, M. L. G.; Ribeiro, R. O. R.; Guimarães, C. F. M.; Mano, S. B.; Pardi, H. S.; Mársico, E. T.; Rev. Bras. Ciênc. Vet. 2009, 16, 33.
10. Moraes, S. S.; Tokarnia, C. H.; Döbereiner, J.; Pesqui. Vet. Bras. 1999, 19, 47.
11. Silva, C. S.; Nunes, A. M.; Oreste, E. Q.; Acunha, T. S.; Vieira, M. A.; Ribeiro, A. S.; J. Braz. Chem. Soc. 2012, 23, 1623. 12. Tormen, L.; Gil, R. A.; Frescura, V. L. A.; Martinez, L. D.;
Curtius, A. J.; Spectrochim. Acta, Part B 2010, 65, 959. Table 3. Slopes obtained with external calibration curve in organic
medium and standard additions method for the selenium isotopes (both without CRI)
Calibration method 77Se+ 78Se+ 82Se+
External calibration 2016 5874 2490
Standard addition 1970 5776 2459
Table 4. Limits of detection (LOD) for Se isotopes using formic acid procedure and microwave-assisted acid digestion without CRI
Solution medium LOD / (mg kg
-1)
76Se+ 77Se+ 78Se+ 82Se+
Formic acid 1.1 0.03 0.12 0.3
13. Scriver, C.; Kan, M.; Willie, S.; Soo, C.; Birnboim, H.; Anal. Bioanal. Chem. 2005, 381, 1460.
14. Tormen, L.; Gil, R. A.; Frescura, V. L. A.; Martinez, L. D.; Curtius, A. J.; Anal. Chim. Acta 2012, 717, 21.
15. Latimer Jr., G. W.; AOAC International; Official Methods of Analysis of AOAC International, 19th ed.; AOAC International:
Gaithersburg, 2012.
16. Pereira, C. D.; Garcia, E. E.; Silva, F. V.; Nogueira, A. R. N.; Nóbrega, J. A.; J. Anal. At. Spectrom. 2010, 25, 1763. 17. Blades, M. W.; Caughlin, B. L.; Spectrochim. Acta, Part B 1985,
40, 579.
18. Kreuning, G.; Maessen, F. J. M. J.; Spectrochim. Acta, Part B 1989, 44, 567.
19. Pettine, M.; Casentini, B.; Mastroianni, D.; Capri, S.; Anal. Chim. Acta 2007, 599, 191.
20. Larsen, E. H.; Stürup, S.; J. Anal. At. Spectrom. 1994, 9, 1099. 21. Krushevska, A.; Nóbrega, J. A.; Waheed, S.; Barnes, R. M.;
Amarisiriwardena, D.; Appl. Spectrosc. 1998, 52, 205. 22. Colon, M.; Hidalgo, M.; Iglesias, M.; J. Anal. At. Spectrom.
2009, 24, 518.
23. Bednar, A. J.; Kirgan, R. A.; Jones, W. T.; Anal. Chim. Acta 2009, 632, 27.
24. Hu, Z. C.; Hu, S. H.; Gao, S.; Liu, Y. H.; Spectrochim. Acta, Part B 2004, 59, 1463.
25. Kovačevič, M.; Goessler, W.; Spectrochim. Acta, Part B 2005, 60, 1357.
26. Allain, P.; Jaunault, L.; Mauras, Y.; Mermet, J. M.; Delaporte, T.; Anal. Chem. 1991, 63, 1497.
27. Bianchi, S. R.; Amais, R. S.; Pereira, C. D.; Salazar, R. F. S.; Nóbrega, J. A.; Nogueira, A. R. A.; Anal. Lett. 2012, 45, 2845. 28. Vaughan, M. A.; Horlick, G.; Appl. Spectrosc. 1986, 40, 434. 29. Garner, D. L.; Hafez, E. S. E. In Reproduction in Farms Animals,
7th ed.; Hafez, E. S. E.; Hafez, B. eds.; Linpincott Willians &
Wilkins: Baltimore, USA, 2000, ch. 7.
30. Heimann, E. D.; Smith, M. F.; Morris, J. S.; Gall, T. J.; Elmore, R. G.; Morrow, R. E.; Anim. Reprod. Sci. 1984, 7, 315. 31. Thomsen, V.; Schatzlein, D.; Mercuro, D.; Spectroscopy 2003,
18, 112.
Submitted: December 21, 2016