ISSN 0104-6632 Printed in Brazil
www.abeq.org.br/bjche
Vol. 33, No. 02, pp. 361 - 372, April - June, 2016 dx.doi.org/10.1590/0104-6632.20160332s20140089
*To whom correspondence should be addressed
Brazilian Journal
of Chemical
Engineering
ADSORPTION PROCESS OF MOLECULARLY
IMPRINTED SILICA FOR EXTRACTION OF
LACTOSE FROM MILK
A. L. Balieiro
1, R. A. Santos
1, M. M. Pereira
3, R. T. Figueiredo
1, L. S. Freitas
2,
O. L. S. de Alsina
1, A. S. Lima
1and C. M. F. Soares
1*1Institute of Technology and Research, Tiradentes University,
Av. Murilo Dantas 300, 49032-490, Sergipe, Brazil. E-mail: [email protected]
2
Department of Chemistry, Federal University of Sergipe, Rod. Marechal Randon s/n, Jardim Rosa Elze, CEP: 49100-000, São Cristóvão - SE, Brazil.
3
Department of Chemistry, (CIECO), Aveiro University, 3810-193, Aveiro, Portugal.
(Submitted: October 2, 2014 ; Revised: March 6, 2015 ; Accepted: March 10, 2015)
Abstract - In Brazil, about 25–30% of the population has some degree of intolerance to lactose, a disorder associated with the inability of the body to digest lactose due to a disability or absence of the enzyme lactase. The goal of this study was to evaluate the performance of adsorption of lactose from fresh milk using a fixed bed column of molecularly imprinted polymer (MIP). The polymeric material was characterized using Scanning electron microscopy (SEM) analysis, thermal analysis (e.g., differential scanning calorimetric (DSC) and thermogravimetric analysis (TGA), Fourier Transform Infrared Spectroscopy (FTIR), and the method of Braunauer, Emmet and Teller (BET). The adsorption column dynamics and performance were studied by the breakthrough curves using a 24-1 fractional factorial design. The chemical and structural characterization of the pure matrix and imprinted polymers confirmed the molecularly imprinted polymer (MIP) imprinted with lactose. The highest capacity was 62.21 mgg-1, obtained at 307.1 K and a flow rate of 12.5 mL.min-1, with central point conditions, 320.1 K and 9 mL.min-1, with an average value of 50.9 mg.g-1.
The results indicate that the molecularly imprinted polymer is efficient.
Keywords: Adsorption; Lactose; Molecularly imprinted polymers; Nanotechnology.
INTRODUCTION
Lactose is one of the carbohydrates in milk. The consumption of more than 20–50 g of lactose on an empty stomach by lactase-deficient individuals causes symptoms of lactose intolerance. Lactose, which is not absorbed in the small intestine, passes into the colon in individuals without the ability to digest it (Brown-Esters et al., 2012). Milk is a typical oil-in-water (o/w) emulsion, with fat globules, sugar and pro-teins (Manzi and Pizzoferrato, 2011). Therefore, new technologies have been developed for the production of milk products with low lactose content in order to
satisfy the need for people suffering from lactose intolerance (Relpius, 2008). Different methods have recently been proposed in order to remove lactose from milk, as such lactose hydrolysis, capillary elec-trophoresis, ultrafiltration, and ion-exchange chro-matography (Navarro et al., 2014; Bargeman, 2003; Marín-Navarro et al., 2014; Harju, 2007; Mohammad
Brazilian Journal of Chemical Engineering
2014; Escobar and Santos, 2014; Dickert and Lieberzeit, 2006; Turner et al., 2006; Bossi et al., 2007; Bergmann and Peppas 2008; Kryscio and Peppas, 2012; Whitcombe et al., 2011).
One potential approach for producing silica-based imprinted materials is the sol–gel process. In this strategy, the template reacts with the precursor (e.g., tetraethylorthosilicate – TEOS), which produces a silica network with the encapsulated molecule such as cholesterol or a protein (Li et al., 2014; Soares et al., 2007). This method has been successfully ap-plied for the direct synthesis of an imprinted meso-porous adsorbent for selective recognition of bio-molecules (Morais et al., 2013). In recent years, the potential for molecularly imprinted polymers (MIPs) to impact on these technological areas has stimulated intense activity at hundreds of research centres and companies across the world in order to capitalize on the attributes of these “smart” materials (Li et al., 2014; Seolatto et al., 2009; Dawson et al., 2012).
From this latter perspective, it seems interesting to use innovative processing for the extraction of lactose from milk using an adsorption process with molecularly imprinted silica. In this technique for adsorption, the process uses molecularly imprinted silica particles that have specific recognition sites for the separation of lactose from multicomponent mix-tures. The adsorption process for extraction of lac-tose from milk has not been studied and new studies with this innovative process are necessary. In the adsorption process with molecularly imprinted silica, recovery is possible. So it is still possible to improve the economic viability of the process by extraction of lactose from milk and lactose recovery.
In this study, we attempted to synthesize a new MIP, MP and MIP-LAC. The materials were prepared through self-hydrolysis, self-condensation, and co-condensation of tetraethoxysilane (TEOS). The struc-tural characteristics and adsorption properties of the polymers, including nitrogen adsorption–desorption analysis, thermogravimetric analysis and scanning electron microscopy, are described and discussed in detail. To evaluate the adsorption of lactose in a fixed bed of the MIP, we used a fractional factorial design (24-1) to assess the influence of operational variables: temperature, flow rate, particle size and height of the bed column.
EXPERIMENTAL Materials
Bovine milk samples were obtained from dairy producers in the Basin of Nossa Senhora da Gloria,
located in northeastern Brazil in the western part of the State of Sergipe in the micro-region of the hinter-land of the San Francisco River. They were stored under refrigeration at the Food Research Laboratory of the Institute of Research and Technology.
The silane precursor tetraethylortosilicate (TEOS) from Sigma Chemical Co. (St. Louis, MO) was used without further purification as a precursor for pro-ducing the molecular imprinted polymer. Ethanol (pure>99%), ammonia (pure>28%), HCl (pure>36%), and lactose (pure>99%) were purchased from Sigma Aldrich. Solvents were standard laboratory grade and other reagents were purchased either from Aldrich Chemical Co. (Milwaukee, WI) or from Sigma Chemical Co.
Synthesis of the Pure Matrix and Imprinted Poly-mers
The MP, MIP, and MIP-LAC were prepared using the sol-gel process and tetraethoxysilane (TEOS) as raw material. For MIP and MIP-LAC, the TEOS and the target molecule (lactose) were dissolved in etha-nol utilizing methodology previously established by Soares et al. (2007), with adaptations. The steps were as follows: pre-hydrolysis, hydrolysis, solid material synthesis through gelation for 18 h, extrac-tion (washing) and drying at 277.2 K. In the case of MIP, complete removal of lactose was performed in a washing step, while in the synthesis of MIP-LAC, no removal of the biomolecule (lactose) was per-formed. For the MP no target molecule (lactose) was included in the process (pre-hydrolysis, hydrolysis, solid material synthesis through gelation for 18 h, washing and drying at 277.2 K) in order to obtain the solids.
Characterization of Lactose, MP, MIP and MIP-LAC
Fourier Transform Infrared Spectroscopy (FTIR)
The solid samples were submitted to Fourier Trans-form Infrared Spectroscopic analysis (FTIR Spectro-photometer MB-3000). Each sample was mixed with 100 x KBr to prepare the pellets. The spectra were obtained in the wavelength range of 400–4000 cm–1 to evaluate the printing of the biomolecule (lactose).
Thermogravimetric Analysis (TGA)
Adsorption Process of Molecularly Imprinted Silica for Extraction of Lactose from Milk 363
Brazilian Journal of Chemical Engineering Vol. 33, No. 02, pp. 361 - 372, April - June, 2016
over the range of 303–1273.2 K, with a heating rate of 10 K.min-1, using nitrogen as the purge gas and a gas flow of 50 mL.min-1. To eliminate sources of error that could arise from the presence of residual reactants, weight loss was only considered for tem-peratures above 403.1 K. The percentage of the grafted material was calculated using Equation (1):
100
Grafted material %
i
wi wf
w (1)
in which wi and wf are the initial and final weight of the sample, respectively, the first taken at 403.2 K and the latter at 1273.2 K.
Differential ScanningCalorimetry
Thermal behaviour was studied using a Differen-tial Scanning Calorimeter Autosampler System (TA Instruments, New Castle, DE). Approximately 5 mg of the sample was weighed in an aluminium pan under a nitrogen atmosphere and thermograms were recorded using a heating rate of 10 K.min-1 up to a temperature of 773.1 K. Glass transition values (Tg) were taken as the midpoint of the transition in the second scan of the DSC thermograms.
Scanning Electron Microscopy (SEM)
The morphology of the samples of MP, MIP, standard lactose LAC and MIP-LAC was investi-gated using scanning electron microscopy. Carrier particle size and surface roughness were visually assessed using a scanning electron microscope (SEM; Hitachi S4100, Zeiss, Germany). Prior to SEM, ap-proximately 20 nm of platinum were deposited onto the particles via sputter coating.
Specific Surface Area and Porous Properties
The surface areas of the LAC, MP, MIP, and MIP-LAC were calculated using the Brunauer–Em-mett–Teller method. Pore volume and average pore diameter were calculated based on the model devel-oped by Barret, Joyner and Halenda (BJH) for mi-croporous samples by the t-method. Surface areas were evaluated according to their N2 adsorption at 77K using the BET apparatus software (Model NOVA 1200e – Surface Area & Pore Size Analyzer, Quantschrome Instruments – version 11.0). Prior to analysis, samples were submitted to a thermal treat-ment at 393.1 K for 48 h to eliminate any water ex-isting within the pores of the solids.
Methods
Analysis Determination Lactose
The calibration curve and measurement of lactose were performed by High Performance Liquid Chro-matography (HPLC) using a liquid chroChro-matography (Shimadzu), ELSD detector (ELSD-LT II) and soft-ware (program Shimadzu LC Solution version 4.5.). The concentration of the standard solution of lactose ranged from 30 to 300 ppm. For processing the data, the analytical column used was a Luna NH2 (250mm x 4.6 mm) (Phenomenex). The mobile phase con-sisted of acetonitrile and ultrapure water (50:50) at a flow rate of 1.5 mL.min-1, with an analysis time of 10 min. For the determination of lactose from milk samples: 30 µL samples were diluted in a 2 mL volu-metric flask in ultrapure water and then the samples were filtered through a 0.45 Millipore membrane and subsequently injected into the equipment (Bühring and Hinrichs, 2011).
Adsorption Experiments
The experiment was conducted under continuous flow in a jacketed column packed with the MIP ad-sorbent. The glass column was 20 cm in length with an internal diameter of 2.5 cm. The jacket input and output were connected to a thermostatic bath to guar-antee constant control of temperature in the column. At the base of the column sintered glass wool was used to avoid that small particles of the adsorbent contaminated the remainder of the experimental unit. The bed porosity was determined experimentally by pycnometry and was equal to 0.5 ± 0.03. However, it was observed that under the operating conditions a significant compaction of the bed occurred, possibly due to the downward direction of flow. In view of this, we chose to determine the dynamic porosity by direct measurement of the volume of milk retained in the interstices for various operating conditions, yield-ing a porosity equal to 0.09 ± 0.005. The compactyield-ing effect occurred before the start of the experiment during the flooding of the column with water. Thus, throughout the experiment the bed features remained constant (bed height and porosity).
Brazilian Journal of Chemical Engineering
The effect of operational variables on the adsorp-tion of lactose in the packed column was studied by a fractional factorial design (24-1) with four independ-ent variables (flow rate, temperature, particle size and bed height) and adsorption capacity (q0) as de-pendent variable. Three replicates at the centre point were included according to Table 1.
Table 1: Codified and uncoded values of the input factors.
Operating variable -1 0 +1
X1 (temperature, K) 307.1 320.1 333.1
X2 (particle size, mesh) 32 42 60
X3 (bed height, cm) 7.5 10 12.5
X4 (flow rate, mL.min-1) 3 6 9
The adsorption capacity q, expressed as mg of lactose per g of adsorbent, was obtained from the breakthrough curve for each run by means of Equa-tion (2).
2 0
0
0 o 4
tVCo VC q m επD Cdt H
C Co C (2)
where: V- flow rate, ε - porosity, q0 - adsorption
ca-pacity, C0 - initial concentration, C - final concen-tration, H - height, m - mass of adsorbent, and t - time.
RESULTS AND DISCUSSION
The aims of our work were to evaluate the perfor-mance of lactose adsorption from fresh milk using a fixed bed column of MIP. However, it was necessary to study the structures of the polymers obtained by molecular imprinting in order to evaluate the mo-lecular assembly formed by the inclusion complex of lactose in the polymer used as a template for the molecular imprinting. The structures of LAC and the three polymers MP, MIP, MIP-LAC were character-ized by FT-IR spectroscopy, Thermogravimetric analy-sis (TGA), Differential Scanning Calorimetry (DSC), Scanning Electron Microscopy (SEM) and for the specific surface area and porous structure by N2 phy-sisorption. Afterward, the imprinting effect of the MIP was studied by analysing the adsorption of lactose in fresh milk using a fixed bed column of the MIP.
Chemical and Structural Characterization of the Pure Matrix and Imprinted Polymers
One of the main aims of the chemical and struc-tural characterization of lactose, the pure matrix and the imprinted polymers was to provide a set of uni-fied criteria or conditions to assist in verifying the potential for imprinting of lactose, together with testing the adsorption capacity of the MIP for lac-tose. Recently, the relationships between chemical characteristics and imprinting properties have been examined using Fourier transform infrared (FTIR) spectra for biomolecules and polymers before and after imprinting (Ibrahim, et al., 2009; Wanyika et al., 2011).
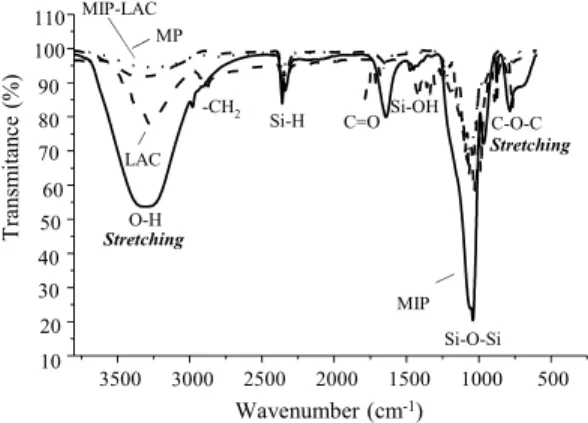
Figure 1: FT-IR spectra of the standard lactose
(LAC), pure matrix (MP), molecularly imprinted polymer (MIP), molecularly imprinted polymer with lactose (MIP-LAC).
Characteristic peaks in the FT-IR spectra for lac-tose in Figure 1 were assigned and compared accord-ing to the literature. We observed characteristic bands due to specific forms of lactose (Listiohadi et al., 2009; Kirk et al., 2007; Lei et al., 2010; Islam and Langrish, 2010). The characteristic band for α -lac-tose appeared at 920 cm-1, and those for β-lactose at 950 cm-1 and 833 cm-1 (Kirk et al., 2007; Listiohadi
et al., 2009). According to Lei et al., (2010), the bands present in the spectrum at 2925–2927 cm-1 correspond to metylene (-CH2) or aromatic com-pounds, bands at 1150–1030 cm-1 to intermolecular stretching of carbohydrates, bands at 800–1000 cm-1 to carbohydrates, and a band at 3200 cm-1 to inter-molecular stretching (Islam and Langrish, 2010). The presence of the C=O group was confirmed by its peak value at 1700 cm−1. It should also be observed that the characteristic stretching and bending fre-quencies of the C-O-C glycosidic bond (the bond
3500 2500 2000 1500 1000 500
10 20 30 40 50 60 70 80 90 100 110
Stretching
MIP-LAC
LAC MP
MIP Si-O-Si C=O
-CH2
C-O-C
O-H
Si-H
Wavenumber (cm-1)
T
rans
m
it
an
ce
(%) Si-OH
Stretching
Adsorption Process of Molecularly Imprinted Silica for Extraction of Lactose from Milk 365
Brazilian Journal of Chemical Engineering Vol. 33, No. 02, pp. 361 - 372, April - June, 2016
linking the two sugar moieties) were present in both spectra (∼1100 and ∼800 cm−1) (Crisp et al., 2010).
The spectrum recorded in the pure matrix (MP) presents bands typical of the groups present in both polymeric networks on the surface. In the region around 3400 cm-1 are stretches of silanol hydroxyl groups and also of molecules adsorbed on the surface of the oxide through hydrogen bonding. A broad and intense band between 3300 and 3700 cm-1 is associ-ated with Si-OH groups and –OH stretching in H-bonded water, due to adsorption of water molecules on the surface of the pore channels (Hu et al., 2005). The band in the 1630 cm-1 region for deformations of water molecules can confirm the presence of water. The higher intensity of the broad band at 3435 cm-1 can be attributed to the water molecules in the space of the molecularly imprinted silica and molecularly imprinted polymer (MIP). This intensity was lowest for standard lactose (LAC), pure matrices (MP) and molecularly imprinted polymer with lactose (MIP-LAC), shown in Figure 1. The stretching vibration of the Si-OH groups was observed and the strong 1100 cm-1 bands were ascribed to Si-O-Si stretching vibra-tions, while the bands at 1628, 970, 804 and 460 cm-1 were attributed to SiO-H bending, Si-OH bending, SiO-H symmetrical stretching and Si-O bending vibrations, respectively (Wanyika et al., 2011). Water bands in the region 1630 cm-1 were attributed to deformation of hydroxyl groups, while the bands at 1494, 1439 and 1402 cm−1 were assigned to C–H deformation in the –CH2 of an ethoxy group (Ibra-him et al., 2009). The O-CH2 and CH3 vibrations observed at 1464 cm-1 and a band at 1260 cm-1 are due to the C-O-C asymmetric stretching vibration. The presence of these stretches indicates that the molecular imprinting reaction was actually consum-mated. Similarly, these bands are also present in the MIP-LAC polymer with less intensity, possibly due to the presence of some of the target molecules (LAC) still in the polymer.
The peak at about 960 cm-1, which corresponds to the stretching vibration of Si-O-H bonds, is very pronounced in the MIP sample, and this could be explained by the existence of a larger number of surface O-(H...H2O) groups bound to Si (Nikolić et al., 2010). Around 1700 cm-1 there are bands which are missing in MP, regarding C=O group stretches, which are strongly present in the MIP. The presence of these stretches possibly indicates that the molecu-lar imprinting was actually consummated.
The change in intensity of the band in the 3700-2900 cm-1 region (characteristic of the stretching of silane groups, Si-OH) and the bands in the 1630–
1110 cm-1 region for siloxane groups in Figure 1 for MIP were obviously caused by lactose.
Thermogravimetric Analysis (TGA)
Silica-based materials are extremely rigid due to the high degree of cross-linking found in the SiO2 network. This property is very important in the de-sign and synthesis of MIPs, as both the size and shape of the cavities created by the template must be retained after removal of the template. The high ther-mal stability of the sol–gel derived material provides an easy way to remove the template molecule using the high temperature calcination method (Lee et al., 2010). Figure 2 shows the TG curve and DTA lactose standard analyzed in a N2 atmosphere.
After examining the data, the Tg of lactose is nor-mally seen in the temperature range of 379.1–442.1 K. This lower Tg temperature was believed to be caused by the plasticization of the lactose by water, which is not lost during the fast scan. After the glass transi-tion, an exotherm associated with recrystallization is observed, and this is followed by two melting events. The two peaks are associated with the two forms of lactose that recrystallize from the post-Tg material. The first peak is the melting of anhydrous α-lactose, and the second peak is associated with β-lactose. It is also worth noting that recrystallization of the sample still occurs even at 773.1 K, and there is no loss of resolution of the melting of the two forms of crystal-line lactose (Hogan and Buckton, 2000).
As to TGA analysis of the samples, a dehydration occurred between 379.1 and 442.1 K, presumably due to the loss of surface water; melting between 497.5 and 549.1 K and a sequence of three consecu-tive stages of thermal decomposition of the lactose (exothermic, endothermic and exothermic). The ini-tial decomposition temperature occurred immedi-ately after the fusion. The step of carbonaceous resi-due formation ended at 913.1 K. A greater weight loss occurred in the second decomposition step, with a percentage close to 63.0% for LAC (Figure 2).
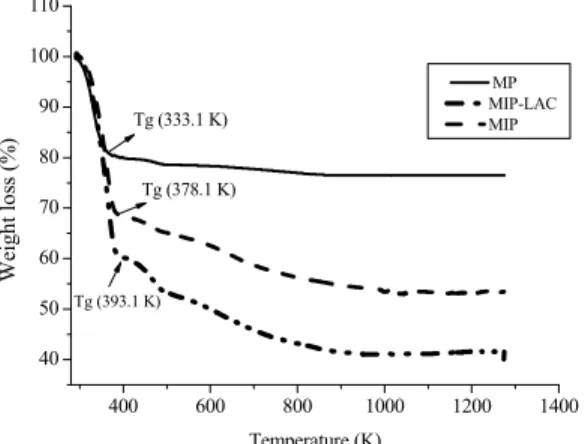
The mass losses of samples of MP, MIP, and MIP-LAC, were determined by thermogravimetric analysis (TGA) according to Figure 3.
The thermal stability of the samples was investi-gated by TGA analysis, whose results are plotted in Figures 2 and 3 as a function of temperature on the x-axis and percent weight loss on the y-axis. Weight loss occurred in all samples up to 400 K due to the loss of water, as shown in Figures 2 and 3.
Pre-Brazilian Journal of Chemical Engineering
sumably in this first stage part of this weight loss was due to the loss of surface water and also to the removal of water molecules that were not tightly bound to the silica matrix, in accordance with the literature (Wei et al., 1999; Mukherjee et al., 2009; Wanyika et al., 2011). At two other stages, the loss in weight at higher temperatures was ascribed to loss of surface silanol groups (Wanyika et al., 2011).
400 600 800 1000 1200 1400
0 20 40 60 80 100
TG DTA
Temperature (K)
TG
(%)
Tg (442.1 K)
-350 -300 -250 -200 -150 -100 -50 0 50 100
DT
A
(uV)
Figure 2: TG and DTA curves of lactose standard
analyzed in a N2 atmosphere.
400 600 800 1000 1200 1400
40 50 60 70 80 90 100 110
MP MIP-LAC MIP
Weigh
t lo
ss
(
%
)
Temperature (K)
Tg (333.1 K) Tg (378.1 K)
Tg (393.1 K)
Figure 3: TG curves in an atmosphere of N2 for the pure matrix (PM), molecularly imprinted polymer (MIP), molecularly imprinted polymer with lactose (MIP-LAC).
The weight of MIP declined sharply between 453.1 K and 473.1 K, which might corresponding to degradation of the carbon skeleton. Almost the entire weight was lost at 723.1 K. Analogously, the MIP-LAC had a similar weight loss trend with increasing temperature, until it became stable above 723.1 K with about 96% of the total weight loss. The differ-ence in weight loss between MIP-LAC and MIP (58% and 46%, respectively), was possibly caused by the removal of the target molecule (lactose),
con-firming the success of the molecular imprinting. Similar results were found by Mao et al. (2011) in evaluating a novel composite of graphene sheet/Congo red-molecular imprinted polymers (GSCR-MIPs).
In general, the three weight loss regimes observed in the TGA profiles most likely originate from: (i) moisture, due to the adsorbed water on the surface of the lactose or MP or MIP-LAC or MIP (293.1−353.1 °C); (ii) loss of lactose or MIP-LAC (373.1 at 473.1 K); (iii) decomposition plus dehydration of surface hydroxyl groups in the MP or MIP-LAC or MIP (>523.1 K) (Guo et al., 2003; Suteewong et al., 2012).
Differential Scanning Calorimetry (DSC)
The most common measurement of amorphous structures involves analysis of the glass transition by DSC. It is important to examine both the size of the transition in heat flow or heat capacity units and the temperature (Tg) at which it occurs. The size of the transition provides quantitative information about the amount of amorphous structure in the sample, and the temperature identifies the point where there is a dramatic change in its physical properties. Figure 4 shows an overlay of a number of DSC analyses from 273.1 to 773.1 K for lactose and the polymers. In each case an excellent glass transition was obtained.
The thermal curve of lactose was characterized by a strong dehydration endotherm with an onset tem-perature of 415.3 K, a peak temtem-perature of 417.6 K, and an enthalpy of dehydration equal to 149.7 J.g-1. This was followed by the lactose decomposition endotherm near 493.1 K. The DSC profile for lactose is shown in Figure 4. Theoretically, the thermal curve should only consist of the decomposition endotherm near 509.1 K, but the sample appears to contain a small contamination of the α-monohydrate phase as there is a residual endothermic peak near 401.1 K. Based upon the measured dehydration enthalpy of 18.9 J.g-1, the β-lactose contains about 12.6% α -monohydrate phase, (Kaialy et al., 2012).
Concerning the decomposition steps, the DSC analysis of lactose initially presented a peak corre-sponding to endothermic dehydration at 409.6 K with a heat of 13.2 J.g-1, followed by melting at 513.8 K with a heat of 103.3 J.g-1, and by two exo-thermic peaks at 578.1 and 605.1 K with heats of 34 and 67 J.g-1, respectively (Brittain and Blaine, 2007).
th o lo gr la p w en 3 co th o o ch tr th o te si th ti w o co w Hea t fl ow (mW ) F tr la p at te p L T cu he condensat f 479.1 K. A oss of water
roups and sil actose presen
ared with th what was obs The sampl ndothermic 38.1 K and ontaining lac hermic peak
f 764.3 J.g rganic matte hange cause rix was relate hermic peak,
This behav f water still er of hydrati ince it is po he surface of ion: “dispers water), “polar r by “chem ondense to f water) (Soare 300 -40 -30 -20 -10 0 Hea t fl ow (mW ) 338.1 K 364.3 J.g-1
423.1 K 764.3 J.g-1
Figure 4: DS rogen for lac arly imprinte
rinted polym
We observ ttributed to e er on the ge eak intensity LAC, possibl The informati urves for lac
Ad
Brazi
tion of silan At temperatu occurred du loxanes (Figu nted a highe
e porous sili erved in the le of pure ma
transition, w an enthalpy ctose (MIP-L
temperature g−1, associate er and loss o
d by the pre ed to the incr (764.3 J.g-1/ viour could present in th on,” and stro ssible that w f silica gel by sion forces” r forces” (e.g mical forces” form siloxan s et al., 2004
400 500 Tem 417 149 409.5 K 616.15 J.g-1
SC curves in ctose (LAC),
ed polymer ( mer with lacto
ved an endot evaporation el surface; m y was great ly due to th ion obtained ctose (LAC),
dsorption Process
ilian Journal of C
nol groups at ures above 4 e to condens ure 4). The po r water cont ica MIP, in a endothermic atrix (MP) sh with a peak of 364.3 J.g LAC) showe of 423.1 K a ed with dec f water. How esence of lac
rease in ener /423.1 K).
be associate he sample as ongly presen water can be
y different fo (e.g., phys ., hydrogen b ” (e.g., silan ne bonds with
4).
600 700 mperature (K) 7.6 K 9.7 J.g-1
n an inert atm pure matrix (MIP) and m ose (MIP-LA
thermic peak of molecula moreover, th ter for the he presence d in the DSC pure matrix
of Molecularly I
Chemical Enginee
t a temperat 473.1 K, furt sation of sila orous silica w tent when co accordance w c transition. howed only o
temperature g−1. The sam ed a first en and an entha composition wever, the m ctose in the m
rgy of the en
ed with the l s so-called “w
nt in the latti e maintained orces of inter sically bound
bounded wat nol groups t h the release
0 800 MP MIP-LAC MIP LAC mosphere of x (MP), mole
molecularly i AC).
k, which can ar adsorbed w
he endotherm curve of M
of the lacto C, TG and D x (MP), mole
mprinted Silica f
ering Vol. 33, No
ture ther anol with om-with one e of mple do-alpy of main ma- do-loss wa-ice, on rac-ded ter), that e of 900 ni- ecu- im-n be wa-mic MIP-ose. DTA ecu-lar pri suc sili Sc mo clu fro rou wh sili of sur Fig MI sen vo tur tur im ov as wi and (Fi MI of mo MI and lec Sp is
for Extraction of L
o. 02, pp. 361 - 3
rly imprinted inted polyme ccess of the ica, thus obta
canning Elec
The SEM a orphologies uding MP, M om the micro
us structure hich can even
ica gel (Oliv lactose par rface (Figure
gure 5: SEM
IP-LAC and
In Figure 5( nt, suggestin lved. On the re, the presen re favours ac mprint (Hua et
ver, widely di well as heter th predomina d spongy tex igure 5(c)). IP there are
the surface olecule) (Figu
IP and of M d these diff cular imprint
pecific Surfa
The nitroge a multilayer
Lactose from Mil
72, April - June,
d polymer (M er with lactos
molecular aining
silica-ctron Micros
analyses in F of the mesop MIP, and MIP
ographs that characteristi n be observe veira, 2009). rticles are d e 5(a)).
M micrograph (d) MIP.
(b) aggregate ng uniformit
e basis of se nce of pores ccessibility to
t al., 2011; P ispersed mic rogeneity wi antly spheric xtures molec However, in voids due po e after remo
ure 5(c)). Th MP or MIP-L ferences are ting of lactos
ace Area and
en adsorption r adsorption
lk
2016
MIP) and m se (MIP-LAC
imprinting o -based impri
scopy (SEM
Figure 5 sho porous silica P-LAC. It ca t the materia ic of this typ d in the SEM
For illustrat dense and h
hs of (a) LA
es of varying y in the par everal reports in the clear o the sites of Pradhan et al.
croparticles w ith regard to cal shapes of cularly printe n the micro ossibly to the oval of the l hus, the micr LAC are ent probably du se (Figure 5(b
d Porous Pro
n/desorption model that a
3
olecularly im C) confirm th of lactose in inted materia
M)
ow clearly th a obtained, i an be observe
als have a p pe of materia M literature f
tion, the form have a roug
C; (b) MP; (
g sizes are pr rticle sizes i s in the liter surface stru f the molecul
, 2009). Mor were observe particle shap f different siz ed with lacto ographs of th
e modificatio lactose (targ rographs of th
tirely differe ue to the m
b)-(d)).
operties
BET isother allows an est
ti-Brazilian Journal of Chemical Engineering
mate to be made of the number of adsorption sites in a monolayer and of the specific surface area of the sample. The molecularly imprinted polymer (MIP) generates binding cavities that are complementary to the original template in the pure matrix (MP) or the polymer molecularly imprinted with lactose (MIP-LAC). The structural parameters of the mesoporous silica obtained from the N2 adsorption data are shown in Table 2.
Table 2: Structural parameters of the mesoporous silica obtained from the N2 adsorption data.
Sample Surface area
(m2.g-1)
aPore volume
(cm3.g-1)
Pore diameter (Å)
MIP-LAC 437.8 0.6 50.0
MP 301.8 0.9 109.5
MIP 464.2 1.9 150.0
a
Pore volume calculated from nitrogen desorption.
Table 2 shows materials with pores diameter be-tween 50 to 150 Å. The pure matrix showed a low pore volume (0.9 cm3.g-1) and a narrow distribution of pore size (109.5 Å, Table 2) (Leofanti, 1998). After the addition of lactose, the matrix had a pore volume of (0.5 cm3.g-1), while the MIP pore volume (1.9 cm3.g-1), surface area and pore size significantly increased in comparison with the MIP-LAC sample (0.6 cm3.g, 50 Å, 437.8 m2.g-1), (MIP). Higher values were found by (Tominaga et al., 2005), where the authors synthesized mesoporous silica (MPSi) as a novel type of inorganic filler for polyether-based electrolytes, characterized the effect of the addition on ionic conduction and found a superficial area of 829 m2.g-1. An inferior pore size was found by Qu et al. (2006), who reported values of 2.7 and 2.1 nm.
In addition, Table 2 shows that the BET surface area gradually increases in matrices printed with lactose in the polymer structure, directly affecting
the porosity of the final product.
The BET surface areas of our materials (e.g., 464.2 m2.g-1) were comparable to those reported else-where, i.e., 594 m2.g-1 (Qu et al., 2006) for a similar material prepared using TEOS as the silica source. However, the pore size and pore volume of our mate-rial (e.g., 150 Å and 1.8 m3.g-1, respectively) were ex-tremely high compared to those reported for a similar mesoporous silica (e.g., 3.2 nm and 0.6 m3.g-1, respec-tively) made using TEOS (Hossain and Sayari, 2008). Therefore, the chemical and structural charac-terization of the pure matrix and imprinted polymers confirmed that the polymer was MIP with lactose. Next, we evaluated the adsorption of lactose from fresh milk using a fixed bed column packed with the MIP.
Adsorption of Lactose in a MIP Fixed Bed
The fixed bed adsorption process was studied in the non-steady state, with fresh milk and constant flow rate. In this way, the specific interactions be-tween analyte (lactose) and sorbent MIP revealed the adsorptive capacity in the process.
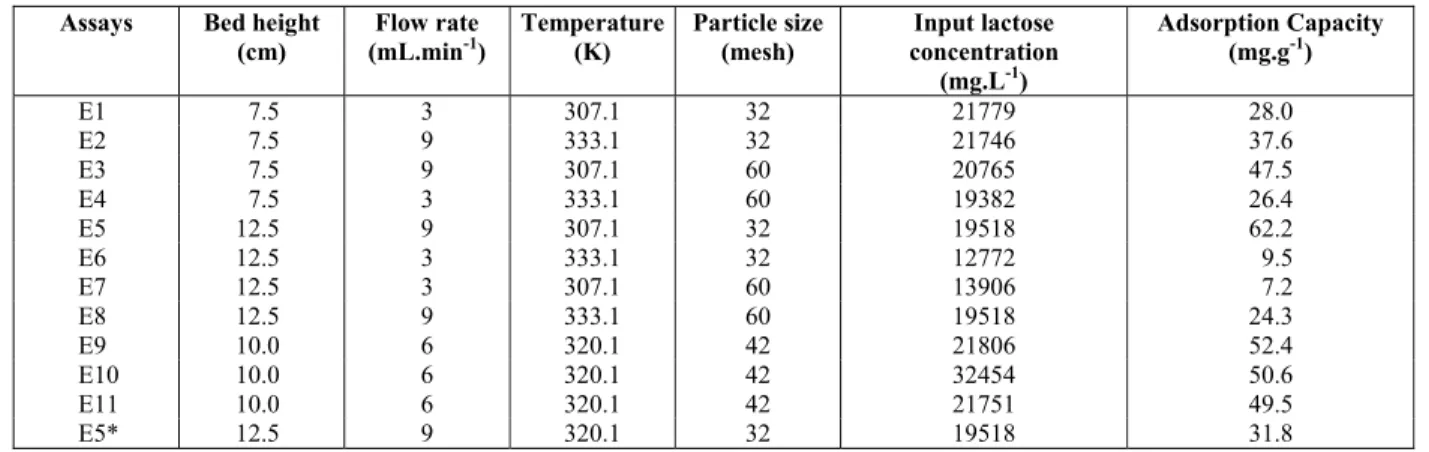
In Table 3 it can be observed that the highest ad-sorptive capacity of the MIP adsorbent was 62.2 mg.g-1, obtained in test E5, with a 12.5 cm bed, flow rate of 9 mL.min-1, temperature of 307.1 K and particle size corresponding to 32 mesh. This corresponded to central point conditions (height 10 cm, 6 mL.min-1, 320.1 K and 42 mesh) with an average value for the adsorptive capacity of 50.9 mg.g-1. Notice the good reproducibility of the central point triplicates. The lowest adsorptive capacity was found in the E6 and E7 runs, 9.5 mg.g-1 and 7.2 mg.g-1, respectively, both with 12.5 cm bed height and a 3 mL.min-1 flow rate, whereas the temperature was 333.1 K and 32 mesh in E6 and 307.1 K and 60 mesh in E7.
Table 3: Lactose adsorption experiments in a MIP fixed bed.
Assays Bed height
(cm)
Flow rate (mL.min-1)
Temperature (K)
Particle size (mesh)
Input lactose concentration
(mg.L-1)
Adsorption Capacity (mg.g-1)
E1 7.5 3 307.1 32 21779 28.0
E2 7.5 9 333.1 32 21746 37.6
E3 7.5 9 307.1 60 20765 47.5
E4 7.5 3 333.1 60 19382 26.4
E5 12.5 9 307.1 32 19518 62.2
E6 12.5 3 333.1 32 12772 9.5
E7 12.5 3 307.1 60 13906 7.2
E8 12.5 9 333.1 60 19518 24.3
E9 10.0 6 320.1 42 21806 52.4
E10 10.0 6 320.1 42 32454 50.6
E11 10.0 6 320.1 42 21751 49.5
E5* 12.5 9 320.1 32 19518 31.8
Adsorption Process of Molecularly Imprinted Silica for Extraction of Lactose from Milk 369
Brazilian Journal of Chemical Engineering Vol. 33, No. 02, pp. 361 - 372, April - June, 2016
Because fresh milk was used in the experiments, the lactose input concentration was an uncontrolled variable. The results in Table 3 could imply that the input concentration of lactose in the milk may influ-ence the adsorption capacity. This suggests that the mass transfer coefficients in the adsorbent in the fixed bed are concentration dependent, as the re-moval rate and adsorption capacity were affected by a change in concentration. This phenomenon had already been observed by other researchers, who evaluated the removal of Cr(III) in fixed bed col-umns in batch reactors using as adsorbent zeolite NaX (Barros et al., 2004; Silva et al., 2002; Ostro-ski, et al., 2011). Moreover, it is clear from the re-sults in Table 3 that the operational conditions have a large effect on the bed performance. In order to as-sess the extent and significance of these influences, a statistical approach was used to determine the effect of each variable, as well as the form and effect of each variable and their interactions. Typical values for the adsorption of lactose show the main signifi-cant factors in adsorption. The Pareto graph or bed adsorption capacity is shown in Figure 6.
Figure 6: Pareto chart of standardized effects for the adsorption of lactose in the MIP.
It can be observed from the Pareto diagram that the bed height and particle size are not significant variables for the bed adsorptive capacity at the 99% confidence level. The temperature (X1), flow rate (X4) and interaction of temperature with flow rate (X1:X4) were significant. The variable that most in-fluenced the adsorption of lactose was the flow rate. The positive sign in the variable means that passing from level -1 (3 mL.min-1) to level +1 (6 mL.min-1) increased the response factor; that is, the adsorption capacity increased with the flow rate. In contrast, the effect of temperature and its interaction with the flow rate are negative; an increase in this variable dimin-ishes the bed capacity. These results were not ex-pected, because it was anticipated that the adsorption
capacity would be dependent on the mass transfer mechanism. This could be due to elution by the milk flowing across the column causing the partial de-sorption of lactose, which becomes more important for longer residence times. This was confirmed in long runs, where the effluent concentration was higher than the input lactose concentration.
Upon completion of the analysis of the experi-mental results obtained from the evaluation of the response surface (Figure 7), the interaction between temperature and flow rate can be observed such that, when the temperature is reduced and the flow rate is increased, the adsorption capacity also increases, justifying that these variables had significant influ-ence on the adsorption capacity of lactose.
> 50 < 42 < 32 < 22 < 12 306310
314318 322326
330334
T (K) 2
3
4
5 6 7
8 9
10
Q (m L/m
in) 0 10 20 30 40
50 60 70
q
o
(m
g/
g)
Figure 7: Response surface showing the adsorption capacity in relation to flow and temperature variables.
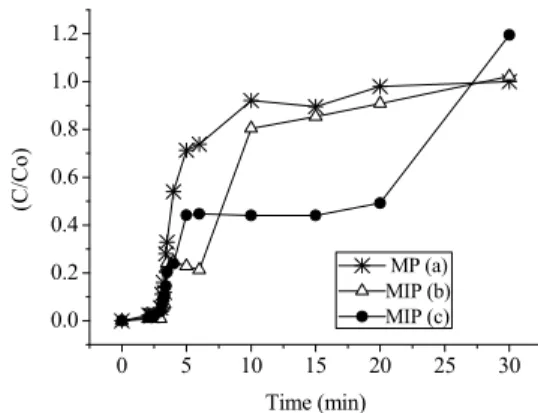
Selective recognition studies of lactose were eval-uated in Figures 8(a) to 8(c), in the illustrated break-through curves for the pure matrix (8a), the central point run (8(b)) and optimal conditions with higher adsorption capacity 8(c).
From Figure 8(b) and (c) it can be observed that the MIP breakthrough curves present a region of constant output concentrations, with C/Co= 8.7 at t=7 min (b) and C/Co=4.7 at t=4.2 min (c), respectively, followed by a region where C/Co increases until bed saturation. This behaviour was also observed in the other runs performed with MIP adsorbent, unlike the experiment with the unprinted polymer, which did not present a constant output concentration plateau. This difference between the MIP and pure matrix breakthrough curves could be due to a preferential distribution of the sites of specific recognition in more accessible positions within the adsorbent parti-cles of the MIP, which could be responsible for the presence of the plateau region. From these studies it -5,96
7,79 -8,34
-9,50 -11,39
-11,74
21,08 24,06
p=,01
1by3 (2)G (mesh) (3)H (cm) 1by2 (1)T (K) 1by4 Curvatr.
(4)Q (mL/min) 24.06
21.08 -11.74
-11.39 -9.50 -8.34 7.79 -5.96
Brazilian Journal of Chemical Engineering
is possible to operate the column by choosing appro-priate operational conditions of flow rate and tem-perature, for systems of fixed bed adsorption depend-ing on the level of lactose final concentration.
0 5 10 15 20 25 30
0.0 0.2 0.4 0.6 0.8 1.0 1.2
(C
/C
o
)
Time (min)
MP (a) MIP (b) MIP (c)
Figure 8: Breakthrough curves for lactose
adsorp-tion in fixed bed: (a) MP : non- imprinted polymer: T= 307.1 K; Q=9 mL.min-1; H= 12.5 cm; d= 32 mesh; (b) MIP: T= 320.1 K; Q= 6 mL.min-1; H=10 cm; d=42 mesh; (c) MIP: T=307.1 K; Q=9 mL.min-1; H=12.5 cm; d=32 mesh.
In fact, Figure 8 suggests that it is possible to ob-tain 100% lactose removal during 3 min, 80% be-tween 3 and 6 min for the MIP (b) conditions or 60% for the MIP (c) conditions. These considerations on a laboratory scale suggest that it would be advanta-geous to execute the column adsorption process and lactose recovery on a large scale.
The results obtained for the breakthrough curves show that an increase in feed flow rate implies a larger volume of solution per unit time passing through the column, thus providing a shorter operation time, i.e., the adsorbent will saturate faster with increasing flow rate, as can be seen in Figure 8.
The experimental matrix and results for adsorp-tion capacity are shown in Table 3. It can be seen from this table, comparing experiments E5 and E10, that the molecular impression leads to a higher ad-sorptive capacity of the modified polymer, from 62.2 to 52.4 mg.g-1. This was expected because the pres-ence of specific recognition sites improves the selec-tivity of the adsorbent. In the present work, the ex-tent of this promising improvement justifies the pro-cess and encourages us to pursue further research.
CONCLUSIONS
The methodology employed, based on silica-based matrices prepared by the sol-gel process, was shown to be efficient. We confirmed the molecular
imprint of lactose in the polymer (MIP) by chemical and structural characterization of the pure matrix and the imprinted polymers. The feasibility of lactose removal by adsorption of lactose by the molecularly imprinted polymer was verified and the process was found to be very favourable. The adsorption ap-peared to require only a relatively short contact time, with the most effective polymer requiring just one hour to reach equilibrium. The results showed that the adsorption process was strongly influenced by temperature and flow. The information obtained in this study can be applied to predict design parame-ters in systems of fixed bed adsorption. This work is therefore an important step towards the concentration and selective separation of lactose from milk.
ACKNOWLEDGMENTS
We acknowledge financial assistance from the Co-ordenação de Aperfeiçoamento de Pessoal de Ensino Superior (CAPES), Conselho Nacional de Desenvol-vimento Cientifico e Tecnológico (CNPq) and Finan-ciadora de Estudos e Projetos (FINEP). A.L.B. also acknowledges Professor João Coutinho, CICECO, Universidade de Aveiro, for extending necessary in-frastructure and laboratory facilities.
REFERENCES
Bargeman, G., Separation technologies to produce dairy ingredients, rozdz. 17 w: Dairy processing: Improving quality pod red. In: G. Smith (Ed.), Cambridge, UK, Woodhead Publishing Limited, p. 366-387 (2003).
Barrett, E. P., Joyner, L. G., Halenda, P. P., The deter-mination of pore volume and area distributions in porous substances. I. Computations from nitrogen isotherms. Journal of the American Chemical So-ciety, p. 73, 373-380 (1951).
Barros, M. A. S. D., Silva, E. A., Arroyo, P. A., Tavares, C. R. G., Schneider, R. M., Suszek, M., Sousa-Aguiar, E. F., Removal of Cr(III) in the fixed bed column and batch reactors using as ad-sorbent zeolite NaX. Chemical Engineering Sci-ence, p. 59, 5959-5966 (2004).
Bergmann, N. M. and Peppas, N. A., Molecularly imprinted polymers with specific recognition for macromolecules and proteins. Progress in Poly-mer Science, 33, p. 271-288 (2008).
Adsorption Process of Molecularly Imprinted Silica for Extraction of Lactose from Milk 371
Brazilian Journal of Chemical Engineering Vol. 33, No. 02, pp. 361 - 372, April - June, 2016
Brittain, G. H. and Blaine R. L., α-Monohydrate phase in lactose by differential scanning calo-rimetry. Thermal Analysis and Calorimetry, 68, p. 291-293 (2007).
Brown-Esters, O., Namara, Mc P., Savaiano, D., Dietary and biological factors influencing lactose intolerance. International Dairy Journal, 22, p. 98-103 (2012).
Bühring, R. S. W., Michel, R., Hinrichs, J., A new liquid chromatography method for the simultane-ous and sensitive quantification of lactose and lactulose in milk. Dairy Science & Technology, p. 27-37 (2011).
Crisp, J. L., Dann, S. E., Edgar, M., Blatchford, C. G., The effect of particle size on the dehydration/re-hydration behaviour of lactose. International Jour-nal of Pharmaceutics, 391, p. 38-47 (2010). Dawson, R., Cooper, A. I., Adams, D. J., Nanoporous
organic polymer networks. Progress in Polymer Science, 37, p. 530-563 (2012).
Dickert, F., Lieberzeit, P. A., Sensor technology and its application in environmental analysis. Biosci-ence, p. 50-63 (2006).
Guo, W., Park, J., Oh, M., Jeong, H. W., Cho, W., Kim, I., Ha, C., Copolymer synthesis of highly ordered large-pore periodic mesoporous organo-silicas with the aid of inorganic salts. Chemistry of Materials, 15, p. 2295-2298 (2003).
Harju, M., Chromatographic separation of lactose and its applications in the dairy industry. IDF Symposium Lactose & its Derivatives, 6, p. 14-16 (2007).
Hogan, S. E., Buckton, G., The quantification of small degrees of disorder in lactose using solution calorimetry. International Journal of Pharmaceu-tics, 207, p. 57-64 (2000).
Hossain, K., Sayari, A., Synthesis of onion-like meso-porous silica from sodium silicate in the presence of a,x-diamine surfactan. Microporous and Meso-porous Materials, 114, p. 387-394 (2008). Hu, Q., Hampsey, J. E., Jiang, N., Li, C., Lu, Y.,
Sur-factant-templated organic functionalized mesopo-rous silica with phosphino ligands. Chemistry of Materials, 17,p.1561-1569 (2005).
Hua, K., Zhang, L., Zhang, Z., Guo, Y., Guo, T., Surface hydrophilic modification with a sugar moiety for a uniform-sized polymer molecularly imprint for phenobarbital in sérum. Acta Bio-materials, 7, p. 3086-3093 (2011).
Ibrahim, M. N. M., Sipaut, C. S., Yusof, N. N. M., Purification of vanillin by a molecular imprinting polymer technique. Separation and Purification Technology, 6, p. 450-456 (2009).
Islam, M. I. U., Langrish, T. A. G., An investigation into lactose crystallization under high temperature
conditions during spray drying. Food Research International, 43, p. 46-56 (2010).
Kaialy, W., Larhrib, H., Martin, G. P., Nokhodchi, A., The Effect of Engineered Mannitol-Lactose Mixture on Dry Powder Inhaler Performance. Phar-maceutical Research, 29, p. 2139-2215 (2012). Kirk, J. H., Dann, S. E., Blatchford, C. G., Lactose:
A definitive guide to polymorph determination. International Journal of Pharmaceutics, 334, p. 103-114 (2007).
Kryscio, D. R., Peppas, N. A., Critical review and perspective of macromolecularly imprinted poly-mers. Acta Biomaterials, 8, p. 461-73 (2012). Lee, S. C., Chuang, F. L., Tsai, Y. L., Chen, H.,
Stud-ies on the preparation and propertStud-ies of sol-gel mo-lecularly imprint polymer based on tetraethox-ysilane for recognizing sulphonamides. Journal of Polymer Research, 17, p. 737-744 (2010). Lei, Y., Zhou, Q., Zhang, Y., Chen, J., Sun, S., Noda,
I., Studies on the preparation and properties of sol-gel molecularly imprint polymer based on tetraethoxysilane for recognizing sulphonamides. Journal of Molecular Structure, 974, p. 88-93 (2010).
Leofanti, G., Surface area and pore texture of cata-lysts. Catalysis Today, 41, p. 207-219 (1998). Li, S. J., Cao, S. S., Whitcombe, M. J., Piletsky, S.
A., Size matters: Challenges in imprinting macro-molecules. Progress in Polymer Science, 39, p. 145-163 (2014).
Listiohadi, Y., Hourigan, J. A., Sleigh, R. W., Steele, R. J., Thermal analysis of amorphous lactose and α-lactose monohydrate. Dairy Science & Technol-ogy, 89, p. 43-67 (2009).
Manzi, P., Pizzoferrato, L., HPLC determination of lactulose in heat treated milk. Food and Biopro-cess Technology, 6, p. 851-857 (2011).
Marín-Navarro, J., Talens-Perales, D., Oude-Vriel-ink, A., Cañada, F. J., Polaina, J., Immobilization of thermostable β-galactosidase on epoxy support and its use for lactose hydrolysis and galactooli-gosaccharides biosynthesis. World Journal of Mi-crobiology and Biotechnology, 30, p. 989-998 (2014).
Mao, Y., Bao, Y., Gan, S., Li, F., Niu, L., Electro-chemical sensor for dopamine based on a novel graphene-molecular imprint polymers composite recognition elemento. Biosensors and Bioelec-tronics, 28, p. 291-297 (2011).
Brazilian Journal of Chemical Engineering
Morais, E. C., Correa, G. G., Brambilla, R., Santos, J. H. Z., Fisch, A. G. J., Bioapplications for molecu-larly imprinted polymers. Journal of Separation Science, 36, p. 636-643 (2013).
Mukherjee, I., Mylonakis, A., Guo, Y., Samuel, S. P., Li, S., Wei, R. Y., Effect of nonsurfactant tem-plate content on the particle size and surface area of monodisperse mesoporous silica nanospheres. Microporous and Mesoporous Materials, 122, 168-74 (2009).
Nikolić, M., Giannakopoulos, K. P., Srdić, V. V., Synthesis and characterization of mesoporous síl-ica core-shell particles. Processing and Applsíl-ica- Applica-tion of Ceramics, 4, p. 81-85 (2010).
Oliveira, D. M. F., Synthesis and characterization of nanostructured metal oxides and their use in nano-composites with poly (vinyl alcohol). Thesis (State University of Maringa), Maringá (2009).
Oliveira, D. L., Wilbey, R. A., Grandison, A. S., Ro-seiro, L. B., Natural caprine whey oligosaccharides separated by membrane technology and profile evaluation by capillary electrophoresis. Food and Bioprocess Technology, 7, p. 915-920 (2014). Ostroski, I. C., Dantas, J. H., Sehn Canavesi, R. L.,
Silva, E. A., Arroyo, P. A., Barros, M. A. S. D., Es-tudo da remoção do íon Fe (II) em colunas de leito fixo, utilizando-se a Zeólita NaY. Acta Sci-entiarum Technology, Maringá, 33, p. 305-312 (2011). (In Portuguese).
Pradhan, S., Boopathi, M., Kumar, O., Baghel, A., Pandey, P., Mahato, T. H., Singh, B., Vijayara-ghavan, R., Molecularly imprinted nanopatterns for the recognition of biological warfare agent ri-cin. Biosensors and Bioelectronics, 25, p. 592-598 (2009).
Qu, F., Zhu, G., Huang, S., Li, S., Sun, J., Zhang, D., Qiu, S., Controlled release of Captopril by regu-lating the pore size and morphology of ordered mesoporous silica. Microporous and Mesoporous Materials, 92, p. 1-9 (2006).
Relpius, C., Lactase, an optimum enzyme for low lactose dairy products. Asia Pacific. Dairy Indus-try, p.24-27 (2008).
Seolatto, A. A., Câmara, M. M., Tavares, C. R., Cos-sich, E. S., Silva, E. A., Remoção de níquel(II) de soluções aquosas pela biomassa Sargassum fili
-pendula em múltiplos ciclos de sorção-dessorção. Acta Scientiarum Technology, 31, p. 57-64 (2009). (In Portuguese).
Silva, E. A., Cossich, E. S., Tavares, C. R. G., Filho, L. C., Guirardello, R., Modeling of copper(II) bio-sorption by marine alga Sargassum sp. in fixed bed. Process Biochemistry, 38, p. 791-799 (2002). Soares, C. M. F., Santos, O. A., Castro, H. F., Moraes, F. F., Zanin, G. M., Studies on immobi-lized lipase in hydrophobic sol-gel. Applied Bio-chemistry and Biotechnology, p. 113-116 (2004). Soares, C. M. F., Zanin, G. M., Moraes, F. F., Santos,
O. A. A., Castro, H. F., Molecular imprinting of -cyclodextrin/cholesterol template into a silica poly-mer for cholesterol separation. Journal of Inclu-sion Phenomena and Macrocyclic Chemistry, 57, p. 79-82 (2007).
Suteewong, T., Sai, H., Bradbury, M., Estroff, L. A., Gruner, S. M., Wiesner, U., Synthesis and for-mation mechanism of aminated mesoporous silica nanoparticles. Chemistry of Materials, 24, p. 3895-3905 (2012).
Tominaga, Y., Igawa, S., Asai, S., Sumita, M., Ion-conductive properties of mesoporous silica-filled composite polymer electrolytes. Electrochimica Acta, 50, p. 3949-3954 (2005).
Turner, N. W., Jeans, C. W., Brain, K. R., Allender, C. J., Hlady, V., Britt, D. W., From 3D to 2D: A re-view of the molecular imprinting of proteins. Bio-technology Progress, 22, p. 1474-1489 (2006). Wanyika, H., Gatebe, E., Kioni, P., Tang, Z., Gao, Y.,
Synthesis and characterization of ordered mesopo-rous silica nanoparticles with tunable physical properties by varying molar composition of rea-gents. African Journal of Pharmacy and Pharma-cology, 5, p. 2402-2410 (2011).
Wei, Y., Xu, J., Dong, H., Dong, J. H., Qiu, K., Preparation and physisorption characterization of d-glucose-templated mesoporous silica materials via base-catalyzed sol–gel process. Chemistry of Materials, 11,p.2023-2029 (1999).