Quim. Nova, Vol. 37, No. 4, 716-719, 2014
Nota Técnica
http://dx.doi.org/10.5935/0100-4042.20140115
*e-mail: [email protected]
PRELIMINARY DATA ON BRAZILIAN MONOFLORAL HONEY FROM THE NORTHEAST REGION USING FT-IR ATR SPECTROSCOPIC, PALYNOLOGICAL, AND COLOR ANALYSIS
Ligia Bicudo de Almeida-Muradiana,*, Renato J. Sousaa, Ortrud Monika Barthb and Peter Gallmannc
aDepartamento de Alimentos e Nutrição Experimental, Faculdade de Ciências Farmacêuticas, Universidade de São Paulo, Av. Prof.
Lineu Prestes 580, bloco 14, 05508-900 São Paulo – SP, Brasil
bInstituto Oswaldo Cruz, FIOCRUZ, Avenida Brasil 4365, 21040-900 Rio de Janeiro – RJ, Brasil
cSwiss Bee Research Centre/Agroscope Liebefeld-Posieux, Schwarzenburgstrasse 161, CH-14 3003 Bern, Switzerland
Recebido em 07/06/2013; aceito em 24/11/2013; publicado na web em 26/02/2014
Fourier transform infrared attenuated total reflectance (FT-IR ATR) spectroscopy was used to determine 14 different measurands in northeast Brazilian honey samples. Nine different honey samples (six monofloral and three polyfloral) from 2009 obtained from the company CEARAPI underwent FT-IR ATR, palynological, color, and sensorial analysis to obtain preliminary results for these types of honey. The results showed that there are five monofloral, three bifloral, and one extrafloral honey, and also that mid-infrared spectrometry can be used as a screening method for the routine analysis of Brazilian honey, with the advantages of being rapid, nondestructive, and accurate.
Keywords: honey; pollen analysis; FT-IR ATR.
INTRODUCTION
Infrared (IR) Spectroscopy deals with the infrared part of the electromagnetic spectrum. It measures the absorption of different IR frequencies by a sample positioned in the path of an IR beam. Currently, infrared spectroscopy is one of the most common spec-troscopic techniques used in the food industry. With the rapid de-velopment of infrared spectroscopic instrumentation software and hardware, the application of this technique has expanded into many areas of food research. It has become a powerful, fast, and nondes-tructive tool for food quality analysis and control. Fourier Transform (FT) Spectroscopy is an instrumental technique in which spectra are acquired based on measurements of electromagnetic radiation using time domain or space domain and a mathematical method (F T) is applied to convert the raw data to frequency domain. The main application of FT Spectroscopy is the acquisition of absorption spectra.1 IR is based on the absorption of electromagnetic radiation at
wavelengths in the range between 800 and 2500 nm. This technique has many advantages such as being rapid and nondestructive, and allows the determination of multiple measurands in a single step.2
Quantitative Infrared Spectroscopy is generally based on calibra-tions by partial least squares (PLS) regression between the spectra and the results obtained by physicochemical reference methods. Building the statistical model is relatively time consuming, and is only profitable if a large number of samples can be analyzed.2 In this
study, a previously published calibration was used,3 which had been
successfully used for predicting the physicochemical parameters in the quality control of stingless bee Brazilian honey.4
Infrared Spectroscopy of different monofloral honey samples and subsequent statistical analysis using principal component analysis (PCA) and linear discriminant analysis (LDA) showed that successful classification of the botanical origin of honey is possible. MIR (mid--infrared) spectroscopy has been successfully used for classification of monofloral European honey.2,5,6
Concerning honey, beyond quantitative analysis of different measurands, there is a practical need for measuring botanical
authenticity. Fourier transform infrared attenuated total reflectance (FT-IR ATR) spectroscopic technique was investigated for its fe-asibility for the identification of monofloral honey samples.7,8The
state of the art is that preliminary screening of honey types can be achieved by FT-IR techniques, but classic analysis such as melis-sopalynology and chemometrical as well as sensorial methods are required in the beginning to confirm the identification.9 Bogdanov et
al. reviewed the physicochemical methods for the characterization of European monofloral honey, but there is a need to characterize Brazilian honey as well.2
Color is the physical property most immediately perceived by consumers. In Europe, the price of honey depends on the honey color; generally the lightest ones are the costliest. Therefore, color is a useful and important parameter for classifying monofloral honey.2
The most commonly used method is based on optical comparison, using simple color grading, after Pfund.2,10
Hydroxymethylfurfural (HMF) is not a criterion for the botani-cal classification of honey, but is a determining storage-dependent parameter. Fresh honey does not contain HMF, and this parameter is always used when the honey is exported. The Brazilian regulations establish a limit of 60 mg of HMF/kg.11
Sensorial analysis is the examination of a product through the evaluation of the attributes perceptible by the five sense organs (or-ganoleptic attributes): color, odor, taste, touch, texture, and noise. The technique is simple, and extensive work has been performed by members of the International Honey Commission to present the state of the art for sensory analysis applied to honey.12 Sensory evaluation
enables us to distinguish the botanical origin of honey (previously standardized) and also to identify certain defects such as fermentation, off-odors, and flavors.12
Identification of pollen grains occurring inside honey is a useful tool to obtain information about its botanical origin. Avoiding the acetolysis procedure during sample preparation, other structural ele-ments occurring in the honey sediment help to identify a monofloral, bifloral, heterofloral, and extrafloral source and adulterations as well as the hygienic conditions of the product.13,14 Pollen analysis of honey
Preliminary data on Brazilian monofloral honey from the northeast region 717
Vol. 37, No. 4
The aim of this study was to characterize Brazilian monofloral honey from the northeast region through FT-IR ATR spectroscopic, HMF, color, palynological, and sensorial analysis.
MATERIAL AND METHODS
Honey samples
Nine samples of Brazilian organic honey were obtained from the CEARAPI–Apicultura e Produtos Orgânicos Ltda. Company, collected in the northeast of Brazil (Ceará state) during 2009. Six honey samples were stated to be monofloral by the beekeepers, with the common names of anjico, cipó-uva, mangue, marmeleiro, moleque duro, and vassourinha. (The respective scientific names are Mimosaceae: Anadenanthera colubrina,Sapindaceae: Paullinia carpopodea, Rhizophoraceae: Rhizophora mangle, Euphorbiaceae: Croton urundeuva, Boraginaceae: Cordia leucocephala, and Rubiaceae: Borreria verticillata.) Three honey samples were stated to be polyfloral (Polyfloral Hinterlands, Polyfloral Pre Amazon, and Polyflora).
Fourier Transform Infrared Spectroscopy using the Attenuated Total Reflection - (FT-IR ATR) technique
Infrared spectra were collected by direct measurement with Bruker Tensor 27 equipment using the same measuring conditions6 as
previously described.3,4 The conditions of the analysis are listed below.
Equipment: A Tensor 27 Sample Compartment RT-DLaTGS (Bruker Optik GmbH, Germany) equipped with a MKII Golden Gate single-reflection ATR accessory (Specac Inc., Woodstock, GA) was used. The measuring cell consisted of a diamond 2.8 mm in diameter with a refractive index of 2.4 at 1,000 cm−1. The depth of penetration
of the infrared radiation was 2.0 µm at 1000 cm−1 for a sample with a
refractive index of 1.5 (approximately the refractive index of honey). The spectrometer was equipped with a DigiTechTM 163 DLATGS detector, which covers a spectral range from 12,000 cm−1 to 370 cm−1
and operates at room temperature. The software used was Opus 6.5 (Bruker Optik GmbH, Germany).
Honey samples were liquefied in an oven at 55 °C for 8 h and allowed to cool to room temperature before analysis. After a drop of the sample was placed on the surface of the diamond, it was left to equilibrate thermally for 4 min. One hundred scans were recorded for each spectrum in the wavenumber range between 4,000 cm−1 and
550 cm−1 with a spectral resolution of 4 cm−1. Single beam spectra
of all samples were recorded and ratioed against the background spectrum of the clean diamond surface (room temperature air) in order to present the spectra in absorbance. Two spectra were recorded at room temperature using different aliquots of each sample. After each measurement, the diamond was thoroughly washed with Milli-Q water and dried with a soft tissue.
Chemometric modeling of the quantification, calibration, and validation
The PLS calibration was performed for each measurand, using the software Opus 6.5 module Quant, and based on the model described by Ruoff et al.6 and published previously by Almeida-Muradian et al,3,4 PLS cross-validations and test set
validation were performed. The 14 measurands obtained from this analysis were: moisture, electrical conductivity, free acidity, glucose, fructose, erlose, isomaltose, maltose, melezitose, trehalose,
turanose, pH, the sum of glucose plus fructose and the ratios fruc-tose/glucose and glucose/water.
Color analysis
A Hanna (HI-83221) photometer with direct measurement using cuvettes (10 mm) was used for the color analysis. Color classes are expressed in millimeters (mm) Pfund grades, compared with an analytical grade Glycerol Standard Reference.2,10 The Pfund grade
is determined by how many millimeters that spot deviates from the far left of the chart: 0–8 mm is known as “water white,” and 8–17 mm is “extra white.” The darkest, at more than 114 mm to the right, is dark amber.17
HMF analysis
Honey samples were clarified with 0.2% sodium bisulphite to avoid interference. HMF content was measured by spectrophotometry at 284 nm, subtracting the back absorbance at 336 nm according to AOAC International (AOAC).18
Sensorial analysis
Sensorial analysis was performed by a panel of trained persons at the Bee Research Center, Switzerland, based on the procedures described by Piana et al.12
Pollen analysis
Palynological analysis of the honey samples followed the European technique excluding acetolysis, to maintain the original structural elements. Ten grams of well-mixed honey were dissolved in 20 ml of distilled water, and the sediment obtained after centrifu-gation was kept in glycerin jelly on glass slides sealed with paraffin. Counting and pollen identification followed Barth,13 and interpretation
used the methodology of Maurizio and Vorwohl.19
RESULTS AND DISCUSSION
The results of the pollen analysis on the nine honey samples obtained in the Ceará state are presented in Table 1, and show a large spectrum of nectariferous plant species. The blooming in-dications obtained from the beekeepers do not always agree with the diagnosis using pollen analysis. The honey producers indicated samples 1, 2, and 4 as “Polyflora,” meaning heterofloral honey, but this was not confirmed by the palynological analysis, which sho-wed sample 1 as a bifloral honey, sample 2 as an extrafloral honey (lacking any pollen grains), and sample 4 as a monofloral honey of the Lamiaceae family. The third sample analyzed did not agree with the common name (moleque-duro) and the scientific name (Cordia leucocephala) obtained; its pollen grains belong to two very common nectarifeous plants, Piptadenia moniliformis (angico) and a species of the Mytaceae family (murta). Sample 5 was said to be a mono-floral honey of Borreria verticillata, but pollen analysis indicated a bifloral honey of this species and also a Lamiaceae species. Samples 6, 7, and 9 agree with the beekeepers’ monofloral indication. Sample 8, although monofloral, came from another plant taxon of the same family (Paullinia), as was indicated (Serjania).
Honey from Ceará state were previously analyzed by Barth,13 who
de Almeida-Muradian et al.
718 Quim. Nova
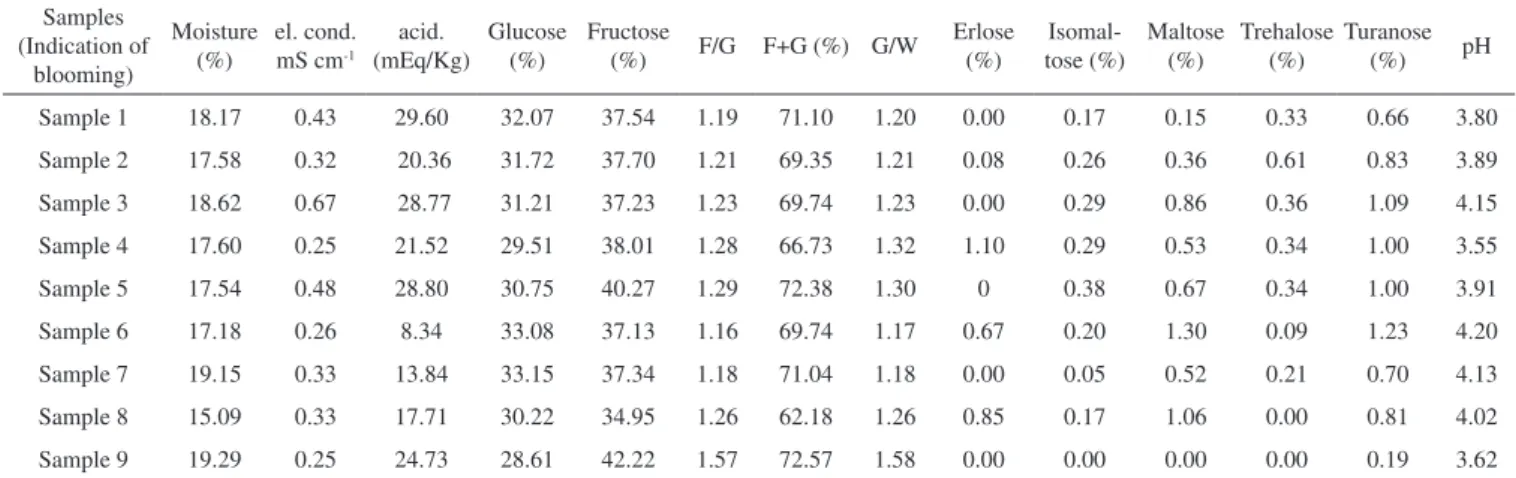
The physicochemical results of the FT-IR analysis are given in Table 2, and the color and HMF analyses are presented in Table 3.
From Table 2, we can see that the moisture content of the nine samples varied from 17.18% to 19.29%, in accordance with the 20% limit established by Brazilian regulations.11 Electrical conductivity
varied between 0.25 and 0.67. pH ranged from 3.55 to 4.20, and the acidity of the samples was between 8.34 and 29.60 mEq/kg. The Brazilian regulations11 establish a free acidity limit of 50 mEq/kg
for honey, in general. The fructose/glucose ratio was 62.18–72.57, the sum of fructose plus glucose was 1.17–1.58, and the glucose/ water ratio was 0–1.10.
As expected, these honey samples contained more fructose (34.95%–42.22%) than glucose (28.61%–33.15%), and small amounts of other sugars such as erlose (0.0%–1.1%), isomaltose (0.0%–0.38%), maltose (0.0%–1.3%), trehalose (0.0%–0.61%), and turanose (0.19%–1.23%). The Brazilian regulation11 only establish
a minimum of 65% of reducing sugars for floral honey using the Fehling method, which is less specific than HPLC and FT-IR, which were able to separate each different sugar.
The clearest sample (Sample 8), which is a monofloral honey of “cipó-uva” [Paullinia carpopodea (Sapindaceae)], had the second lowest HMF content (17.20 mg/kg). The highest HMF content (sam-ple 1 = 289.10 mg/kg) is one of the darkest sam(sam-ples (147 Pfund).
There were no special values to distinguish monofloral honey
(Samples 4, 6, 7, and 8) from the others; therefore, further analysis should be performed to characterize this type of Brazilian honey.
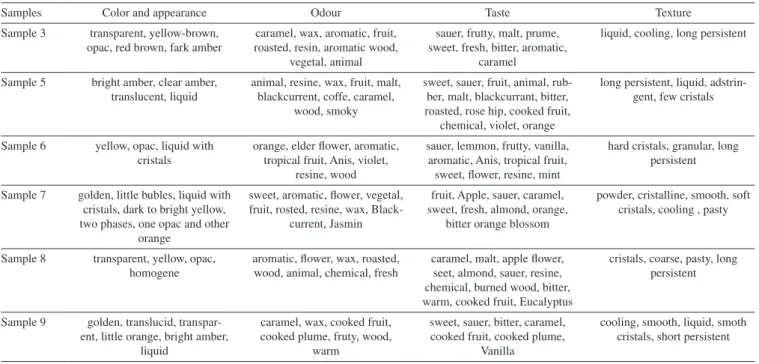
The results of the sensorial analysis are shown in Table 4; ho-wever, samples 1, 2, and 4 were not suitable for sensorial analysis. This is the first time that these types of honey have been analyzed; therefore, there is no standard for comparison. Further analyses
Table 1. Palynological data of honey samples from Ceará, Brazil
Sample Origin Indication of blooming Diagnosis by pollen analysis
1 CEARÁ “Polyflora” Bifloral honey of “espinheiro” (pollen type Leg. Mim.*: Mimosa verrucosa) and “vassourinha” (pollen types Rubiaceae: Borreria densiflora and B. verticillata)
2 CEARÁ “Polyflora of the Hinderlands” Extrafloral honey.
3 CEARÁ “moleque-duro” Bifloral honey of “angico” (pollen type Leg. Mim.: Piptadenia moniliformis) and “murta, rubim”
(pollen type Myrtaceae: Myrcia) 4 CEARÁ “Polyflora of the pré Amazon
rainforest”
Monofloral honey of “bamburral” (pollen type Lamiaceae: Hyptis)
5 CEARÁ “vassourinha” Bifloral honey of “vassourinha“ (pollen type Rubiaceae: Borreria verticillata) and “bamburral“ (pollen type Lamiaceae: Hyptis)
6 CEARÁ “angico” Monofloral honey of “angico” pollen type : Anadenanthera colubrina (Mimosaceae); 7 CEARÁ “marmeleiro” Monofloral honey of “marmeleiro” pollen type :Croton urundeuva (Euphorbiaceae); 8 CEARÁ “cipó-uva” Monofloral honey of “cipó-uva” pollen type: Paullinia carpopodea (Sapindaceae)
9 CEARÁ “mangue” Monofloral honey of “mangue-preto” (pollen type Acanthaceae: Avicennia) *Leg. Mim. = Leguminosae-Mimosoideae, Mimosaceae.
Table 2. Physicochemical analysis results of the honeys using FT-IR ATR
Samples (Indication of
blooming)
Moisture (%)
el. cond. mS cm-1
acid. (mEq/Kg)
Glucose (%)
Fructose
(%) F/G F+G (%) G/W
Erlose (%)
Isomal-tose (%)
Maltose (%)
Trehalose (%)
Turanose (%) pH Sample 1 18.17 0.43 29.60 32.07 37.54 1.19 71.10 1.20 0.00 0.17 0.15 0.33 0.66 3.80 Sample 2 17.58 0.32 20.36 31.72 37.70 1.21 69.35 1.21 0.08 0.26 0.36 0.61 0.83 3.89 Sample 3 18.62 0.67 28.77 31.21 37.23 1.23 69.74 1.23 0.00 0.29 0.86 0.36 1.09 4.15 Sample 4 17.60 0.25 21.52 29.51 38.01 1.28 66.73 1.32 1.10 0.29 0.53 0.34 1.00 3.55 Sample 5 17.54 0.48 28.80 30.75 40.27 1.29 72.38 1.30 0 0.38 0.67 0.34 1.00 3.91 Sample 6 17.18 0.26 8.34 33.08 37.13 1.16 69.74 1.17 0.67 0.20 1.30 0.09 1.23 4.20 Sample 7 19.15 0.33 13.84 33.15 37.34 1.18 71.04 1.18 0.00 0.05 0.52 0.21 0.70 4.13 Sample 8 15.09 0.33 17.71 30.22 34.95 1.26 62.18 1.26 0.85 0.17 1.06 0.00 0.81 4.02 Sample 9 19.29 0.25 24.73 28.61 42.22 1.57 72.57 1.58 0.00 0.00 0.00 0.00 0.19 3.62 *mean of 2 determinations.
Table 3. Color and HMF results of the honeys using reference methods Samples
(Indication of blooming)
Color (Pfund)
Preliminary data on Brazilian monofloral honey from the northeast region 719
Vol. 37, No. 4
Table 4. Sensorial analysis of the samples
Samples Color and appearance Odour Taste Texture
Sample 3 transparent, yellow-brown, opac, red brown, fark amber
caramel, wax, aromatic, fruit, roasted, resin, aromatic wood,
vegetal, animal
sauer, frutty, malt, prume, sweet, fresh, bitter, aromatic,
caramel
liquid, cooling, long persistent
Sample 5 bright amber, clear amber, translucent, liquid
animal, resine, wax, fruit, malt, blackcurrent, coffe, caramel,
wood, smoky
sweet, sauer, fruit, animal, rub-ber, malt, blackcurrant, bitter, roasted, rose hip, cooked fruit,
chemical, violet, orange
long persistent, liquid, adstrin-gent, few cristals
Sample 6 yellow, opac, liquid with cristals
orange, elder flower, aromatic, tropical fruit, Anis, violet,
resine, wood
sauer, lemmon, frutty, vanilla, aromatic, Anis, tropical fruit, sweet, flower, resine, mint
hard cristals, granular, long persistent
Sample 7 golden, little bubles, liquid with cristals, dark to bright yellow, two phases, one opac and other
orange
sweet, aromatic, flower, vegetal, fruit, rosted, resine, wax,
Black-current, Jasmin
fruit, Apple, sauer, caramel, sweet, fresh, almond, orange,
bitter orange blossom
powder, cristalline, smooth, soft cristals, cooling , pasty
Sample 8 transparent, yellow, opac, homogene
aromatic, flower, wax, roasted, wood, animal, chemical, fresh
caramel, malt, apple flower, seet, almond, sauer, resine, chemical, burned wood, bitter, warm, cooked fruit, Eucalyptus
cristals, coarse, pasty, long persistent
Sample 9 golden, translucid, transpar-ent, little orange, bright amber,
liquid
caramel, wax, cooked fruit, cooked plume, fruty, wood,
warm
sweet, sauer, bitter, caramel, cooked fruit, cooked plume,
Vanilla
cooling, smooth, liquid, smoth cristals, short persistent
should be performed to produce a sensorial standard for these types of Brazilian honey.
CONCLUSIONS
Identifications of the source flowers by the beekeepers did not always correspond to the palynological identification. Only four sam-ples had the same identification (producer and microscopic analysis). Common plant names are often misleading; therefore, use of scientific names, in addition, is the best way to identify honey origins.
The clearest honey (sample 8) was also the one with the lowest HMF content and the darkest honey (sample 1) had the highest HMF content.
Honey samples showed values of 17.18%–19.29% for moisture; 0.25–0.67 for electrical conductivity; 8.34–29.60 mEq/kg for acidity; 28.61%–33.15% for glucose; 34.95%–42.22% for fructose; 1.16–1.57 for the fructose/glucose ratio; 62.18–72.57 for the sum of fructose plus glucose; 1.17–1.58 for the glucose/water ratio; 0%–1.10% for erlose; 0%–1.38% for isomaltose; 0%–1.30% for maltose; 0%–0.34% for trehalose; 0%–1.23% for turanose; 3.55–4.20 for pH; 11.26 –289.10 mg/kg for HMF.
The sensorial analysis indicates different sensations for each type of honey.
Further analysis is planned to obtain more samples to confirm this preliminary work.
ACKNOWLEDGMENTS
The authors acknowledgeCAPES, FAPESP and CNPq for scho-larships, A.S. Freitas for assistance with palynological techniques, R. Badertscher, A. Liniger, and C. Cast for helping with FT-IR ATR analysis, and CEARAPI–Apicultura e Podutos Orgânicos Ltda. for the honey samples.
REFERENCES
1. Da-Wen, S.; Infrared Spectroscopy for Food Quality Analysis and
Control,1st ed., Elsevier: Dublin, 2008.
2. Bogdanov, S.; Ruoff, K.; Persano Oddo, L.; Apidologie 2004, 35, S4.
3. http://www.agroscope.admin.ch/publikationen/einzelpublikation/index. html?aid=28839&lang=de&pid=28848, accessed in November 2013. 4. Almeida-Muradian, L. B.; Stramm, Klaus, M.; Estevinho, L. M.; Int. J.
Food Sci. Technol. (2013), doi:10.1111/ijfs.12297.
5. Lichtenberg-Kraag, B.; Apidologie2003, 34, 479.
6. Ruoff, K.; Iglesias, M. T. R.; Luginbühl, W.; Bosset, J.; Bogdanov, S.; Amado, R.;Eur. Food Res. Technol. 2006, 223, 22.
7. Ruoff, K.; Luginbühl, W.; Bogdanov, S.; Bosset, J. O.; Estermann, B.; Ziolko, T.; Kheradmandan, S.; Amadò, R.; Eur. Food Res. Technol. 2007,
225, 415.
8. Ruoff, K.; Luginbühl, W.; Bogdanov, S.; Bosset, J. O.; Estermann, B.; Ziolko, T.; Amado, R.; J. Agric. Food Chem. 2006, 54, 6858.
9. Bogdanov, S.; Bieri, K.; Kilchenman, V.; Gallmann, P.; ALP Forum
2005, 23, 3.
10. Fell, R. D.; Am. Bee J.1978,18, 782.
11. http://sistemasweb.agricultura.gov.br/sislegis/action/detalhaAto.do?me thod=consultarLegislacaoFederal, accessed in November 2013. 12. Piana, M. L.; Persano Oddo, L.; Bentabol, A.; Bruneau, E.; Bogdanov,
S.; Apidologie 2004,35, S26.
13. Barth O. M.; O Pólen no Mel Brasileiro, Editora Luxor: Rio de Janeiro,
1989.
14. Barth, O. M.; Scientia Agrícola2004,61, 342.
15. Barth, O. M.; Bastos, D. H. M.; Maiorino, C.; Benatti, A. P. T.; Ciênc.
Tecnol. Aliment. 2005, 25, 229.
16. Ferreira, E. L.; Lencioni, C.; Benassi, M. T.; Barth, O. M.; Bastos, D. H. M.; Food Sci. Technol. Int.2009,15, 251.
17. Brasil. Ministerio da Agricultura. Secretaria Nacional de defesa Agropecuaria. LANARA: Metodos analisticos oficiais para controle de
produtos de origem animal e seus ingredientes. Laboratorio Nacional
de Referencia Animal: Brasilia, 1981.
18. AOAC; Official Methods of Analysis of the Association of Official
Ana-lytical Chemists. Association of Official Analytical Chemists: Arlington,
1990.