Bol. Ciênc. Geod., sec. Artigos, Curitiba, v. 21, no 2, p.274-272, abr-jun, 2015.
Artigo
PROPOSAL OF A SEQUENTIAL METHOD FOR SPATIAL
INTERPOLATION OF MODE CHOICE
Proposta De Um Método Sequencial Para Interpolação Espacial De Escolha
Modal
Cira Souza Pitombo1
Aline Schindler Gomes Da Costa2 Ana Rita Salgueiro3
1
Universidade de São Paulo, Escola de Engenharia de São Carlos, Avenida dos Trabalhadores São-carlense, 400 - Parque Arnold Schimidt, 13566-590. São Carlos - SP, Brasil.
email:[email protected]
2
Universidade Federal da Bahia, Programa de Mestrado em Engenharia Ambiental Urbana – Escola Politécnica da Universidade Federal da Bahia - Rua Aristides Novis, 2 - 8º andar – Federação, CEP 40.210-630, Salvador -Bahia.
email:[email protected]
3
Universidade Federal do Ceará, Departamento de Geologia, Universidade Federal do Ceará, Campus do Pici - Bloco 912 CEP 60440-900 Fortaleza - CE - Brasil.
email:[email protected]
Resumo:
Bol. Ciênc. Geod., sec. Artigos, Curitiba, v. 21, no 2, p.274-289, abr-jun, 2015.
Palavras-chave: Comportamento relacionado a viagens; Escolha Modal; Estimação Espacial;
Krigagem Ordinária; Árvore de Decisão.
Abstract:
The main objective of this study is to propose a sequential method for spatial interpolation of mode choice for household locations where choices are unobserved based on Decision Tree analysis and Geostatistics. Initially, Decision Tree analysis was applied in order to estimate the probability of mode choice in surveyed households, thus determining the numeric variable to be estimated by Ordinary Kriging. The data used is from the Origin-Destination Survey and Urban Transportation Evaluation Survey, carried out in 2007/2008 in the city of São Carlos (São Paulo/Brazil). The study area selected for geoestatistical modeling is a small region of the city with 110 sampling points. The mode choice was estimated for the study area revealing a tendency of increasing the probability of car usage from the center to the periphery of region. The proposed method can be an alternative to traditional approaches in both non-spatial modeling, especially for the case of lack of data from stated preference survey, as in spatial modeling, allowing estimation in various geographic coordinates.
Keywords:Travel Behavior; Mode Choice; Spatial Estimation; Ordinary Kriging; Decision Tree
Analysis.
1.
Introduction
Individuals choose their travel mode considering diverse factors, classified into three groups: (1) Characteristics of the trip maker; (2) Characteristics of the journey; (3) Characteristics of the transport facility. Thus, travel behavior involves household and personal characteristics, travel variables and spatially correlated factors (Ortúzar and Willumsen, 2011).
Several works corroborate the assertion that travel behavior, especially for the case of mode choice, is strongly related to locations, characterized by urban density - compact vs. spread- out cities -, distribution of economic activities and presence of Traffic Analysis Zones (TAZ) with mixed activities (Cervero and Radisch, 1996; Kitamura et al., 1997).
With the advances of technology, geo-referenced information has become more widely available. Travel demand spatial analysis has been identified as an emerging research area (Páez et al., 2013), hence it is now possible to take in account the variables spatial influence and, consequently, incorporate space more effectively into travel.
Bol. Ciênc. Geod., sec. Artigos, Curitiba, v. 21, no 2, p.274-289, abr-jun, 2015.
Among the techniques of spatial analysis, geostatistics is to be highlighted. Geostatistics enables the development of studies involving spatial autocorrelation, allowing mainly estimating the value of a variable in locations where values are unobserved.
The objective of this study is to propose a sequential method to estimate the mode choice in known geographical coordinates (sampled households) and also in non-sampled households. The method is composed of a sequential application of Decision Tree (DT) analysis and Ordinary Kriging (OK). The DT model estimates probabilities of mode choice in known coordinates. Besides, DT analysis determines the variable to be kriged in the later stage. The OK application can be conducted only with numerical variables - the probabilities estimated by DT model. The OK was applied in one region of the study area. Geo-referenced disaggregated data were used in this work.
The proposed method can be an alternative to traditional approaches. It consists of two main steps: a non-spatial and a spatial model. Decision Tree analysis is presented here as an alternative to traditional econometric models. In spatial modeling stage, the Ordinary Kriging works as a technique that presented a major advantage over other spatial confirmatory techniques as Geographically Weighted Regression, for example. The OK allows estimating probabilities of choice in places not surveyed.
The next section summarizes the recent literature regarding transport and geostatistics and data mining and travel mode choices. The section 3 describes the rationality of the proposed method. In Section 4 DT and OK results are presented, as well as detailed discussions. Finally, the last section presents the work’s general conclusions.
2. Background
2.1 Geostatistics and Transport
There are few applications of geostatistical methods on transportation data and all of them are recently. Is to be noted that most papers available refers to traffic engineering studies (Ciuffo and Punzo, 2011; Mazzella et al., 2011). Miura (2010) presents an approach for predicting car travel time by kriging with good results, indicating that 95% prediction limits are between ±10 minutes and ±30 minutes for travel between two arbitrary points. This prediction method is effective for urban districts with links having changeable travel time.
Zou et al. (2012) proposed an improved distance metric called approximate road network distance (ARND), for solving the problem of the invalid spatial covariance function in kriging caused by the non-Euclidean distance metric. Wang et al. (2012) proposed to solve the traditional research method of statistics on the floating car speed with geostatistics. The spatial structure and the interpolation of floating car speeds are analyzed by exact floating car speed data of the study area in Beijing in May 2005.
Bol. Ciênc. Geod., sec. Artigos, Curitiba, v. 21, no 2, p.274-289, abr-jun, 2015.
2.2 Data mining and Travel Mode Choices
For decades, until nowadays, authors have been investigating the factors that influence mode choice, through different models, such as logit, probit and techniques of data collection as stated preference and revealed preference (Sen et al., 1978.; Ahern and Tapley, 2008).
Most traditional mode choice models are based on the principle of random utility maximization derived from econometric theory. In addition to the econometric techniques used to estimate travel behavior and mode choice, there are several studies that used data mining techniques to investigate the travel behavior. Mode choice modeling can be regarded as a pattern recognition problem in which multiple human behavioral patterns reflected by explanatory variables determine the choices between alternatives (Xie et al., 2007).
Xie et al. (2007) investigates the performance of two emerging pattern recognition data mining methods, decision trees (DT) analysis and neural networks (NN), for work travel mode choice modeling. Shmueli et al. (1996) explored the application of neural networks to a behavioral transportation planning problem. The transportation issue explored is a comparison of travel demand patterns of men and women in Israel. Pitombo et al. (2011) analyzed relationships between socioeconomic, land use, activity participation and travel patterns with Decision Tree (Classification and Regression Tree algorithm) modelling.
The first step of the method here presented is to estimate mode choice, considering socioeconomic variables and measures of the transport system quality, by applying the technique of Decision Tree Analysis (Classification and Regression Tree algorithms). Analysis of DT may be an alternative approach to traditional econometric models because, despite being a non-parametric technique, has no constrains related to input variables (categorical, numeric or dummy) and do not have assumptions such as normality, linearity and multicollinearity. Moreover, it has a high percentage of success even in conditions which are known only socioeconomic variables, with information relating to individuals and not to alternatives.
3. Material And Method
To reach the goal of this work, the stages of the proposed method, summarized in the subsequent subsections, have been fulfilled.
3.1 Data Base Treatment
The study area of this work is the city of São Carlos (São Paulo/Brazil), with 221,936 inhabitants. 96% of the population lives in urban areas, which covers, approximately, 105 km² of 1137.30 km² of total area (IBGE, 2010).
Bol. Ciênc. Geod., sec. Artigos, Curitiba, v. 21, no 2, p.274-289, abr-jun, 2015.
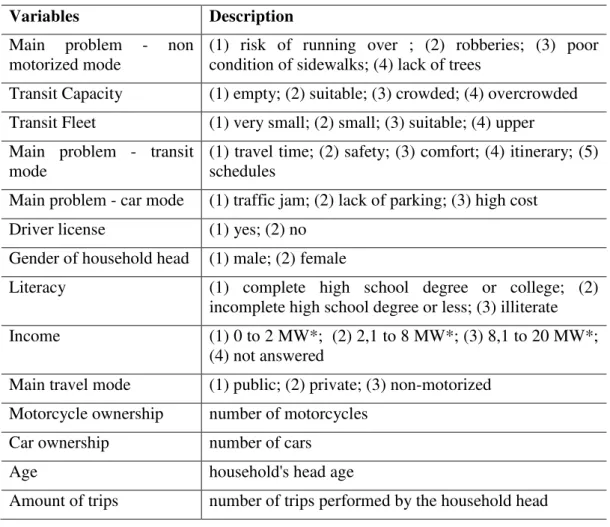
The database preliminary analysis process led to the elimination of some samples when one, or more, of the following situations occurred: (1) inconsistent or missing data, (2) people who did not travel and (3) households with repeated geographic coordinates. Thus, the final sample contains 1,216 individuals, 22 categorical variables and 4 numeric variables. Such information was then associated with geographic coordinates (latitude and longitude in meters) relative to the households. The main variables in the sample and its description can be found in Table 1.
3.2 Decision Tree Analysis application
–
Determining the Numeric Variable
Decision Tree (DT) analysis, especially the CART algorithm, is a simple representation for the existing relationship within a data set (dependent variable – independent variables). It consists of a sequential binary partitioning of the dataset considering the values of the variables. Tree models are fitted by successively splitting the data to form homogeneous subsets, being the result a hierarchical tree of decision rules useful for prediction or classification (Breiman et al., 1984). CART is a segmentation modeling technique that satisfies the following properties: (a) The hierarchy is called tree and each segment is known as node; (b) The root node contains the complete database; (c) The root node is divided sequentially, generating child nodes; (d) When no further data subdivision is possible, the final subgroups are considered terminal nodes or leaves;(e) For construction of the CART, three main elements should be determined: a set of questions delimiting data division, a criterion for evaluation of the best division and a rule for termination of the further subdivisions (stop-splitting rule).
The CART application in this work was used to investigate the variables that contribute to understand individual mode choice. Another key objective for the use of DT analysis was the achievement of the continuous variable for application of Ordinary Kriging- mode estimated probabilities of travel modes.
The geostatistics technique used in the next step of this work, consists of using numeric variables, avoiding the use of the original categorical variable "main travel mode" for the spatial interpolation of mode choice.
Accordingly to the above described, the DT analysis was generated with a sample of 1,216 cases, using the CART algorithm and adopting the parameter of a minimum of 25 observations per terminal node (the stop-splitting rule considering the sample size and the desired homogeneity of the groups). The dependent variable was "Main travel mode", consisting of three categories (1 transit, 2 car/motorcycle and 3 non-motorized). The independent variables were socioeconomic, travel characteristics and the qualitative measures of transport system, as shown in Table 1.
3.3 Spatial Patterns Analysis
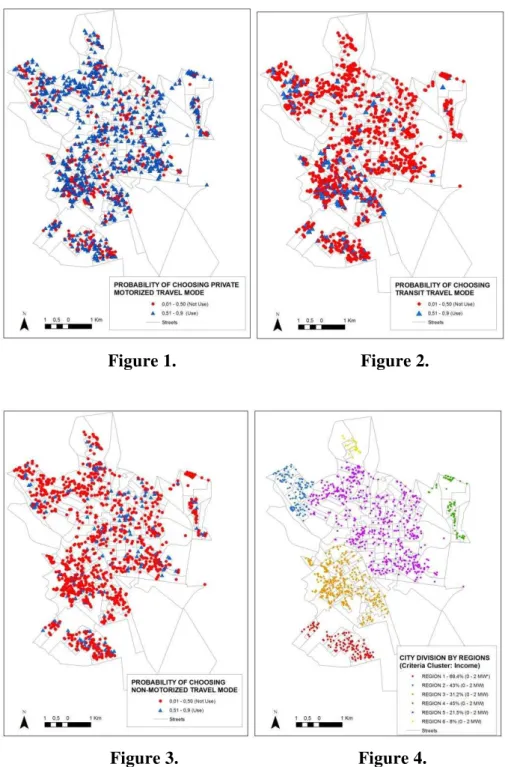
Following the steps of the proposed method, exploratory maps of probabilities of travel mode choice, obtained by DT model, were generated in order to observe spatial patterns. Good estimates for spatial interpolation depend, mainly, on spatial structure of the variable to be kriged. Figure 1, Figure 2 and Figure 3 present the spatial distribution of the probabilities of choosing the private motorized mode, transit and non-motorized travel mode, respectively, derived DT modelling.
Bol. Ciênc. Geod., sec. Artigos, Curitiba, v. 21, no 2, p.274-289, abr-jun, 2015.
the city of São Carlos (São Paulo – Brazil) into small regions, considering the criteria of income, with the objective of defining spatial patterns on smaller regions.
As a result, the Cluster Analysis technique was applied considering the variable income (categorical, by Minimum Wages) and geographic coordinates of households (latitude and longitude in meters). A Two-Step Cluster method was adopted for a total of six groups / regions (Figure 4). The legend shows the percentage of households in the lowest income range (0-2 Minimum Wages) in each region. A detailed analysis of the probability maps for each of the six regions separately, revealed that Region 2 was the one that presented a more diffusive spatial pattern, ranging from the center to the periphery of the area, as shown in Figures 5 (a, b and c).
Table 1: Main variables.
Variables Description
Main problem - non motorized mode
(1) risk of running over ; (2) robberies; (3) poor condition of sidewalks; (4) lack of trees
Transit Capacity (1) empty; (2) suitable; (3) crowded; (4) overcrowded
Transit Fleet (1) very small; (2) small; (3) suitable; (4) upper
Main problem - transit mode
(1) travel time; (2) safety; (3) comfort; (4) itinerary; (5) schedules
Main problem - car mode (1) traffic jam; (2) lack of parking; (3) high cost
Driver license (1) yes; (2) no
Gender of household head (1) male; (2) female
Literacy (1) complete high school degree or college; (2)
incomplete high school degree or less; (3) illiterate
Income (1) 0 to 2 MW*; (2) 2,1 to 8 MW*; (3) 8,1 to 20 MW*;
(4) not answered
Main travel mode (1) public; (2) private; (3) non-motorized
Motorcycle ownership number of motorcycles
Car ownership number of cars
Age household's head age
Amount of trips number of trips performed by the household head
Bol. Ciênc. Geod., sec. Artigos, Curitiba, v. 21, no 2, p.274-289, abr-jun, 2015.
Figure 1. Figure 2.
Figure 3. Figure 4.
This region consists of both low-income households (center of the region) and higher income (peripheral neighborhoods). In addition, Region 2, is a particular one in the city hence it includes the University of São Paulo second campus, an important factor that affects the city dynamics. Therefore, in order to estimate all the area of Region 2 (Santa Felicia), including the locations where mode choice was not observed, a database composed by 110 points was submitted to Ordinary Kriging.
Bol. Ciênc. Geod., sec. Artigos, Curitiba, v. 21, no 2, p.274-289, abr-jun, 2015.
Figure 5 - a. Figure 5 - b. Figure 5 - c.
3.4 Ordinary Kriging (OK) Application
a) Choice of Regionalized Variables
Geostatistics, in general, works with data that has a spatial structure. If, for example, measurements are taken at two different points, differences in the measured values decreases as the two points come closer to each other (Matheron, 1971). The variables, called regionalized, are distributed in space and composed as random functions having a given spatial structure, or, in other words, having a given spatial correlation. The study of regionalized variables starts from the ability to interpolate a given field starting from a limited number of observations, but preserving the theoretical spatial correlation (Goovaerts, 1997).
In this paper, three regionalized variables were used, which have been obtained from Decision Tree Modelling: i) probability of choosing the car, ii) probability of choosing a non-motorized travel mode; iii) probability of selection of transit.
b) Variogram
The empirical variogram allows the quantitative representation of the variation of a regionalized variable in space. The variogram generates information used in kriging algorithm. The variogram function is defined as half the average square difference between points separated by a distance h (Matheron, 1963). The variogram function is calculated as.
Bol. Ciênc. Geod., sec. Artigos, Curitiba, v. 21, no 2, p.274-289, abr-jun, 2015.
After obtaining the experimental variograms, a mathematical function is to be fitted, the one that best represents the variability in study. Of the various theoretical models for adjustments of variogram, the most frequently used are Spherical, Gaussian and Exponential. In this step, the experimental variogram is replaced by a theoretical variogram function, from which is possible to obtain the main parameters for spatial modelling: nugget effect (C0), Range (a) and Sill (C+C0), see Figure 6.
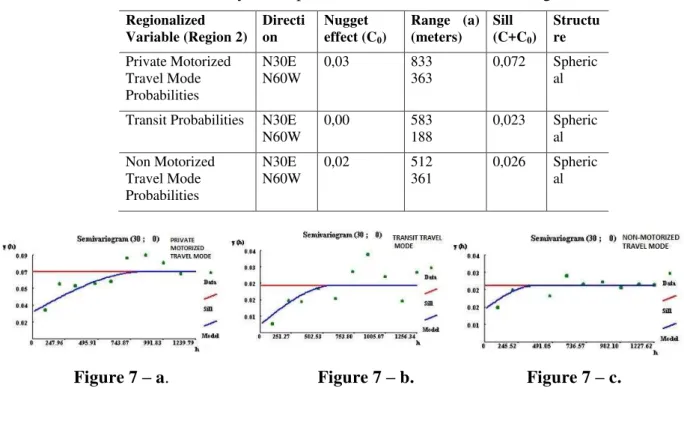
In this work, experimental variograms (constructed based on observed points) for the three variables obtained by DT analysis were constructed and theoretical models were adjusted with spherical functions.
Figure 6: Variogram representing the variable's spatial behavior
Table 2 summarizes the parameters of the theoretical variograms for each regionalized variable for Region 2. Figure 7 (a, b and c) illustrates only the theoretical variograms in the main direction for the three regionalized variable for Region 2: Probabilities of private motorized travel mode; Probabilities of transit and Probabilities of non-motorized travel mode.
Table 2: Summary of the parameters of the theoretical variograms
Regionalized Variable (Region 2)
Directi on
Nugget effect (C0)
Range (a) (meters)
Sill (C+C0)
Structu re Private Motorized Travel Mode Probabilities N30E N60W
0,03 833
363
0,072 Spheric al
Transit Probabilities N30E N60W
0,00 583
188
0,023 Spheric al Non Motorized
Travel Mode Probabilities
N30E
N60W 0,02 512 361 0,026 Spherical
Figure 7 – a. Figure 7 – b. Figure 7 – c.
c) Cross Validation
Bol. Ciênc. Geod., sec. Artigos, Curitiba, v. 21, no 2, p.274-289, abr-jun, 2015.
Z*(xi) at the location is estimated using the remaining n-1 samples. The difference between a data value and the estimated value (Z(xi) - Z*(xi)) gives an indication of how well the data value fits into the neighborhood of the surrounding data values (Wackernagel, 2010).
In order to assess the accuracy of the model determined in theoretical variograms, parameters such as correlation coefficient, mean of residuals and variance of errors, were calculated taking in account the observed and estimated values (30 points randomly selected for Regions 2).
d) Ordinary Kriging (OK)
Ordinary Kriging is the most widely used kriging method. Its main goal is to estimate a value at a point of a region, for which the correspondent variogram is known, using data in neighborhood (Wackernagel, 2010). OK is a method that is often associated with the acronym B.L.U.E. for
“best linear unbiased estimator”. OK is linear because its estimates are weighted linear combinations of the available data. It is unbiased since it tries to have the mean residual equal to zero. It is best because it aims at minimizing the variance of errors (Isaaks and Srivastava, 1989). For the prediction of the variable Z at a location x0, {Z(x0)}, the estimator Z*(x0) is defined as (Goovaerts, 1999):
where the i are weights found by solving the system of equations,
With (h) being the theoretical model for the variogram of the variable Z (fitted to the sample variograms) and being a Lagrange multiplier.
For the interpolation by OK of the three choice probabilities of travel mode, a grid of 100 x 100 meters was established, being its dimensions based on the distance between households in the study area. Kriging maps were generated by interpolation for the three travel modes.
4. Discussions And Conclusion
4.1 Results of DT: Determining the Numeric Variables to be Kriged
Bol. Ciênc. Geod., sec. Artigos, Curitiba, v. 21, no 2, p.274-289, abr-jun, 2015.
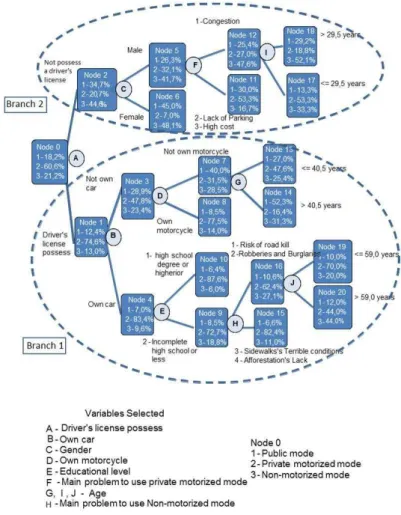
(1) Individuals that have driver’s license (Node 1- 74.6% - uses car/motorcycle, 13.0% uses non-motorized mode and 12.4% uses transit); (2) Individuals that do not have driver’s license (Node
2 - 44.6% uses non-motorized mode, 34.7% transit and 20.7% uses car/motorcycle).
The selection of “Driver license” as the most important variable in travel mode decision could be
justified by the strong correlation of this variable and income and car ownership. These variables are known to have robust influence on mode choice.
Subsequently, CART algorithm fragmented dataset into groups. The groups were then divided successively considering the independent variables values. At the end of data segregation 11 terminal nodes were obtained. The terminal nodes are the basis to evaluate travel behavior.
Figure 8: Decision tree - The most used transport's mode (dependent variable)
Bol. Ciênc. Geod., sec. Artigos, Curitiba, v. 21, no 2, p.274-289, abr-jun, 2015.
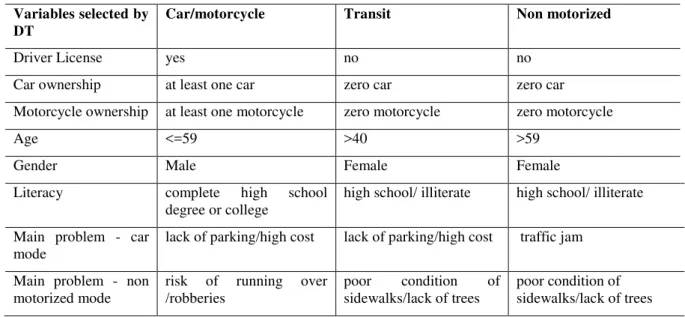
Table 3: Variables selected by DT and their relationship on mode choice
Variables selected by DT
Car/motorcycle Transit Non motorized
Driver License yes no no
Car ownership at least one car zero car zero car Motorcycle ownership at least one motorcycle zero motorcycle zero motorcycle
Age <=59 >40 >59
Gender Male Female Female
Literacy complete high school
degree or college high school/ illiterate high school/ illiterate Main problem - car
mode lack of parking/high cost lack of parking/high cost traffic jam Main problem - non
motorized mode
risk of running over /robberies
poor condition of sidewalks/lack of trees
poor condition of sidewalks/lack of trees
For the analysis with Ordinary Kriging, the results of the DT model were used as regionalized variables: Probability of choosing the car/motorcycle, Probability of choosing transit and Probability of choosing the non-motorized travel mode. These data are linked to geographic coordinates of 110 samples of Regions 2.
4.2 Results of Ordinary Kriging
As previously mentioned, approximately 30% of the samples of each region was randomly selected for cross-validation purposes, which allowed obtaining for 30 surveyed points in regions 2, the correspondent estimated values according to probability of travel mode based on the determined variograms.
In order to access quality of obtained models some statistical parameters, such as correlation coefficient, mean of residuals and variance of errors, were calculated and can be observed in Table 4. In addition, the percentage of correct estimation of travel mode, considering the estimated and observed probabilities of travel mode, was also obtained.
Table 4: Cross-Validation parameters
Regionalized Variables/Region 2
Correlation Coefficient
Mean of Residuals
Variance of Erros
% Correct Estimation Private Motorized Travel
Mode Probabilities
0,202 -0,003 0,079 49%
Transit Probabilities -0,228 -0,004 0,032 73%
Non-Motorized Travel
Mode Probabilities 0,237 0,003 0,027 79%
Bol. Ciênc. Geod., sec. Artigos, Curitiba, v. 21, no 2, p.274-289, abr-jun, 2015.
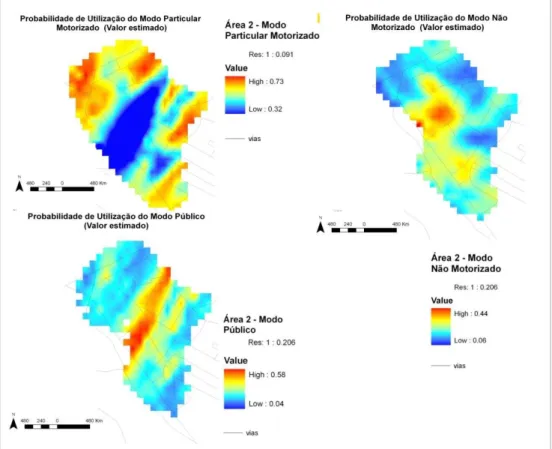
Maps generated by Ordinary Kriging interpolation for the three travel modes are illustrated in Figure 9.
Results in the case of the probability of using private motorized travel mode, show that this travel mode is more likely to be used in the periphery of the region. Thus, the predisposition for car usage decreases considering the center proximity. Is to be highlighted that the main direction of this variogram (N30E) is clearly translated to the respective map. The kriging results for the transit and non-motorized travel mode also could be observed in the same figure. The predisposition to use other travel modes is opposing to the car usage. The tendency to use transit and non-motorized travel mode increases from the periphery to the center area.
The results of spatial interpolation are consistent with the reality of the region. Locations with higher probability of car/motorcycle use are exactly those corresponding to neighborhoods of higher income population. Conversely, the center of Region 2, which is the least probable to use the car, corresponds to low-income households.
Figure 9: Interpolated values of mode choice's probabilities
4.3. Conclusion
The results obtained in this study allowed determining the probabilities of mode choice in household locations where choices are unobserved through this procedure (sequential application of Decision Tree analysis and Ordinary Kriging).
Bol. Ciênc. Geod., sec. Artigos, Curitiba, v. 21, no 2, p.274-289, abr-jun, 2015.
susceptible to use a particular travel mode, considering socioeconomic and transportation system characteristics, selected by the data partition algorithm.
The resulting maps, obtained from Ordinary Kriging, allowed determining that there is a trend in the use of private motorized travel mode, which increases from the center to periphery. While, opposite trend was observed for the other travel modes in the same area. Cross-validation showed good results considering mean of residuals and variance of errors. Besides, a percentage of correct responses over 70%, in case of non-motorized travel mode and transit, were achieved. An important aspect to be taken into consideration is that the regionalized variables are unnatural (not directly measured), were produced by a nonparametric model, the DT model. Moreover, the process developed in this study probably suffers from the influence of different errors from this type of data and the use of sequential estimation models (spatial and non-spatial).
Nevertheless, the innovative characteristic of this study should be taken into account. The two-step method presented is based in unusual techniques in the analysis of mode choice. However, the results show the success in this combination, which allowed a preliminary assessment of spatial particularities of the study area, and, it also emphasized the necessity of robust/solid information basis, special when dealing with questionnaires.
ACKNOWLEDGEMENTS
This work was supported by the Conselho Nacional de Desenvolvimento Científico e Tecnológico (CNPQ) and Fundação de Amparo à Pesquisa do estado de São Paulo (FAPESP).
BIBLIOGRAPHICAL REFERENCES
Ahern, Aoife A. and Nigel Tapley. “The use of stated preference techniques to model modal choices on interurban trips In Ireland”. Transportation Research Part A: Policy and Practice 42 (2008): 15-27.
Bhat, Chandra and Huimin Zhao. “The spatial analysis of activity stop generation”. Transportation Research Part B 36 (2002): 557–575.
Bhat, Chandra R “Work travel mode choice and number of non-work commute stops”. Transportation Research Part B: Methodological 31 (1997): 41–54.
Breiman, Leo., Jerome Friedman., Charles J. Olshen, and R.A. Stone. Classification and Regression Trees. Wadsworth International Group, California, 1984.
Cervero, Robert. and Carolyn Radisch. “Pedestrian versus automobile oriented neighborhoods”. Transport Policy3 (1996): 127-141.
Ciuffo, Biagio and Vincenzo Punzo “Kriging meta-modelling in the verification of traffic micro-simulation calibration procedure. Optimization algorithms and goodness of fit measures”. Paper presented at the TRB 90th Annual Meeting Compendium of Papers, 2011.
Goovaerts, Pierre. “Geostatistics for Natural Resources Evaluation”. Applied Geostatistics Series (1997). New York, 483. Oxford: Oxford UniversityPress,
Bol. Ciênc. Geod., sec. Artigos, Curitiba, v. 21, no 2, p.274-289, abr-jun, 2015.
IBGE - Brazilian Institute of Geography and Statistics. Census Brazilian population in 2010. Accessed on August 20, 2012. In Portuguese. http://www.ibge.gov.br.
Isaaks, Edward H.. and R. Mohan Srvastava. An introduction to applied Geostatistics. Oxford University Press. 1989.
Ji, Jue and Xiaolu Gao. “Analysis of people's satisfaction with public transportation in Beijing”. Habitat International 34 (2010):464-470.
Kitamura, Ryuichi; Patricia L Mokhtarian and Laura Laidet. “A micro-analysis of land use and travel in five neighborhoods in the San Francisco Bay Area”. Transportation 24 (1997): 125-158.
Matheron, Georges. “The theory of regionalized variables and its applications”. Technical Report 5 (1971), Paris School of Mines. Cah. Cent. Morphol. Math., Fontainbleau..
Matheron, Georges “Principles of geostatistics”. Economy Geology 58 (1963):1246-1266. Mazzella, Alessandro, Claudia Piras and Francesco Pinna. “Use of Kriging Technique to Study Roundabout Performance”. Transportation Research Record: Journal of the Transportation Research Board 2241 (2011).
Miura, Hidetoshi. A study of travel time prediction using universal kriging. TOP, 18(1): 257– 270, 2010.
Ortúzar, Juan de Dios and Luis G. Willumsen. Modelling Transport. Wiley, 4th Edition, 2011. Páez, Antonio, Fernando A López., Manuel Ruiz and Catherine Morency, C. “Development of an indicator to assess the spatial fit of discrete choice models”. Transportation Research Part B 56 (2013): 217-233.
Pas, E.I. “The effect of selected sociodemographic characteristics on daily travel-activity behavior”. Environment and Planning A. 16A (1984): 571-581.
Peer, Stefanie, Jasper Knockaert, Koster, Paul, Yin-Yen Tseng and Erik T Verhoef. “ Door-to-door travel times in RP departure time choice models: An approximation method using GPS data”. Transportation Research Part B 58 (2013): 134-150.
Pitombo, Cira Souza, Antonio Jorge Sousa, Markin Birkin and José Alberto Quintanilha.
“Comparing different spatial data analysis to forecast trip generation”. In: World Conference on Transport Research Society, 2010,Lisbon. Proceedings of the 12th WCTR. Lisboa. 2010.
Pitombo, Cira Souza, Eiji Kawamoto and Antonio Jorge Sousa. “An exploratory analysis of relationships between socioeconomic, land use, activity participation variables and travel patterns”. Transport Policy 18 (2011): 347-357.
Pitombo, Cira Souza., Ana Rita Salgueiro, Aline S. G. Costa and Cassiano A. Isler. “A Two-step method for mode choice estimation with socioeconomic and spatial information”. Spatial Statistics 11(2015): 45-64.
Rodrigues Da Silva, Antonio N. “Preparation of a travel database for assistance of development researches in transportation planning area”. FAPESP Report, Case No. 04/15843-4. School of Engineering of São Carlos, University of São Paulo, Brazil. In Portuguese. 2008.
Sen, Ashish., Siim Sööt and Efi Pagitsas “The logit modal split model: Some theoretical considerations”. Transportation ResearchPart A 12 (1978): 321-324.
Bol. Ciênc. Geod., sec. Artigos, Curitiba, v. 21, no 2, p.274-289, abr-jun, 2015.
Wackernagel, Hans. Multivariate Geostatistics: An introduction with applications. Springer, Third Edition. 2010.
Wang, Young, Dafang Zhuang and Haode Liu. “Spatial Distribution of Floating Car Speed”. Journal of Transportation Systems Engineering and Information Technology 12 (2012): 36-41. Xie, Chi., Jinyang Lu and Emily Parkany. “Work Travel Mode Choice Modeling with Data Mining: Decision Trees and Neural Networks”. Transportation Research Record: Journal of the Transportation Research Board 1854 (2007): 50-61.
Zou, Haixiang, Yang Yue, Qingquan Li and Anthony G.O. Yeh. “An improved distance metric for the interpolation of link-based traffic data using kriging: a case study of a large-scale urban road network”. International Journal of Geographical Information Science 26 (2012): 667–689, 2012.