Short Report
0103 - 5053 $6.00+0.00*e-mail: [email protected]
Direct Determination of Plant-Growth Related Metabolites by Capillary Electrophoresis with
Spectrophotometric UV Detection
Nilson A. Assunção,a Sandra C. C. Arruda,b Adriana P. Martinellib and Emanuel Carrilho*,a
aInstituto de Química de São Carlos, Universidade de São Paulo, Avenida Trabalhador São Carlense 400,
CP 780, 13560-970 São Carlos-SP, Brazil
bLaboratório de Biotecnologia Vegetal, Centro de Energia Nuclear na Agricultura, Universidade de São Paulo,
CP 96, 13400-970 Piracicaba-SP, Brazil
A detecção de hormônios e reguladores de crescimento em plantas é de grande interesse em uma enorme variedade de estudos biológicos. Visando este propósito nós desenvolvemos um método simples baseado em eletroforese capilar (CE) para a separação de diferentes classes de reguladores de crescimento de plantas como as auxinas, citocinina, ácidos giberélico e abscíssico. Foi utilizada CE, com detecção na região de UV; as condições de separação foram: fosfato de potássio como tampão, em concentração de 25 mmol L-1, pH 12 ou 2,5, tempo de injeção 5 s,
elevando por sinfonamento o capilar, à altura de 10 cm e voltagem de separação de 22 kV. A absorbância foi fixada a 220 nm ou 270 nm, dependendo da classe do fitohormônio. Nestas condições os fitohormônios (IAA, GA3, ABA, picloram, zeatina e BAP) foram separados em um tempo de 3 a 5 min. O material oriundo de planta para verificar a possibilidade de detecção de hormônio/reguladores de crescimento de plantas foi a citro (Citrus sinensis L. Osbeck) callus no estágio de multiplicação. Na amostra de tecido de planta, a zeatina foi detectada com sucesso. Os resultados confirmaram a pontencialidade do uso de CE como um método eficiente, de baixo custo e alternativo para a detecção dessa classe de compostos em tecidos de plantas.
The detection of plant hormones and growth regulators is of great interest for many biological studies especially in the determination of metabolites related to plan growth and differentiation. In this work, we propose a simple method based on capillary electrophoresis (CE) for the separation of different classes of plant growth regulators such as auxins, cytokinins, gibberelic acid and abscisic acid. CE with UV detection was used and the analytical conditions were as follows: phosphate buffer 25 mmol L-1, for all the measurements and the separation conditions pH 12 or
2.5, by hydrodynamic injection 5 s at 10 cm and separation voltage of 22 kV. The absorbance detection was fixed at either 220 nm or 270 nm depending on a given phytohormone class. Under these conditions, phytohormones (Indole-3-acetic acid (IAA), Gibberellic acid (GA3), Abscisic acid (ABA), picloram, zeatin and 6-Benzylaminopurine (BAP) were separated in approximately 3 to 5 min. The plant material used to verify the possibility of detection of hormone/plant growth regulators was citro (Citrus sinensis L. Osbeck) callus in the multiplication stage. In the plant tissue sample, zeatin was successfully detected. The results confirmed the potential use of CE as an efficient alternative and simple method to the classical procedures used for phytohormone detection in plant tissues.
Keywords: plant metabolites, capillary electrophoresis, phytohormones, Citrus spp
Introduction
The determination and characterization of metabolites involved in plant growth play an important role in plant morphogenesis studies. Among the substances involved in this process are the plant hormones, which are
traditionally classified in the following groups: auxins, cytokinins, gibberellins, abscisic acid, and ethylene. The main endogenously produced hormones for each group are indole-3-acetic-acid (IAA), zeatin, gibberellic acid (GA3), abscisic acid (ABA) and ethylene, respectively.1 Due to the
to evaluate the dynamics of these substances during plant growth and differentiation.2
Usually the determination of plant hormones has been carried out by different techniques such as high efficiency liquid chromatography (HPLC),3 gas chromatography
(GC),4 immunoassays (ELISA) or radioimmunoassays,5
however, they require substantial sample purification which is time consuming.6 These factors could be minimized or
sometimes eliminated using capillary electrophoresis (CE),7
which has the advantage of working with small sample/ reagents volumes and propitiates an effective separation of sample components, reducing both time and cost per
analysis.8
CE has been used as a valuable separation technique, mainly for biological and pharmaceutical samples9 since it
allows a highly efficient separation of sample components, leading to faster results, and can be widely applied, ranging from the determination of small inorganic ions to large and complex proteins.10 Due to these characteristics it can
be a valuable tool in biotechnology and microanalysis of biological samples. In phytochemical analysis, CE has been used for the determination of plant metabolites, such as flavonoids, alkaloids, phenolic acids among others. In a review article, Eash and Bushway11 discuss
the potentialities of CE for pesticides and plant-growth regulators analysis. They point out the potentiality of this technique when coupled to sensitive detectors such as laser-induced fluorescence detection (LIF). The determination of metabolites related to plant growth and differentiation is of particular interest in biological studies. Phytohormones are among the substances directly involved in plant morphogenic expression since auxins and gibberellins are responsible both for cellular division and expansion, and for the expression of specific genes related to plant development.4 In this way, was determined ABA using a
methodology based on a CE-LIF detection system.12 With
this method, the detection limit for ABA was 5.5 mol for an injection volume of 5 mL, showing a better selectivity and sensitivity than the conventional methods used for ABA determination.
This report proposes a methodology for the direct determination of hormones and/or plant growth regulators in Citrus callus under in vitro conditions by capillary electrophoresis with spectrophotometric detection. In this work, different classes of phytohormones such as auxins (picloram and IAA), cytokinins (zeatin, benzylaminopurine (BAP)) gibberellic acid (GA3) and abscisic acid (ABA) were preliminary validated in simultaneous separation for each class of phytohormones using standard solutions, followed by the analysis of extracts of Citrus callus cultures for the detection of this plant hormones.
Experimental
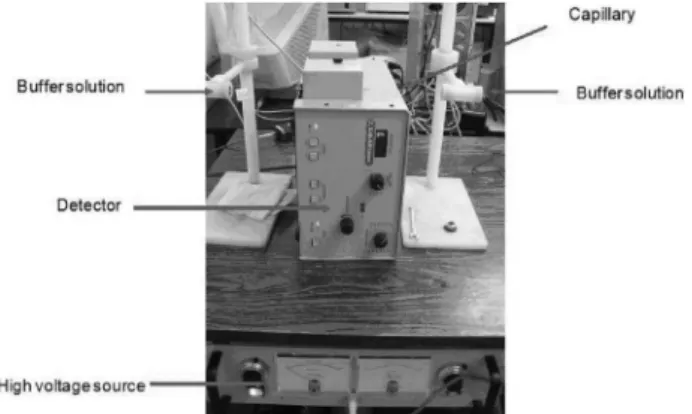
Instrumentation
Experiments were performed using a capillary electrophoresis system assembled in our laboratory. This system was equipped with a high-voltage power supply up to 30 kV (Spellman, Hauppauge, NY) coupled to a variable wavelength UV-Vis detection system from LabAlliance (State College, PA, USA) as illustrated in Figure 1. A Chromatography Station for Windows, version 1.7 (Data Apex, Prague) was used for data acquisition and analysis. For all measurements, bare fused-silica capillaries from Polymicro Technologies (Phoenix, AZ, USA) with an internal diameter of 50 µm and a total length of 50 cm (28 cm of effective length) were used. A spectrophotometer U-2000 (Hitachi) was used to obtain the UV-Vis spectrum for each analyte in order to select the appropriate absorption wavelengths.
Reagents and solutions
All standard-solutions at the range of concentration between 700-400 µg mL-1, were prepared in purified water
from Milli-Q system, Millipore (Milford, MA, USA) with analytical grade reagents (Sigma-Aldrich). For auxins (IAA and picloram), gibberellic acid (GA3)and abscisic acid (ABA) separation phosphate buffer (25 mmol L-1) at pH 12
and detection at 220 nm was used, while for cytokinins (BAP and zeatin) determination the same buffer, at pH 2.5 and detection at 270 nm, was used.
Capillary conditioning and analysis
Before the electrophoresis analysis the capillary was rinsed daily with water (2 min), followed by NaOH 1.0 and 0.1 mol L-1 (3 min each) and buffer (for 5 min). Between each
analysis the capillary was rinsed with the carrier buffer. The samples (phytohormone standard solutions or plant extracts from Citrus callus cultures) were hydrodynamically injected during 5 s by raising the capillary injection end 10 cm higher than the detection end.
Plant material and extraction procedure
Callus (non-organized mass of cells grown in vitro
under specific conditions) obtained from nucellar tissues of Citrus sinensis L. Osbeck13 and presenting embryogenic
potential was cultured in MT culture medium during multiplication stage and used as the plant material. For the extraction procedure, 1.0 g fresh weight samples of embryogenic callus C. sinensis were frozen and ground in a mortar with 1 mL of methanol/H2O solution (4:1) in an ice-bath and then centrifuged (4 oC at 4900×g for 20 min).
After centrifugation, the supernatant was filtered (Millipore, 0.22 µm) from Millipore (Milford, MA USA) and a total of 1.2 mL of plant extract was collected. The samples were divided in aliquots and analyzed by CE.
Preliminary validation data
Analytical curves were established from solutions of phytoregulators at different concentrations, ranging from 75 to 300 µg mL-1 for linearity and limits of detection
and quantification assessment. In addition to the area, the repeatability in terms of migration time was also calculated for both inter and intra-day experiments.
Results and Discussion
The use of CE for the analysis of plant tissue samples was very straightforward since it was possible to work with samples that were not submitted to any extensive clean-up or extraction procedures.14 The instrumentation used in
this experiment was very simple. It basically consisted of a capillary tube, a high-voltage power supply, a
variable-wavelength UV-Vis detector, and vials for buffers and samples. Data acquisition is carried out in a personal computer via an acquisition board.
In general, UV system sensibility shows some deficiencies related to its detection limits when the concentration of the compound of interest in real samples is minimal such as endogenous plant hormone levels or other metabolites.15 In order to reduce these deficiencies,
two strategies could be used: (i) on-line sample pre-concentration methods, which are cheap, and can improve the sensitivity in several orders of magnitude,16 however
these are arduous and diminish the analytical frequency. These disadvantages make this method inappropriate for large volumes; (ii) the use of the laser-induced fluorescence detection system would be another way to improve the detectability and sensitivity of the method.17 For the
phytohormones, which do not have a natural fluorescence, derivatization reactions are widely described in the literature and can be used,18 however, derivatization steps
are always susceptible to error and involve cost and are time consuming.
This work has been carried out in home-made equipment (see Figure 1), the sample was manually injected by siphoning, and therefore it may be subject to some inaccuracy. Table 1 shows that the data obtained for repeatability studies were acceptable according to method validation protocols recommended for CE and LC in bioanalytical applications19 since the correlation
coefficient (Table 2) and the relative standard deviation (RSD, Table 1; ca. 8% average) values were appropriate. Due to the differences in the UV absorption spectra of the plant hormones, two different wavelengths were used for maximum sensitivity. In this way, for auxins and acidic compounds, 220 nm was used for detection while for cytokinins 270 nm was selected.
The determination of optimal pH condition for the buffer solution was carried out according to the dissociation properties of each phytohormone. Since IAA, GA3, ABA and picloram have an acidic behavior in
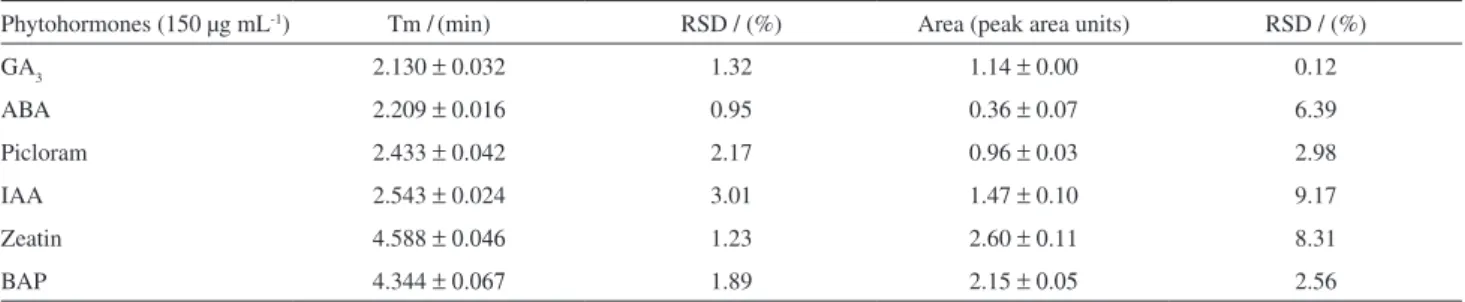
Table 1. Values of migration time and area obtained for hydrodynamic injection of six phytohormones to estimate the analytical repeatability
Phytohormones (150 µg mL-1) Tm /(min) RSD / (%) Area (peak area units) RSD / (%)
GA3 2.130 ±0.032 1.32 1.14 ± 0.00 0.12
ABA 2.209 ±0.016 0.95 0.36 ± 0.07 6.39
Picloram 2.433 ±0.042 2.17 0.96 ± 0.03 2.98
IAA 2.543 ±0.024 3.01 1.47 ± 0.10 9.17
Zeatin 4.588 ±0.046 1.23 2.60 ±0.11 8.31
BAP 4.344 ±0.067 1.89 2.15 ±0.05 2.56
aqueous medium and zeatin and BAP a basic behavior, the buffer solution (phosphate buffer 25 mmol L-1)
was adjusted to pH 12 and 2.5, respectively. It is also important to mention that these pH values correspond to the pKa, values in which phosphate buffer presents its best buffering power. These conditions were determined after several electrophoretic runs for each phytohormone prepared as a standard-solution and the selection of these conditions was a consequence of parameters such as: short analysis time, reduced signal noise, good peak resolution among others. After optimization, the final separation conditions were evaluated using a solution containing a mixture of 20 µL of each phytohormone (standard-solutions).
Figures 2A and 2B show the results obtained after the method optimization regarding pH and buffer concentration, separation voltage, and injection time. It can be observed that all six analytes were determined and that the peaks presented good signal-to-noise ratios, indicating that the analysis conditions were efficient. It is also possible to verify the separation power of this technique, since the peaks show a good resolution and were obtained in a relatively short analysis time (ca. 3-5 min). As a comparison, we obtained the peak signal for IAA and tryptophan with ca. 10 min of analysis using micellar electrokinetic chromatography, a more complex separation method.20 Our results indicate that
capillary electrophoresis can be a powerful tool for the analysis of this kind of matrix, mainly when compared with other traditional methods such as HPLC, ELISA, immunoassays, or GC. Such methods are very expensive, not environmentally safe; may produce toxic residues and most importantly, need many steps during sample preparation.
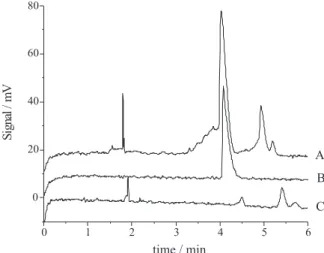
The application of our method for the analysis of
Citrus callus samples for all six analytes showed that it was possible to detect the presence of zeatin (Figure 3), which is an endogenous plant hormone. The detection of zeatin in these samples was carried out in ca. 5 min
analysis time plus 30 min total sample preparation time. It is important to note that in these samples the baseline is not as clear as in the standard solution. This is expected since plant samples present a complex mixture of compounds when compared to the standard solutions of phytohormones, however, such background level is acceptable for this type of analysis.
Figure 2.Capillary electrophoresis of several plant hormones. A) An acid standard mixture that contains 5 µmol L-1 of (1) GA3, (2) ABA,
(3) picloram, and (4) IAA. Analysis condition: 25 mmol L-1 phosphate
buffer pH 12 and detection at 220 nm. B) A cytokinins standard mixture containing 10 µmol L-1 of (1) zeatin and (2) BAP. Analysis conditions:
phosphate buffer 25 mmol L-1 pH 2.5 and detection at 270 nm. In both
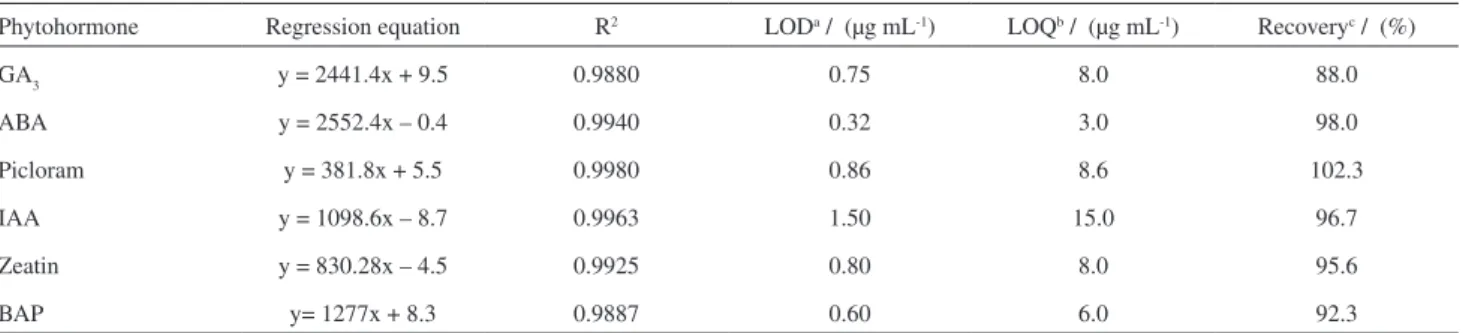
conditions the electric field gradient was 400 V cm-1. Table 2. Analytical results for phytohormones
Phytohormone Regression equation R2 LODa / (µg mL-1) LOQb / (µg mL-1) Recoveryc / (%)
GA3 y = 2441.4x + 9.5 0.9880 0.75 8.0 88.0
ABA y = 2552.4x – 0.4 0.9940 0.32 3.0 98.0
Picloram y = 381.8x + 5.5 0.9980 0.86 8.6 102.3
IAA y = 1098.6x – 8.7 0.9963 1.50 15.0 96.7
Zeatin y = 830.28x – 4.5 0.9925 0.80 8.0 95.6
BAP y= 1277x + 8.3 0.9887 0.60 6.0 92.3
Figure 3. Electropherogram of Citrus callus sample showing zeatin detection. A: plant extract spiked with zeatin standard to 20 µmol L-1; B:
Zeatin standard 20 µmol L-1; C: Plant extract without spiking.Analysis
conditions: phosphate buffer 25 mmol L-1 pH 2.5, E = 400 V cm-1 and
detection at 220 nm
Conclusions
The use of the CE allowed a fast detection and separation of phytohormones in standard solutions and also in real plant sample extracts. Using this method, zeatin, which is an endogenous hormone, was detected in embryonic callus in its multiplication stage. But this method is useful for all types of hormones which have a chemical structure similar to Zeatin. Among the characteristics of this method of analysis it should be emphasized the low reagent consumption combined with minimal generation of residues and good capillary electrophoresis resolution. Additionally, the CE method developed here offers much faster analysis-times than any other previously described method, demonstrating a great potential for application in biotechnology areas, in which the search for an efficient and fast analytical technique is crucial since the experiments frequently occur in a timely fashion, normallyrequiring large number of samples.
Acknowledgments
Authors are grateful to FAPESP (Proc. # 99/12402-7, 00/11647-5 and 02/06266-8) for research grant and scholarship supports and to CNPq for research fellowships.
References
1. Mohr, H.; Schopfer, P. In Plant Physiology; Mohr, H.; Schopfer, P., eds.; Springer-Verlag: Berlin Heidelberg, 1998, pp. 383-408.
2. Silveira, V.; Floh, E. I. S.; Handro, W.; Guerra, M. P.; Plant Cell Tiss. Org. Cult.2004, 76, 53.
3. Sanchez, F. G.; Díaz, A. N.; Pareja, A. G.;J. Chromatogr., A
1996, 723, 227.
4. Davies, C.; Hein, M. B.; Neely, B. C.; Sharp, C. R.; Carnes, M. G.; Anal. Chem. 1985, 57, 683.
5. Weiler, E. W.; Annu. Rev. Plant Physiol. 1984, 35, 85. 6. Jiménez, V. M.; Guevara, E.; Herrera, J.; Bangerth, F.; Plant
Cell Rep. 2001, 20, 92.
7. Weston, A.; Brown, P. R.; HPLC and CE: Principles and Practice, Academic Press: San Diego, USA, 1997, p. 134. 8. Kennedy, R. T. Anal. Chim. Acta1999, 400, 163.
9. Karger, B. L.; Cohen, A. S.; Guttman, A.; J. Chromatogr., B
1989, 492, 585.
10. Olsson, J.; Claeson, K.; Karlberg, B.; Nordström, A. C.; J. Chromatogr., A1998, 824, 231.
11. Eash, D. T.; Bushway, R. J.; J. Chromatogr., B2000, 800, 281.
12. Liu, X.; Ma, L.; Lin, Y. W.; Lu, Y. T.; J. Chromatogr., A2003, 1021, 209.
13. Grosser, J. W.; Gmitter Jr., F. G.;Plant Breeding Reviews 1990, 8, 339.
14. Szekely, L.; Freitag, R.; Anal. Chim. Acta2004, 512, 39. 15. Landers, J. P.; Handbook of Capillary Electrophoresis, 2nd ed.,
USA, 1996, p. 189.
16. Sentellas, S.; Puignou, L.; Galceran, M. T.; J. Sep. Sci. 2002, 25, 975.
17. Johnson, M. E.; Landers, J. P.; Electrophoresis2004, 25, 21. 18. Pinto, D. M.; Arriaga, E. A.; Craig, D.; Angelova, J.; Sharma,
N.; Ahmadzadeh, H.; Dovichi, N. J.; Boulet, C. A.; Anal. Chem.
1997, 69, 3015.
19. Ribani, M.; Grespan Bottoli, C. B.; Collins, C. H.; Fontes Jardim, I. C. S.; Costa Melo, L. F.; Quim. Nova2004, 27, 771.
20. Chan, K. C.; Muschik, G. M.; Issaq, H. J.; J. Chromatogr., A
1995, 718, 203.
Received: November 30, 2007
Web Release Date: November 17, 2008